
ARPA
ARPA Chain
| تریدر | نوع سیگنال | حد سود/ضرر | زمان انتشار | مشاهده پیام |
|---|---|---|---|---|
 Alpha-GoldFXRank: 32114 | خرید | حد سود: تعیین نشده حد ضرر: تعیین نشده | 12/6/2025 |
Price Chart of ARPA Chain
سود 3 Months :
سیگنالهای ARPA Chain
Filter
Sort messages by
Trader Type
Time Frame
Alpha-GoldFX
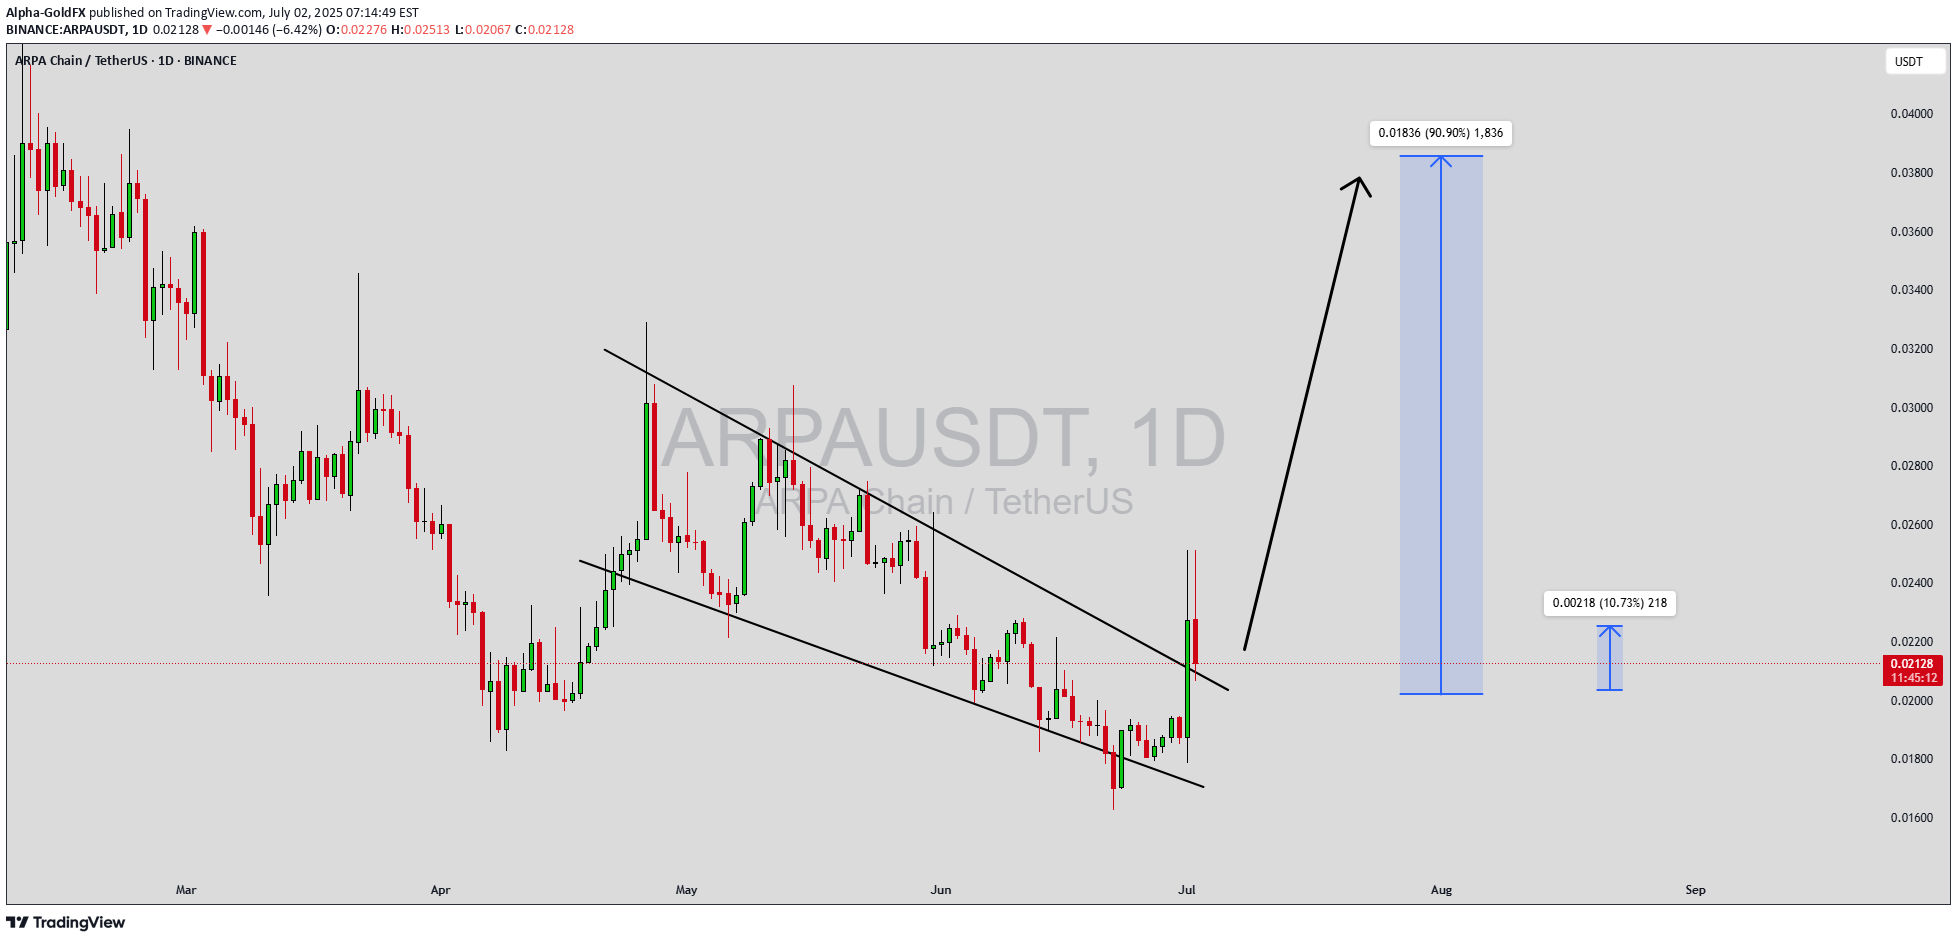
موج صعودی بزرگ ARPAUSDT: آیا آماده جهش ۹۰ درصدی است؟
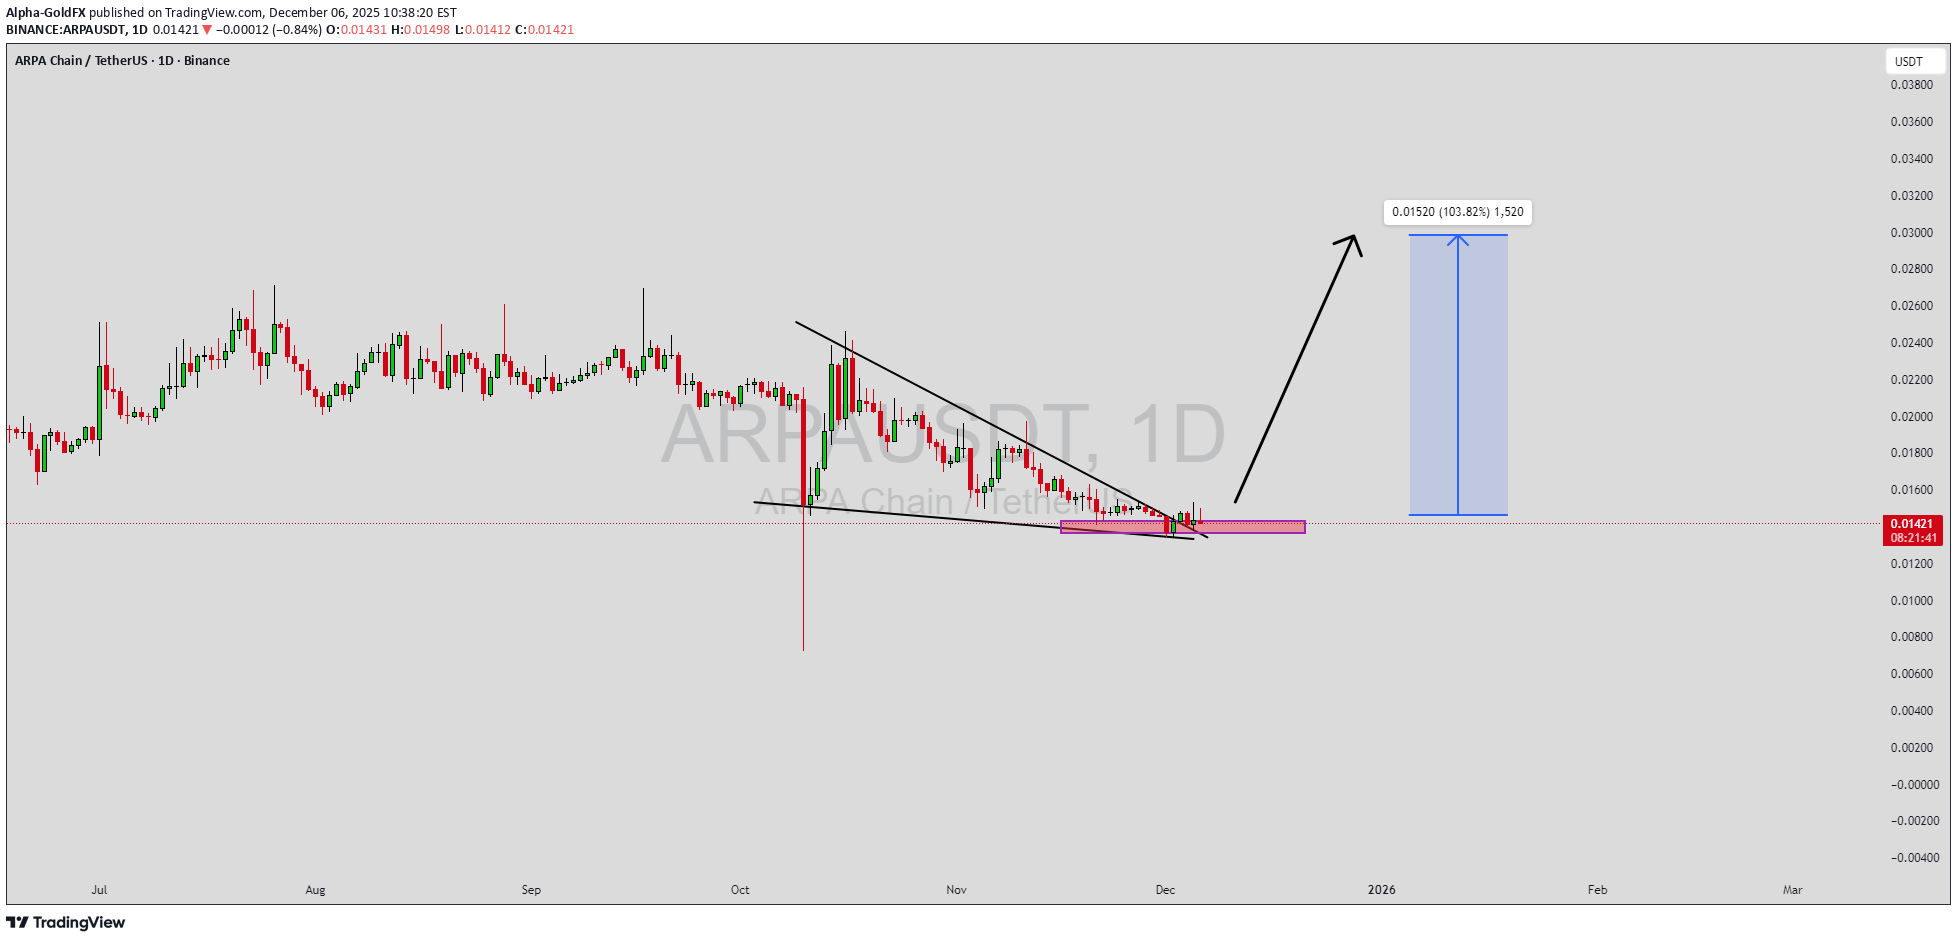
ARPAUSDT is forming a clear bullish wave pattern, a classic bullish reversal signal that often indicates an upcoming breakout. The price has been consolidating within a narrowing range, suggesting that selling pressure is weakening while buyers are beginning to regain control. With consistent volume confirming accumulation at lower levels, the setup hints at a potential bullish breakout soon. The projected move could lead to an impressive gain of around 90% to 100% once the price breaks above the wedge resistance. This falling wedge pattern is typically seen at the end of downtrends or corrective phases, and it represents a potential shift in market sentiment from bearish to bullish. Traders closely watching ARPAUSDT are noting the strengthening momentum as it nears a breakout zone. The good trading volume adds confidence to this pattern, showing that market participants are positioning early in anticipation of a reversal. Investors’ growing interest in ARPAUSDT reflects rising confidence in the project’s long-term fundamentals and current technical strength. If the breakout confirms with sustained volume, this could mark the start of a fresh bullish leg. Traders might find this a valuable setup for medium-term gains, especially as the wedge pattern completes and buying momentum accelerates. ✅ Show your support by hitting the like button and ✅ Leaving a comment below! (What is your opinion about this Coin?) Your feedback and engagement keep me inspired to share more insightful market analysis with you!

Halilakgul
تحلیل تکنیکال ARPA: پیشبینی صعود قدرتمند و نقاط ورود/خروج دقیق
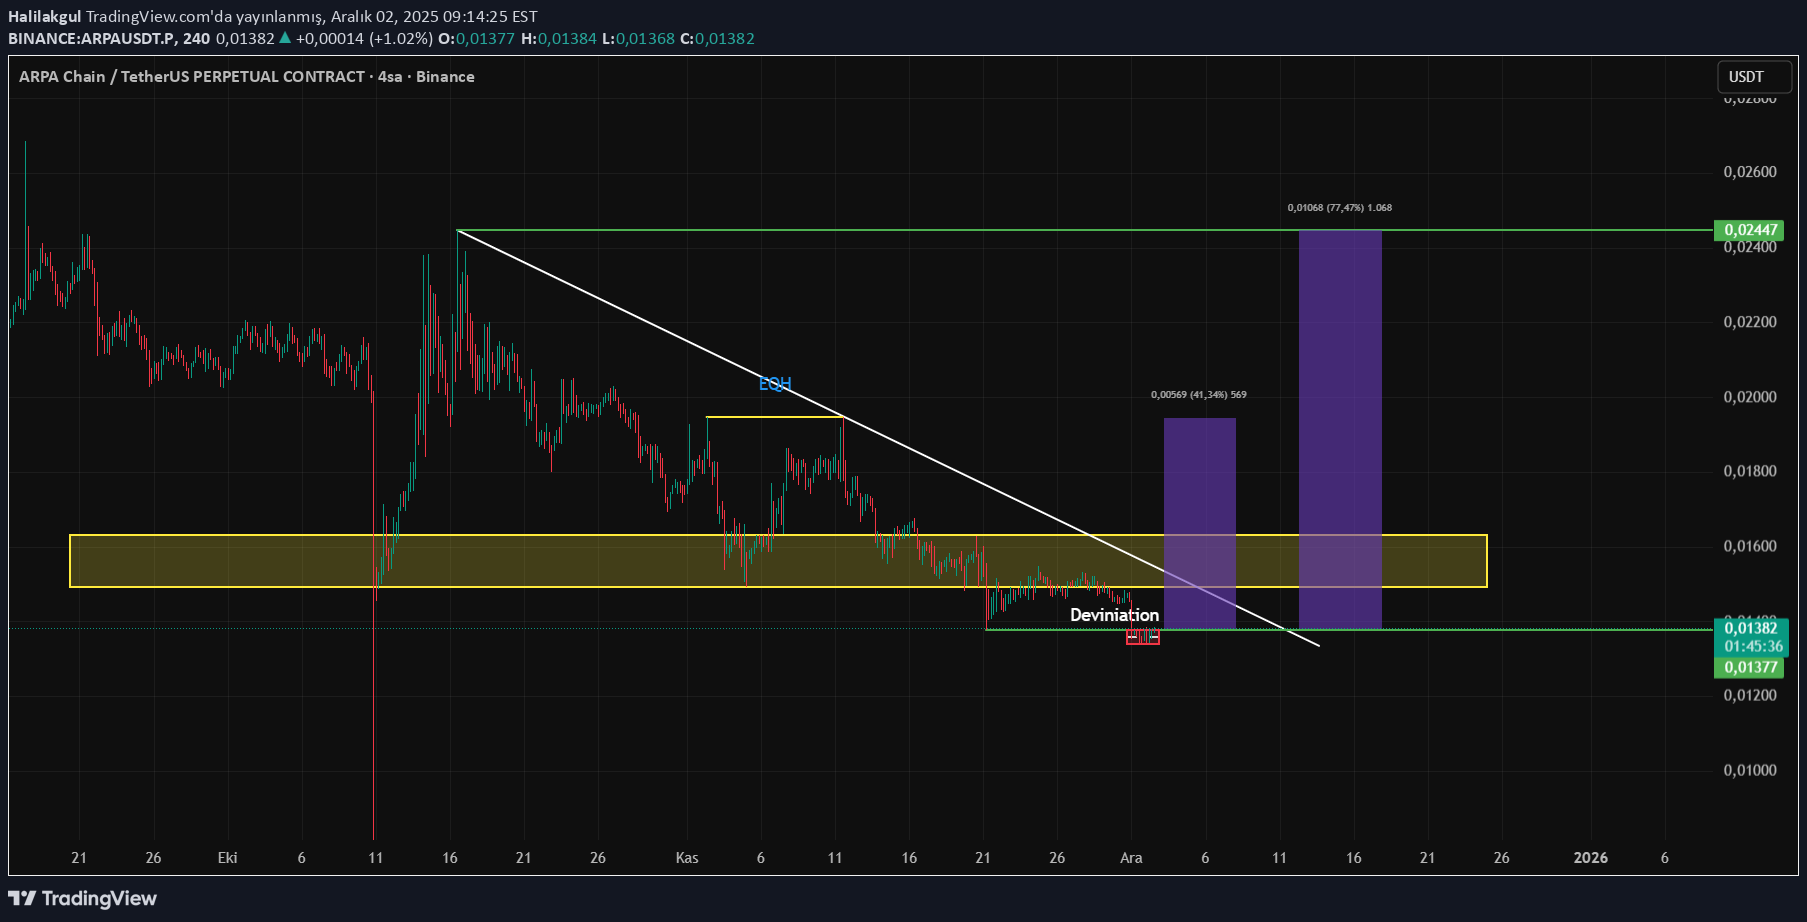
The area I have indicated with the red box will remain as deviation, I expect the yellow box to gain in a short time, I follow it with a stop below the last bottom. The reason why I take action in advance is because of its characteristic, it goes without giving me a chance. I have determined 2 TP regions, I will sell 25% in the first region, 50% in the second region and seek excitement with the remaining balance. Good luck, you can like and comment for more ideas.

TradingOn
#ARPAUSDT #1D (ByBit) Chuvashov's fork breakout
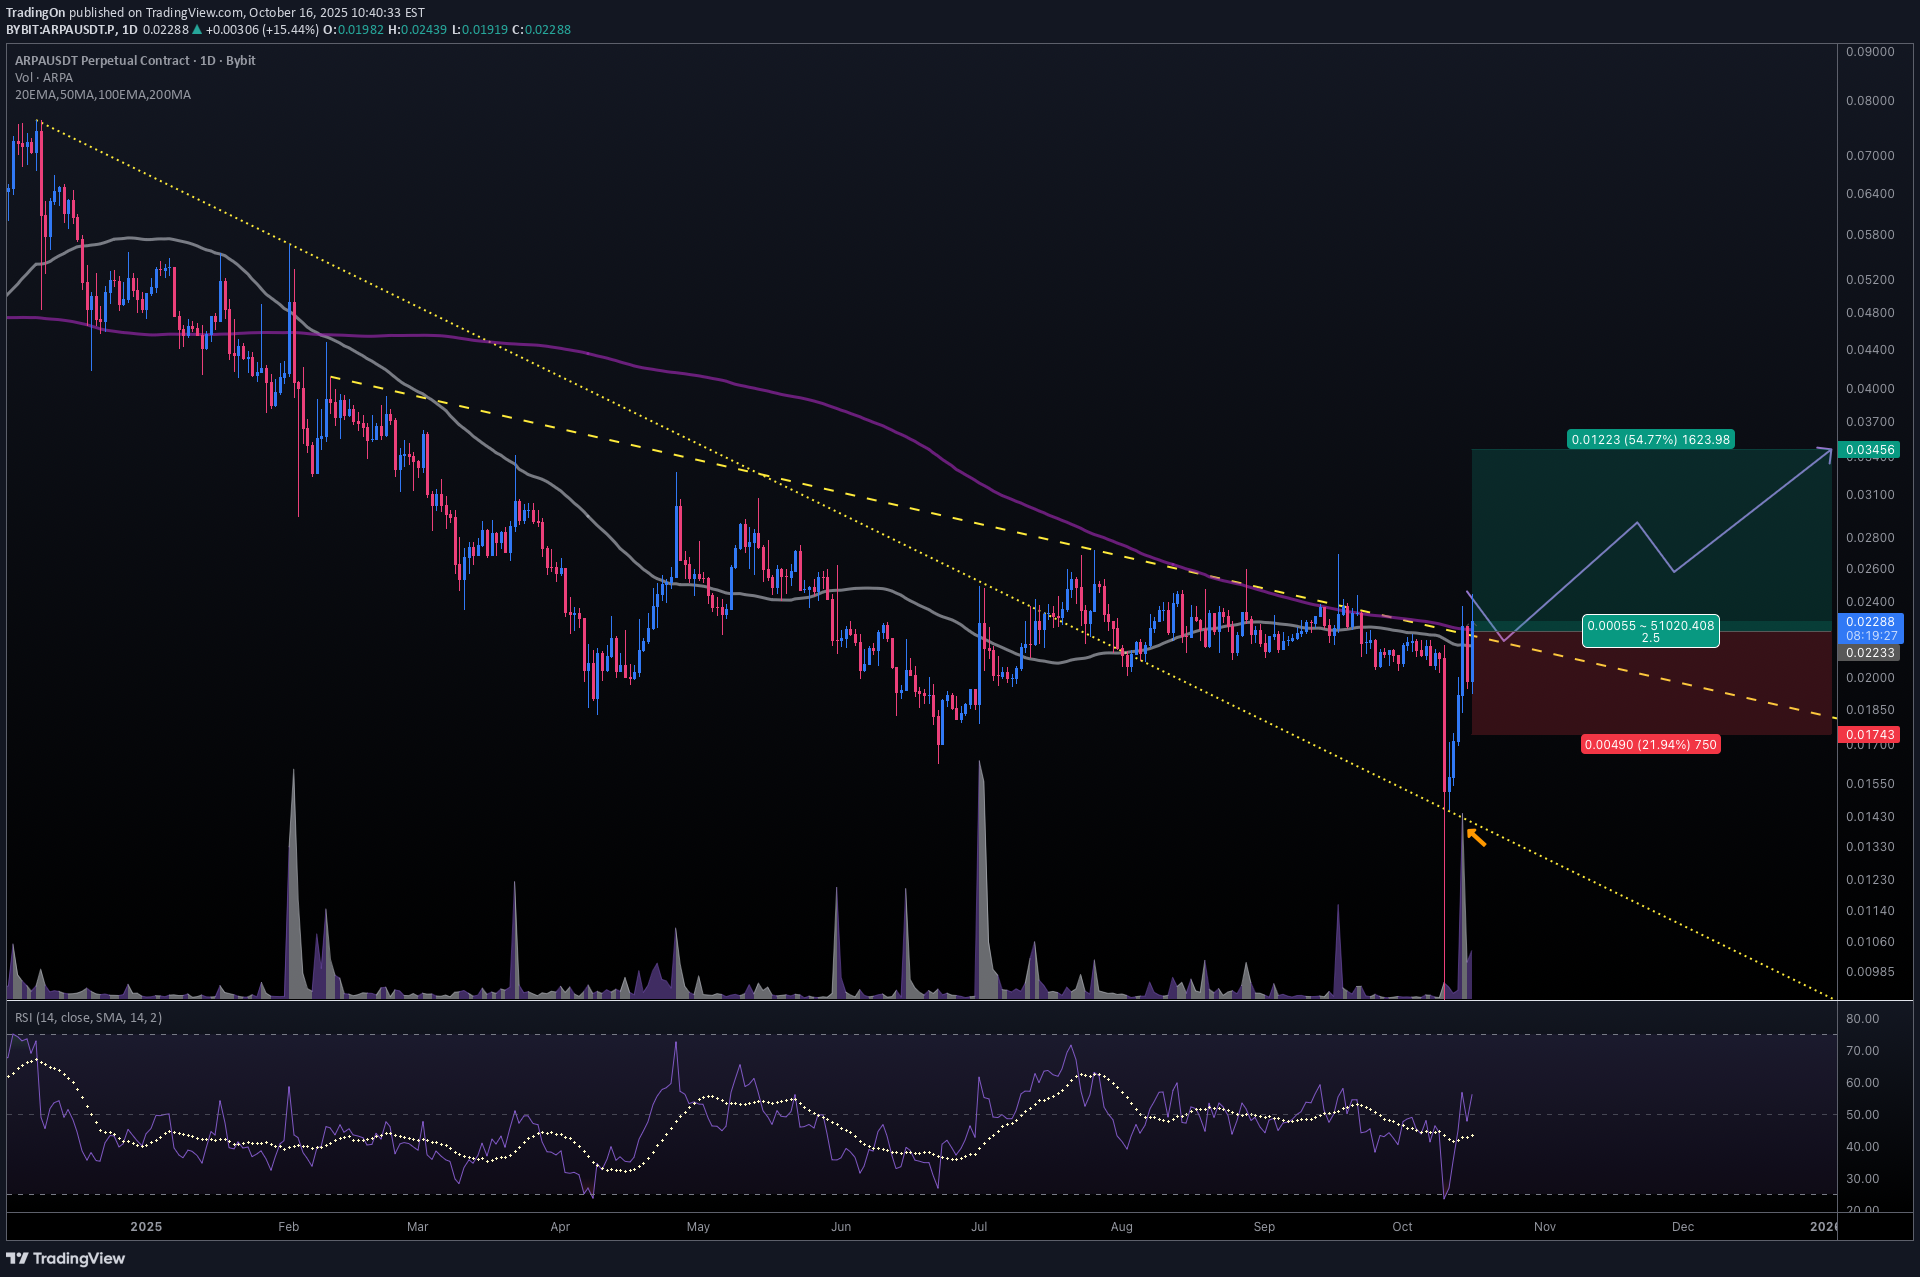
ARPA did a V-shaped recovery with great increase in volume and about to regain 200MA support. Golden cross seems around the corner, looks very likely to rally mid-term. ⚡️⚡️ #ARPA/USDT ⚡️⚡️ Exchanges: ByBit USDT Signal Type: Regular (Long) Leverage: Isolated (2.0X) Amount: 4.6% Entry Targets: 1) 0.02233 Take-Profit Targets: 1) 0.03456 Stop Targets: 1) 0.01743 Published By: @Zblaba $ARPA ARPAUSDT.P #1D #DeFi arpanetwork.io Risk/Reward= 1:2.5 Expected Profit= +109.5% Possible Loss= -43.9% Estimated Gaintime= 1-2 monthsEntry filled ARPAUSDT.P All entry targets achieved Average Entry Price: 0.02233 💵 $ARPA lost back support and dipped but managed to bounce back before stop, so far. Right now it's forming a morning star pattern so there is still hope for a recovery.SL hit with -1.0R ARPAUSDT.P Stop Target Hit ⛔ Loss: 43.8871% 📉 $ARPA failed to recover and retraced down further, stopping us out.

Bithereum_io
آرپا (ARPA) در آستانه انفجار قیمتی؟ مقاومت شکسته میشود و اهداف بزرگ پیش رو!

#ARPA is attempting to break above the descending resistance and the daily SMA200. Keep an eye on it — in case of a successful breakout, the potential targets are: 🎯 $0.02468 🎯 $0.02827 🎯 $0.03230 🎯 $0.03632 🎯 $0.04205 🎯 $0.04935 ⚠️ Always remember to use a tight stop-loss and maintain proper risk management.

CryptoWithJames
تحلیل تکنیکال ARPA: پتانسیل رشد ۷۵ درصدی با شکست الگوی گُوِه نزولی!

#ARPA UPDATE ARPA Technical Setup Pattern: Bullish falling wedge pattern Current Price: $0.0221 Target Price: $0.039 Target % Gain: 75.65% $ARPA is breaking out of a falling wedge pattern on the 1D timeframe. Current price is $0.0221 with a target near $0.039, indicating a potential 75% upside move. The breakout highlights strong bullish momentum with room for continuation if volume sustains. Time Frame: 1D Risk Management Tip: Always use proper risk management.
Alpha-GoldFX
آرپا (ARPA) در آستانه انفجار قیمتی: راز الگوی گوه نزولی و احتمال رشد ۱۰۰ درصدی!

ARPAUSDT is currently trading within a falling wedge pattern, a bullish reversal signal that often indicates a strong upcoming breakout. The pair has been consolidating within a narrowing range, showing that sellers are losing momentum while buyers are gradually stepping in. The consistent good trading volume supports this technical setup, suggesting growing accumulation at lower levels. Once the resistance line is broken, ARPAUSDT could witness a significant surge, with the potential for 90% to 100%+ gains as bullish momentum strengthens. This setup is attracting increasing attention from traders and investors who are anticipating a breakout rally. The falling wedge formation typically precedes a sharp price move, especially when confirmed by volume expansion and improving market sentiment. The current positioning of ARPAUSDT hints that it may be nearing the final stages of compression, making it a potential candidate for a strong upside move in the near term. With investors showing renewed interest in the ARPA project and the crypto market displaying improved liquidity, this technical structure aligns perfectly with bullish continuation expectations. A breakout from the wedge could open the doors for a sustained rally as confidence returns to this pair. Traders are keeping a close watch for a decisive move above key resistance levels that could confirm this reversal pattern and trigger a strong upward trend. ✅ Show your support by hitting the like button and ✅ Leaving a comment below! (What is You opinion about this Coin) Your feedback and engagement keep me inspired to share more insightful market analysis with you!

Worldofchartsfx
Arpa looks ready for 0.03$
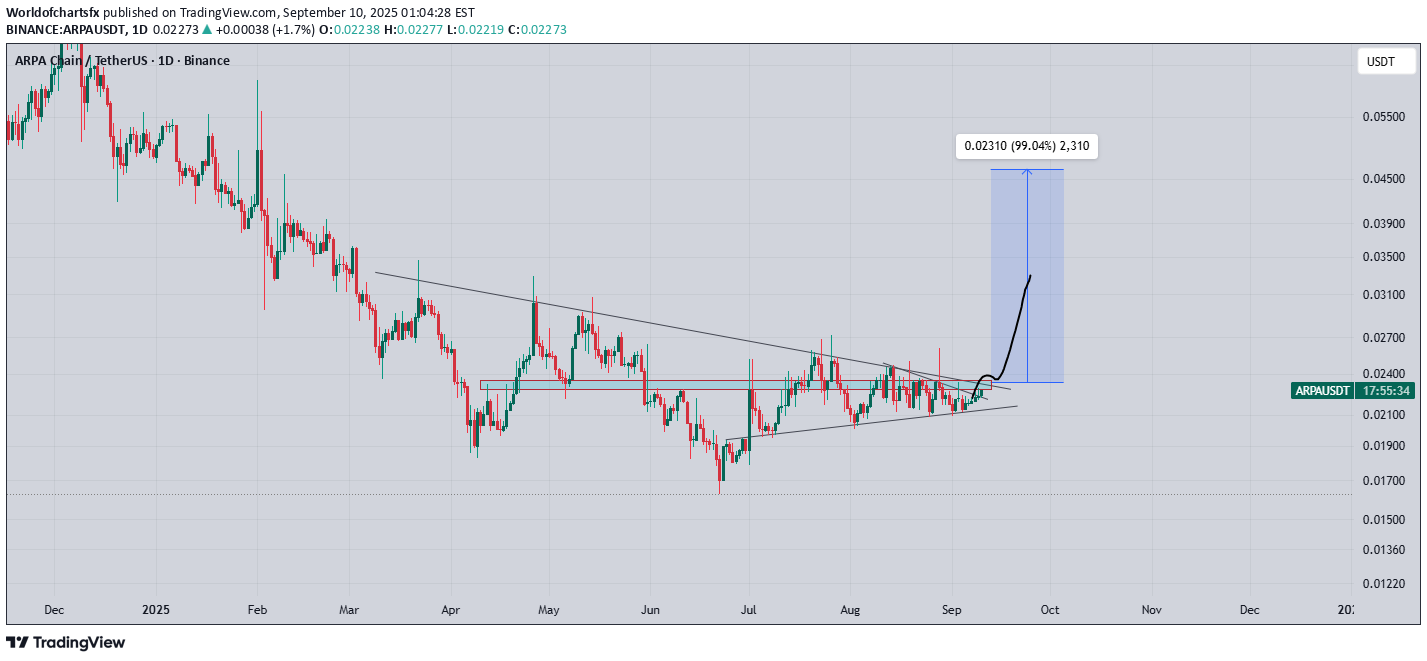
arpa Formed Bullish Pattern, Consolidating Under Descending Trendline, Can Bounce Sharply From Here, Successful Breakout Could Send It Towards 0.033

SatochiTrader
ARPA IS READY FOR NEW MOON FLY
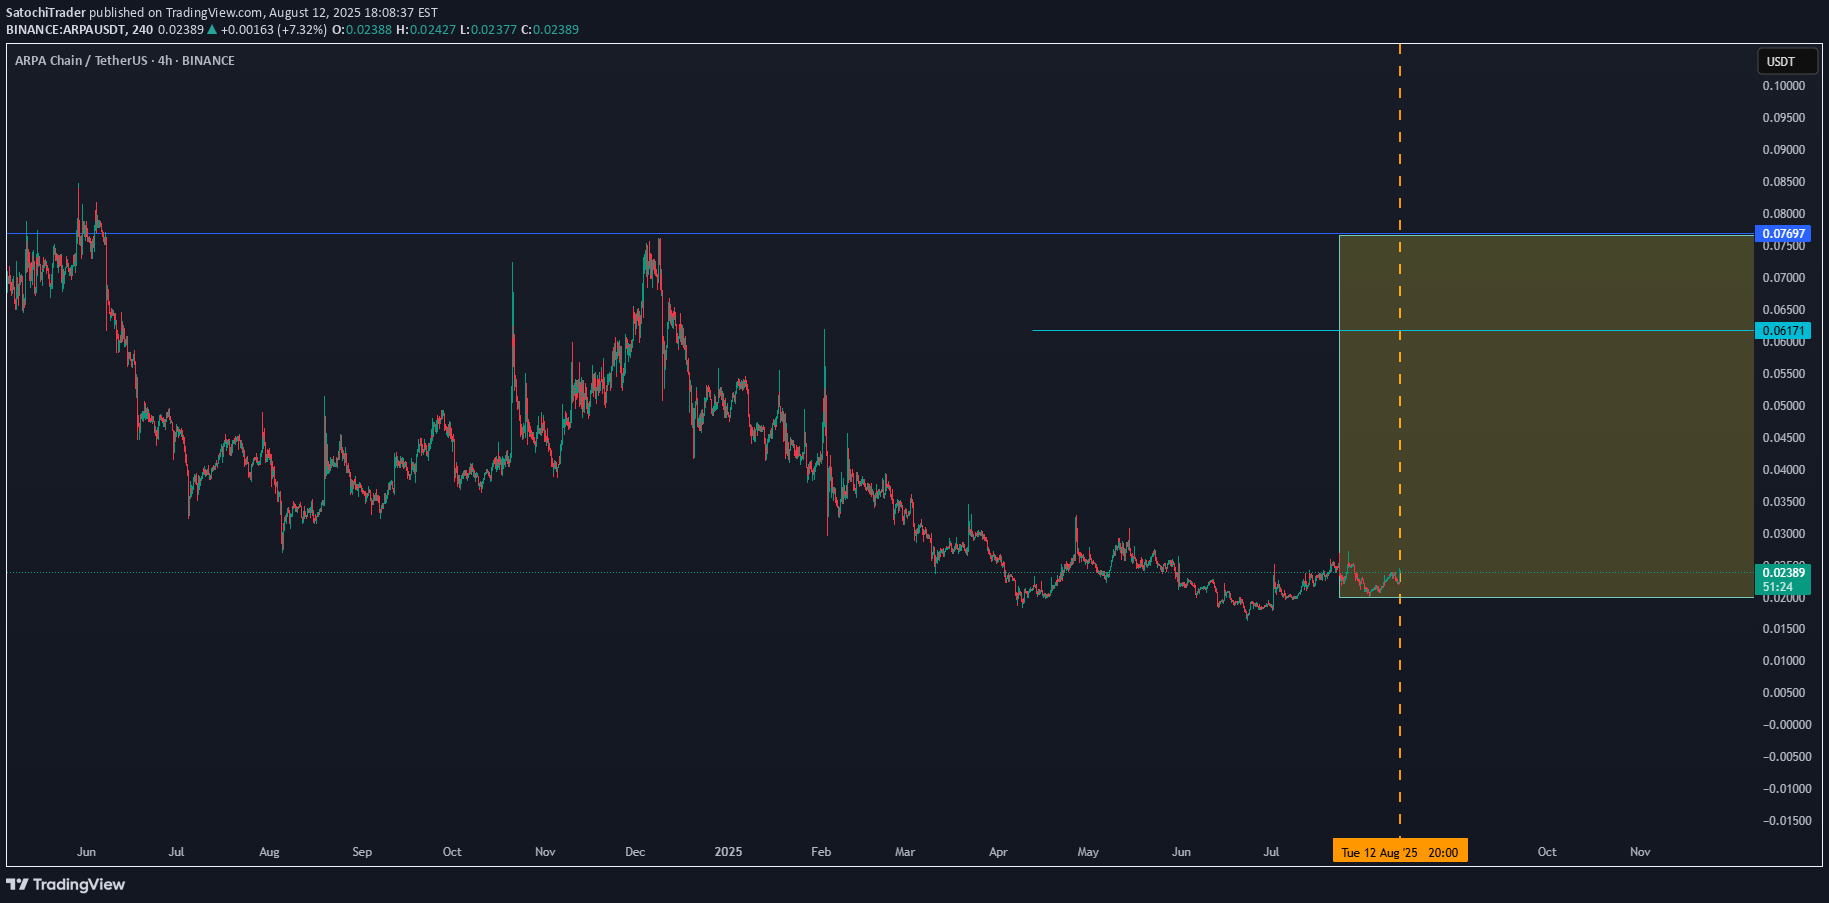
Arpa seems to give us an important signal of volume, which can lead in the next 50% increase and more, will follow this coin for further building steps.First confirmation done.High data that there is a start of a new cycleSame Time frame same zone same price actionSame Time frame same zone same price action Result 900% in 3 months.

Strength_in_numbers
ARPA - long position
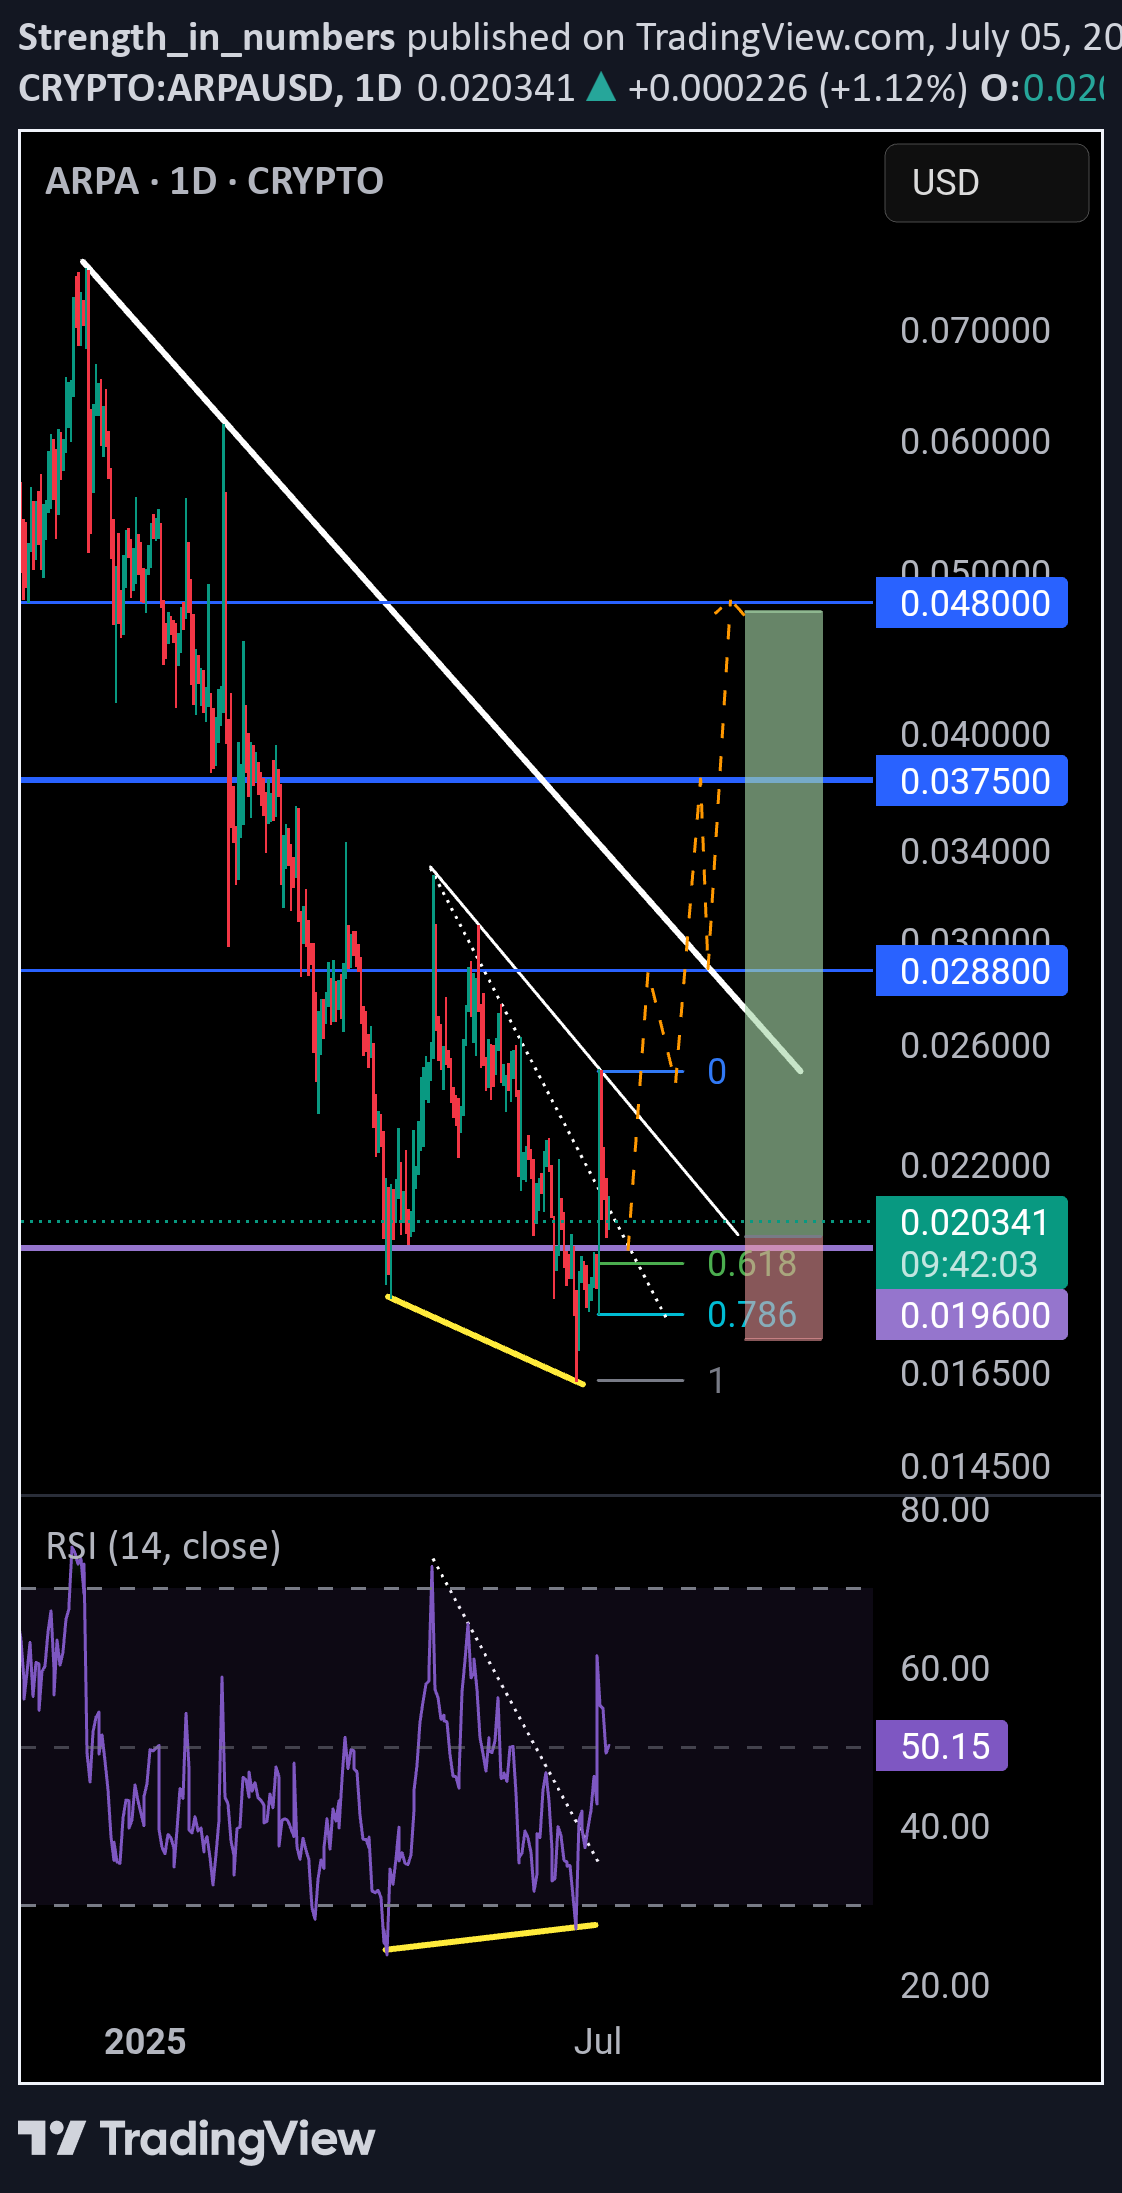
1D timeframeBullish divergenceEntry around the 618 fibTargets rely on a breakout of 2 x downtrendsEntry: 0.0196TP1: 0.0288 (+47%)TP2: 0.0375 (+91%)TP3: 0.0480 (+138%)SL: 0.0173 (-13%)R:R - 10:1
Alpha-GoldFX
ARPAUSDT Forming Falling Wedge
ARPAUSDT is drawing fresh attention from crypto traders as it forms a classic falling wedge pattern on the daily timeframe. This technical pattern is widely recognized as a strong bullish reversal signal when backed by healthy volume and growing investor interest. The falling wedge indicates that the downtrend is losing momentum, and a breakout to the upside could trigger a significant move. With current market dynamics, ARPAUSDT is showing promising signs that it could deliver an expected gain of 80% to 90% or more once this pattern resolves.Good volume levels in recent sessions confirm that accumulation is happening quietly, which is often the case before a breakout from a wedge pattern. Traders looking for high-probability setups should keep an eye on the breakout zone around the wedge’s upper trendline. A confirmed close above this resistance with increased volume could be the catalyst for a strong rally. ARPA’s fundamentals, coupled with positive sentiment from investors taking interest in the project, add extra fuel to the potential upside.As more altcoins regain momentum, ARPAUSDT stands out as one of the most interesting pairs to watch for short- to mid-term gains. Technical traders and pattern-based investors often target these setups to capture explosive price action. Staying patient for a clean breakout and using proper risk management will be crucial to maximize the reward potential in this setup.✅ Show your support by hitting the like button and✅ Leaving a comment below! (What is You opinion about this Coin)Your feedback and engagement keep me inspired to share more insightful market analysis with you!
Disclaimer
Any content and materials included in Sahmeto's website and official communication channels are a compilation of personal opinions and analyses and are not binding. They do not constitute any recommendation for buying, selling, entering or exiting the stock market and cryptocurrency market. Also, all news and analyses included in the website and channels are merely republished information from official and unofficial domestic and foreign sources, and it is obvious that users of the said content are responsible for following up and ensuring the authenticity and accuracy of the materials. Therefore, while disclaiming responsibility, it is declared that the responsibility for any decision-making, action, and potential profit and loss in the capital market and cryptocurrency market lies with the trader.