
ARKM
Arkham
| تریدر | نوع سیگنال | حد سود/ضرر | زمان انتشار | مشاهده پیام |
|---|---|---|---|---|
No results found. | ||||
Price Chart of Arkham
سود 3 Months :
سیگنالهای Arkham
Filter
Sort messages by
Trader Type
Time Frame

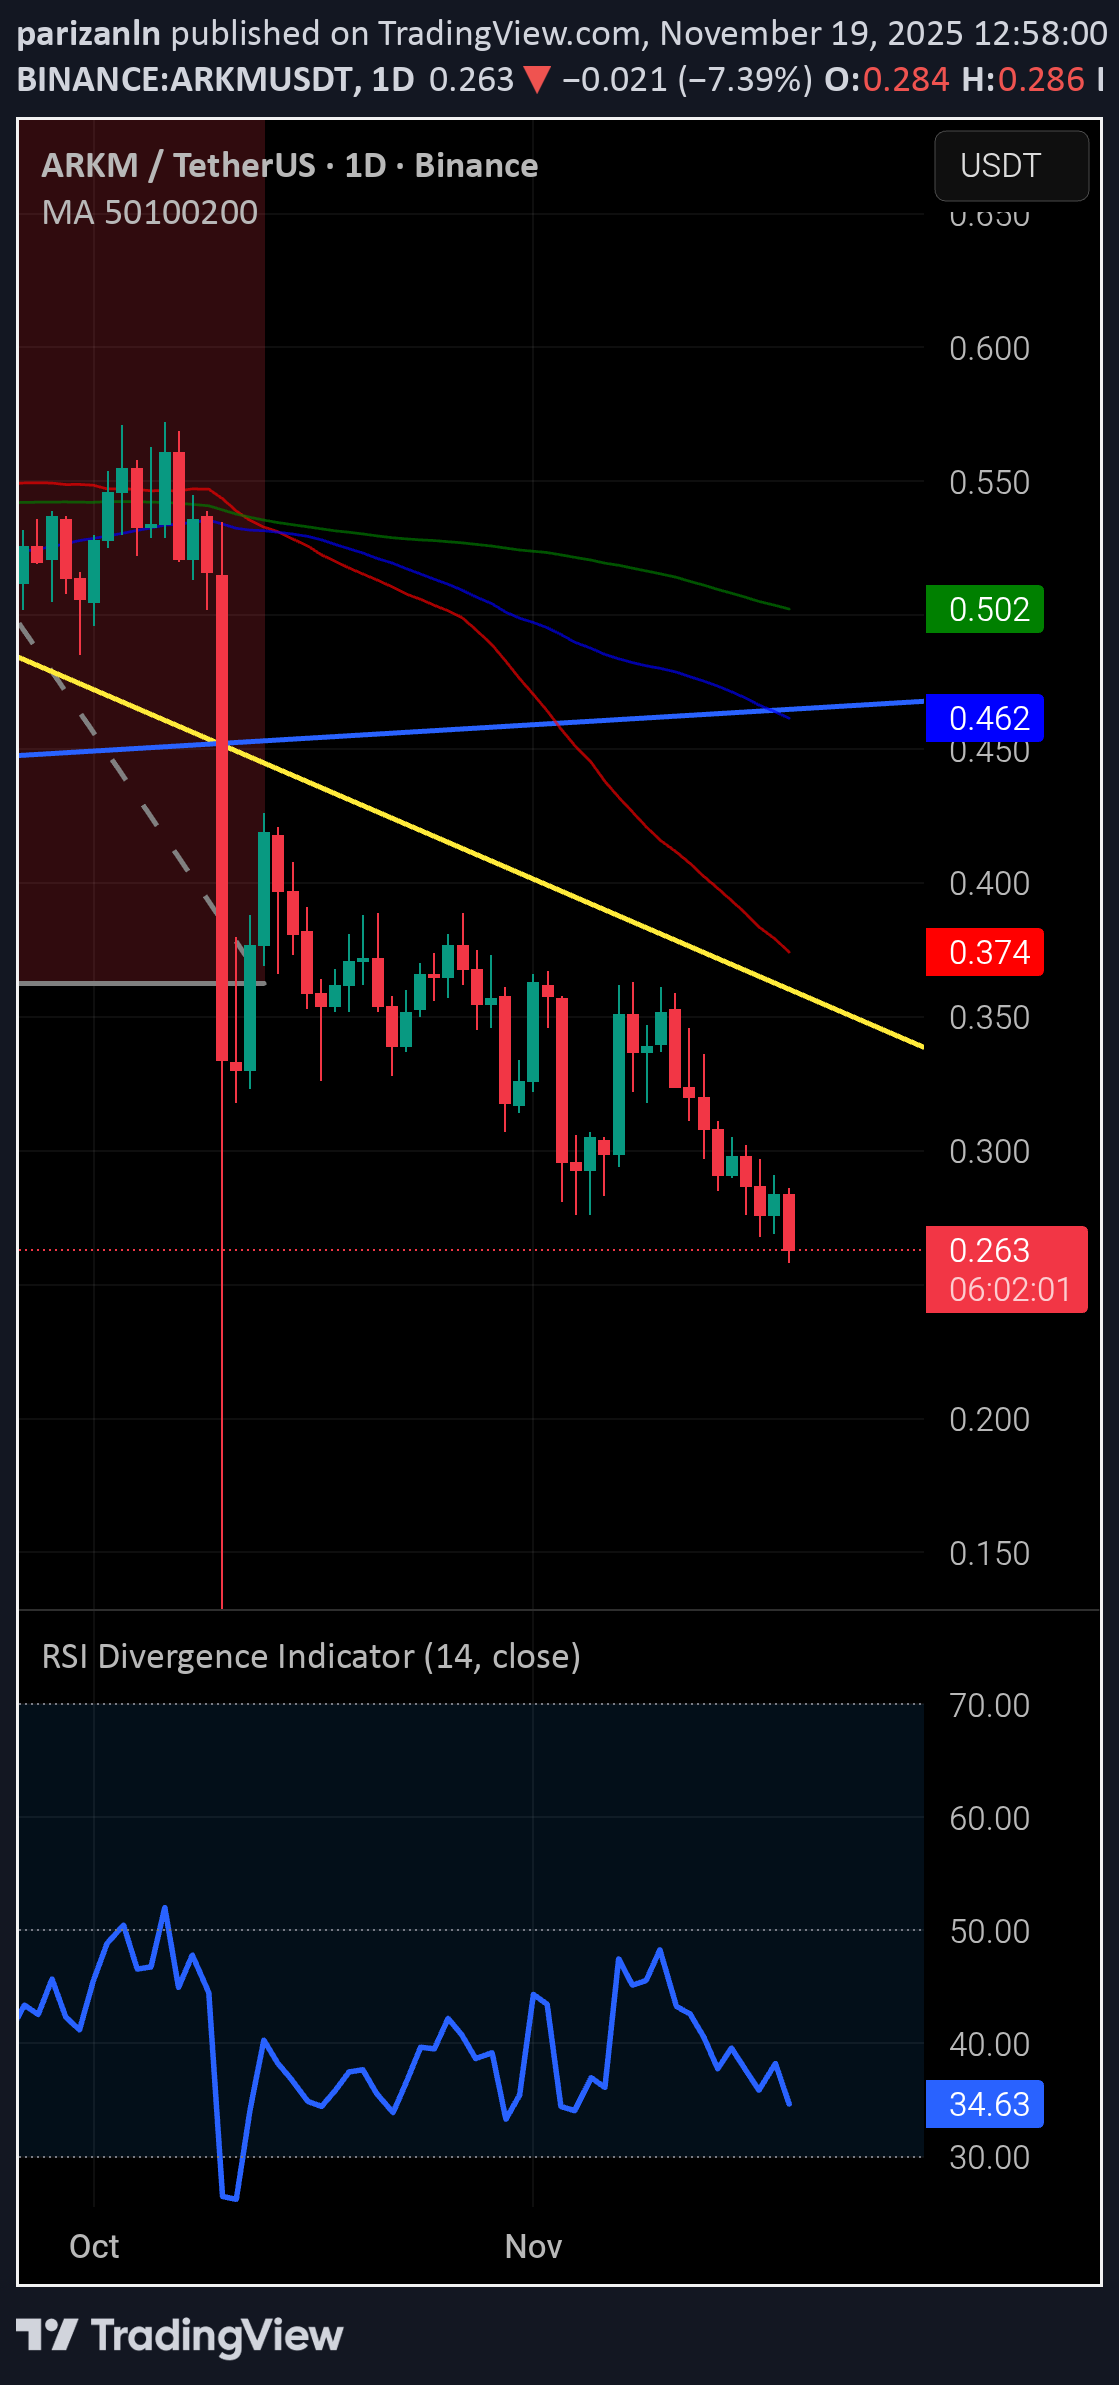
تحلیل ARKM: آیا سقوط قریبالوقوع است یا خیزش بزرگ در راه؟ (بررسی الگوی گُوِه نزولی)
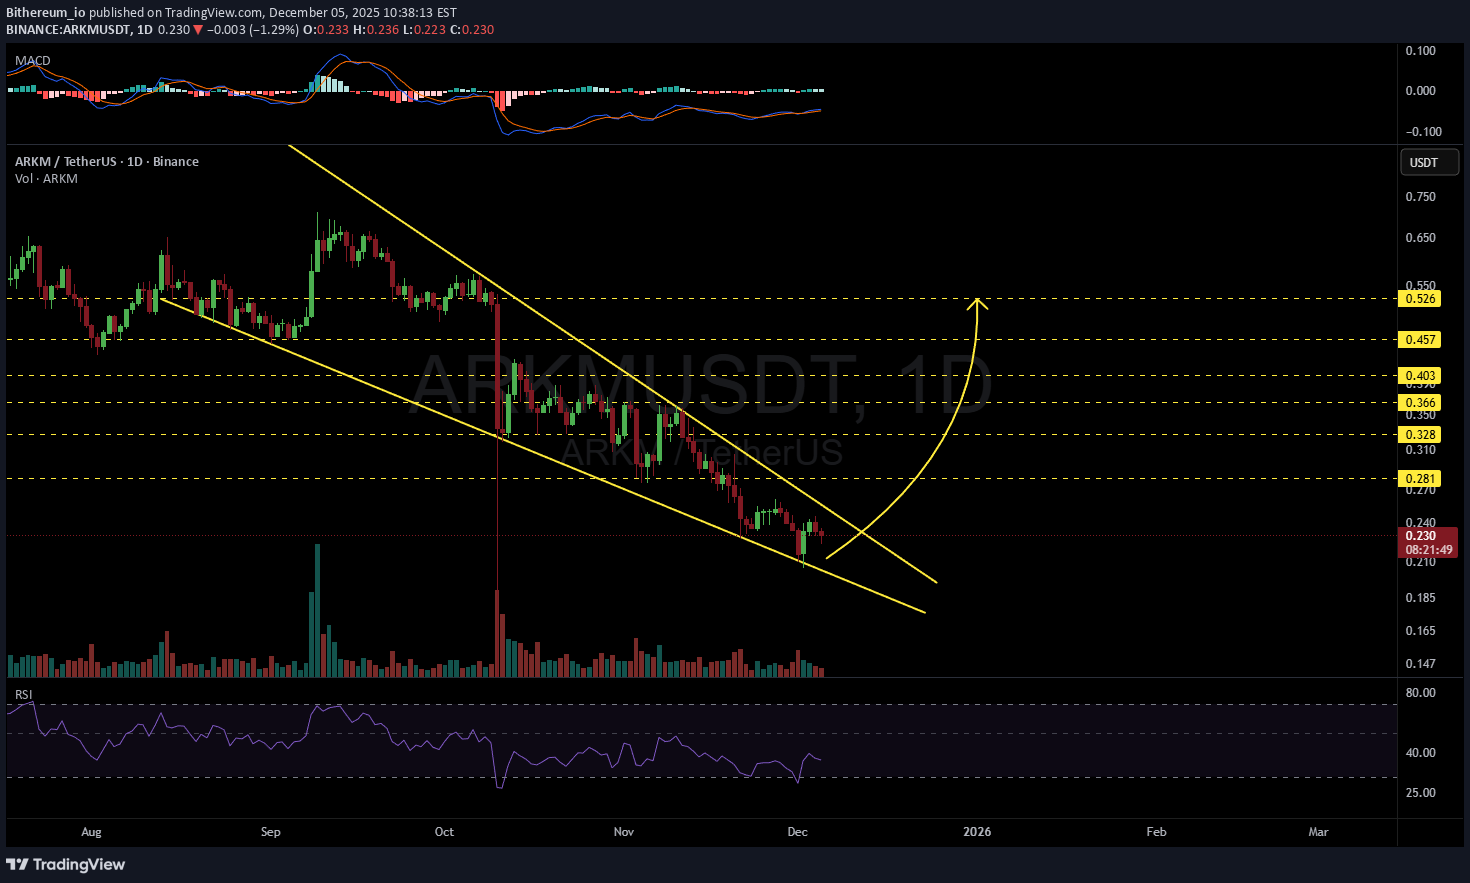
#ARKM is moving inside a falling wedge on the daily chart. It may retest the wedge support one more time before the next leg up. In case of a successful bounce from the support and a breakout above the wedge, the potential targets are: 🎯 $0.281 🎯 $0.328 🎯 $0.366 🎯 $0.403 🎯 $0.457 🎯 $0.526 ❌ Invalidation: a daily candle closing below the wedge. ⚠️ Always remember to use a tight stop-loss and maintain proper risk management.

آینده ARKM: آیا این ارز دیجیتال دو برابر خواهد شد؟ (تحلیل پتانسیل انفجاری)
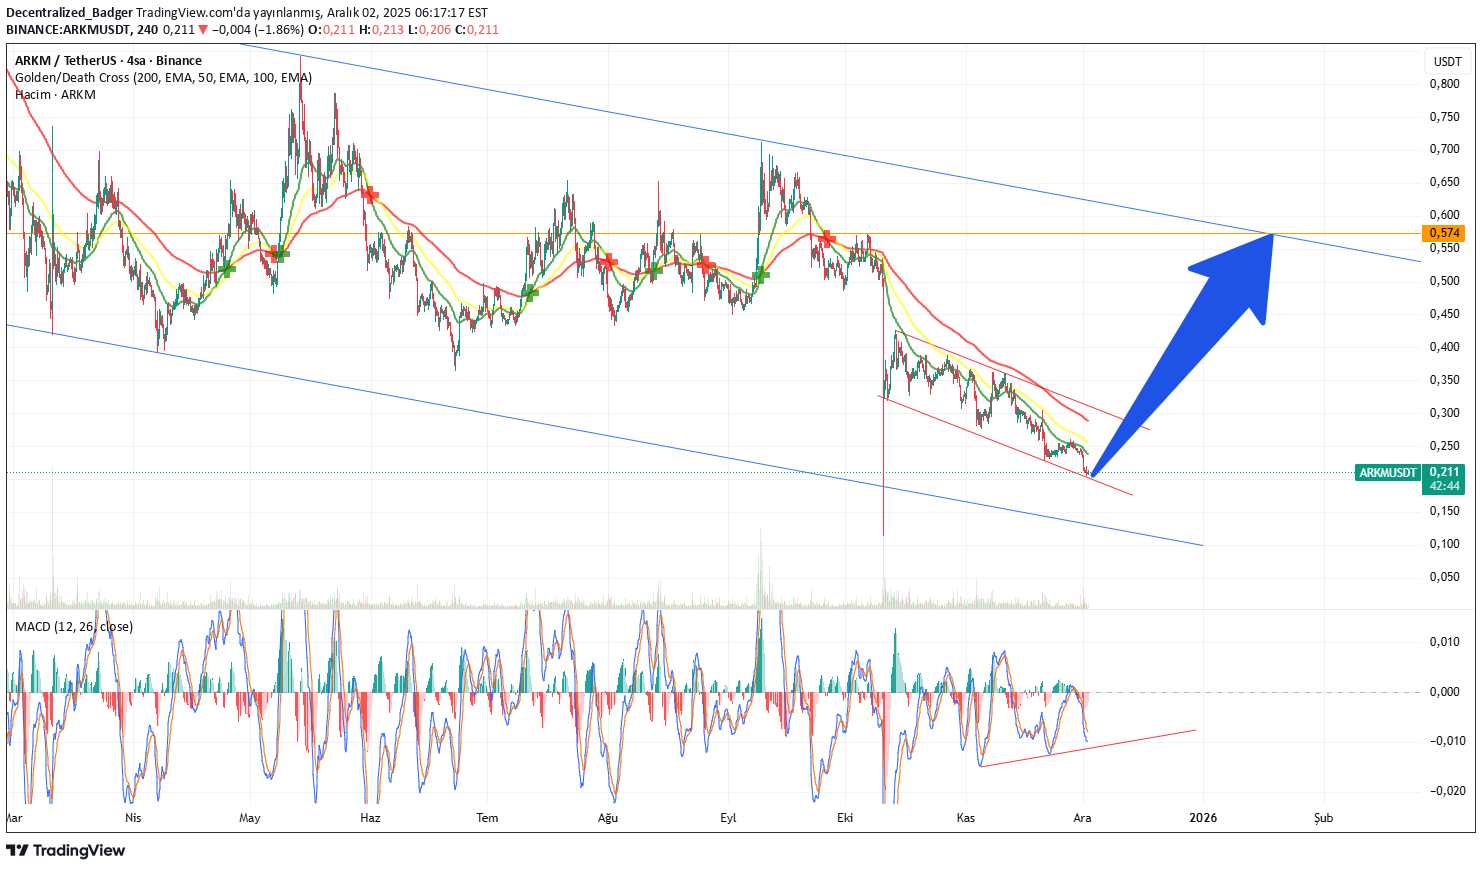
Elf If my eyes are not deceiving me, a positive discord has occurred and I see a 2X potential with the acceleration of the downward descent of BTC.D. So I hope so. I can almost hear you asking, what's the use of 2X in a market that's already finished? Let's take a 2X first and expect much more once the blue channel breaks up.
آینده ارز دیجیتال ARKM: آیا پتانسیل 2 برابر شدن وجود دارد؟
Elf If my eyes are not deceiving me, a positive discord has occurred and I see a 2X potential with the acceleration of the downward descent of BTC.D. So I hope so. I can almost hear you asking, what's the use of 2X in a market that's already finished? Let's take a 2X first and expect much more once the blue channel breaks up.
آرک اِم (ARKM) به کجا میرود؟ تحلیل تکنیکال هیجانانگیز با پتانسیل 2X!
Elf If my eyes are not deceiving me, a positive discord has occurred and I see a 2X potential with the acceleration of the downward descent of BTC.D. So I hope so. I can almost hear you asking, what's the use of 2X in a market that's already finished? Let's take a 2X first and expect much more once the blue channel breaks up.

منطقه تقاضای طلایی ARKM: فرصت خرید در تایم فریم 4 ساعته!
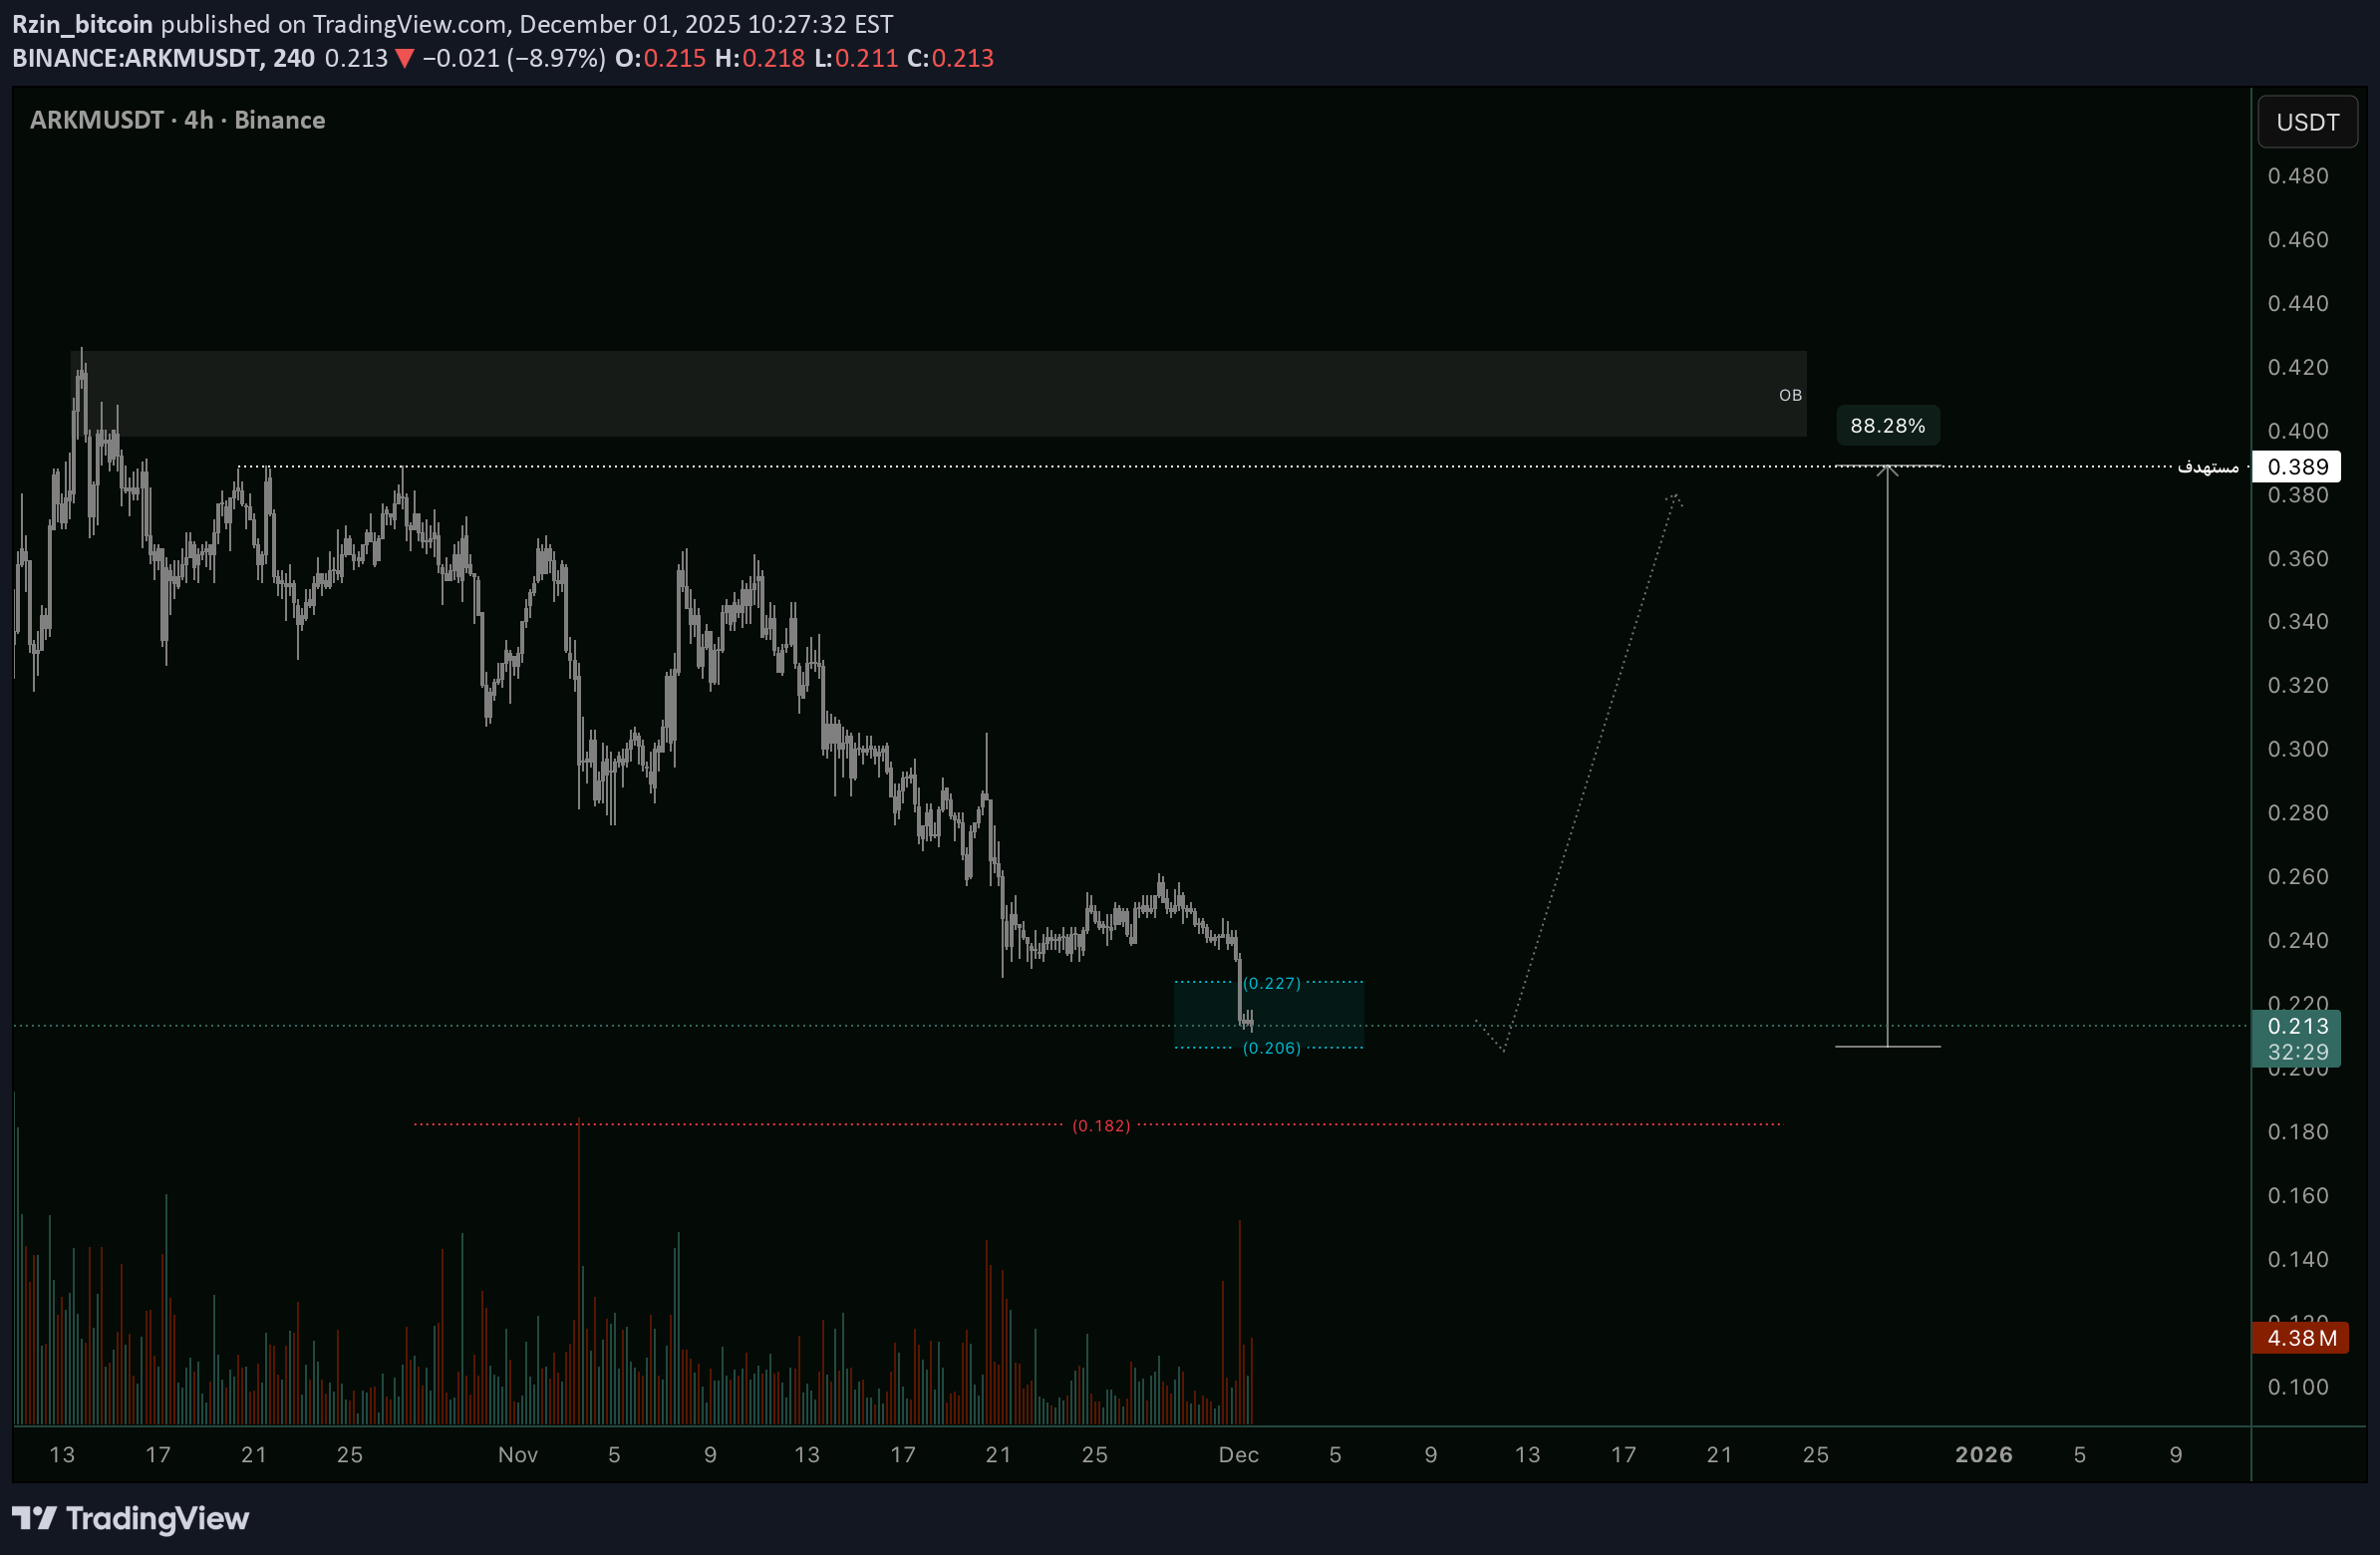
ARKM is currently trading in a strong demand zone between 0.22 and 0.20, with a possible dip toward 0.180. The main target remains at 0.38. These levels offer a solid opportunity for buyers who are monitoring the setup closely. ARKMUSDT

فوری: راز تلخ پشت سرمایهگذاری ARKM؛ آیا این پونزی در راه است؟
Every week new ATL Team-amateurs dont know how to manage such project Soon 0,10$

سرمایهگذاری زیرکانه در Arkham: سکوی اطلاعات بلاکچین با حامیان بزرگ!

Hi Arkham got known for its Intelligent Blockchain Readability but the best is yet to come. They created and exchange also. Some of the investors: Peter Thiel and Sam Altman. Low Cap, big opportinity. This is not a trading advice. Thanks Gex

تجميعة السرية: استراتيجية رابحة بـ 24% أرباح ووقف خسارة محدد!
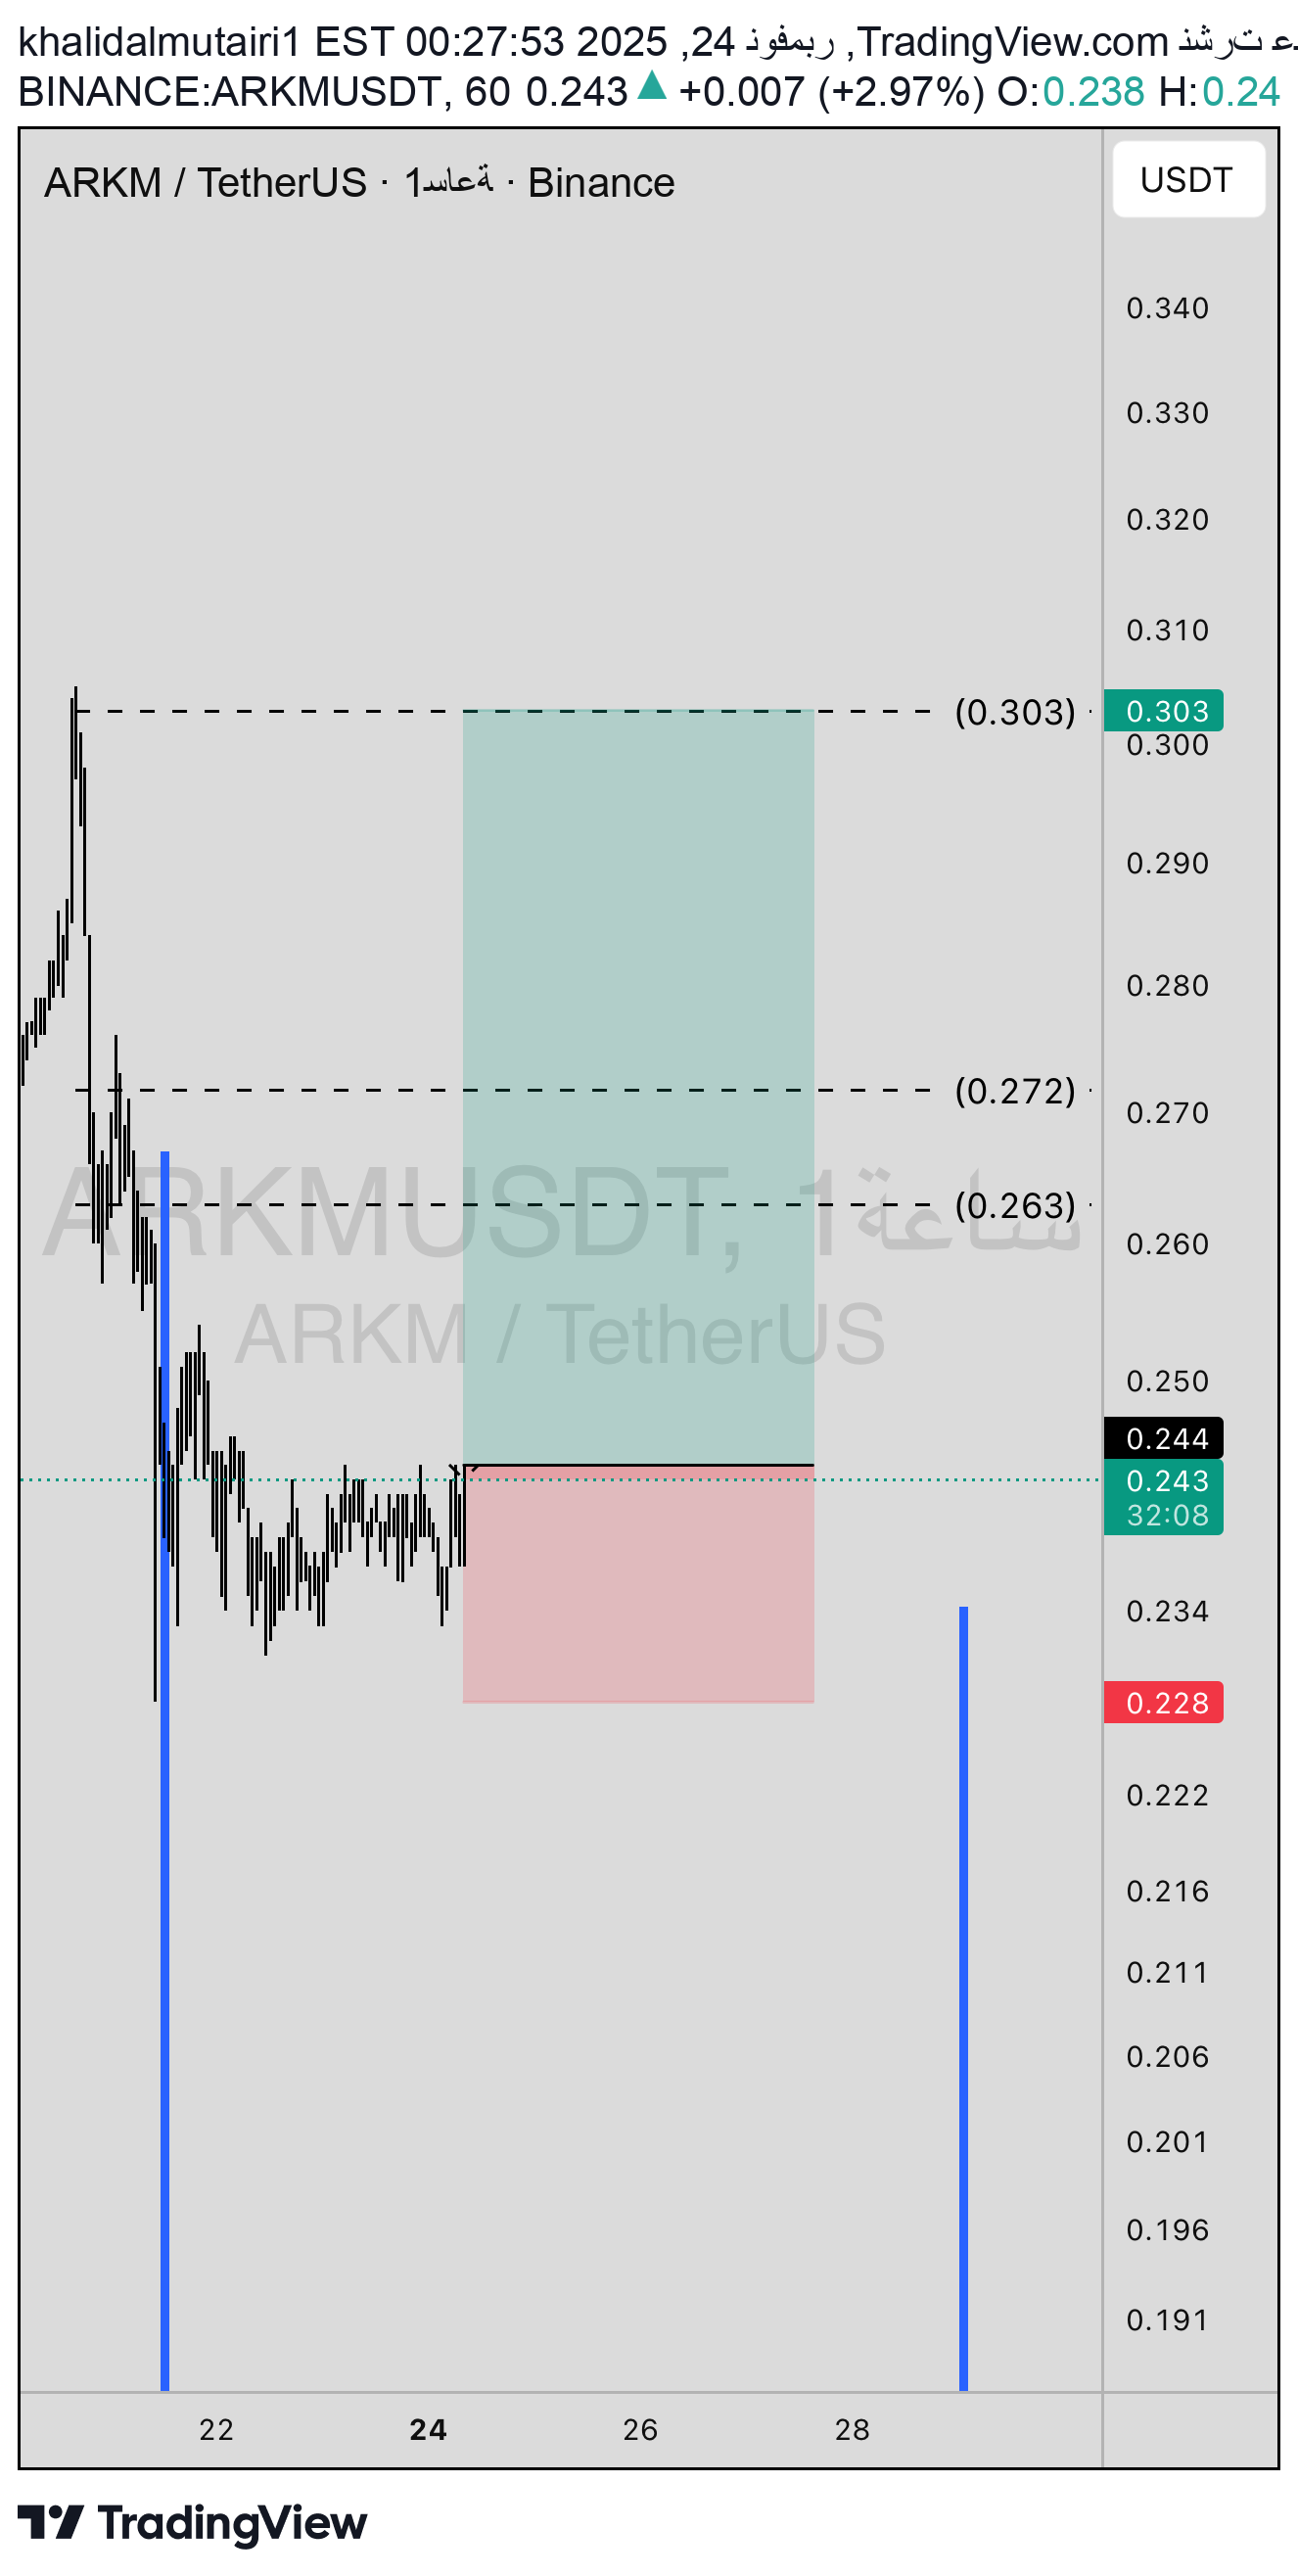
After the sharp decline on the hourly frame, we have a consolidation area. We have targets of up to 24% and a stop of 6.55%. The important thing is to commit to the endowment and goals. You are responsible for making profits and endowment
کلاهبرداری قطعی: پروژه مرده، صفر توسعه و سرمایهگذار!
Project dead 0 development 0 investors 0 marketing 0 volumes on exchange 0 info about drop Season 2 0 collabs No staking No buybacks Tram dont know how to manage project ,only selling from team wallets NOTHING

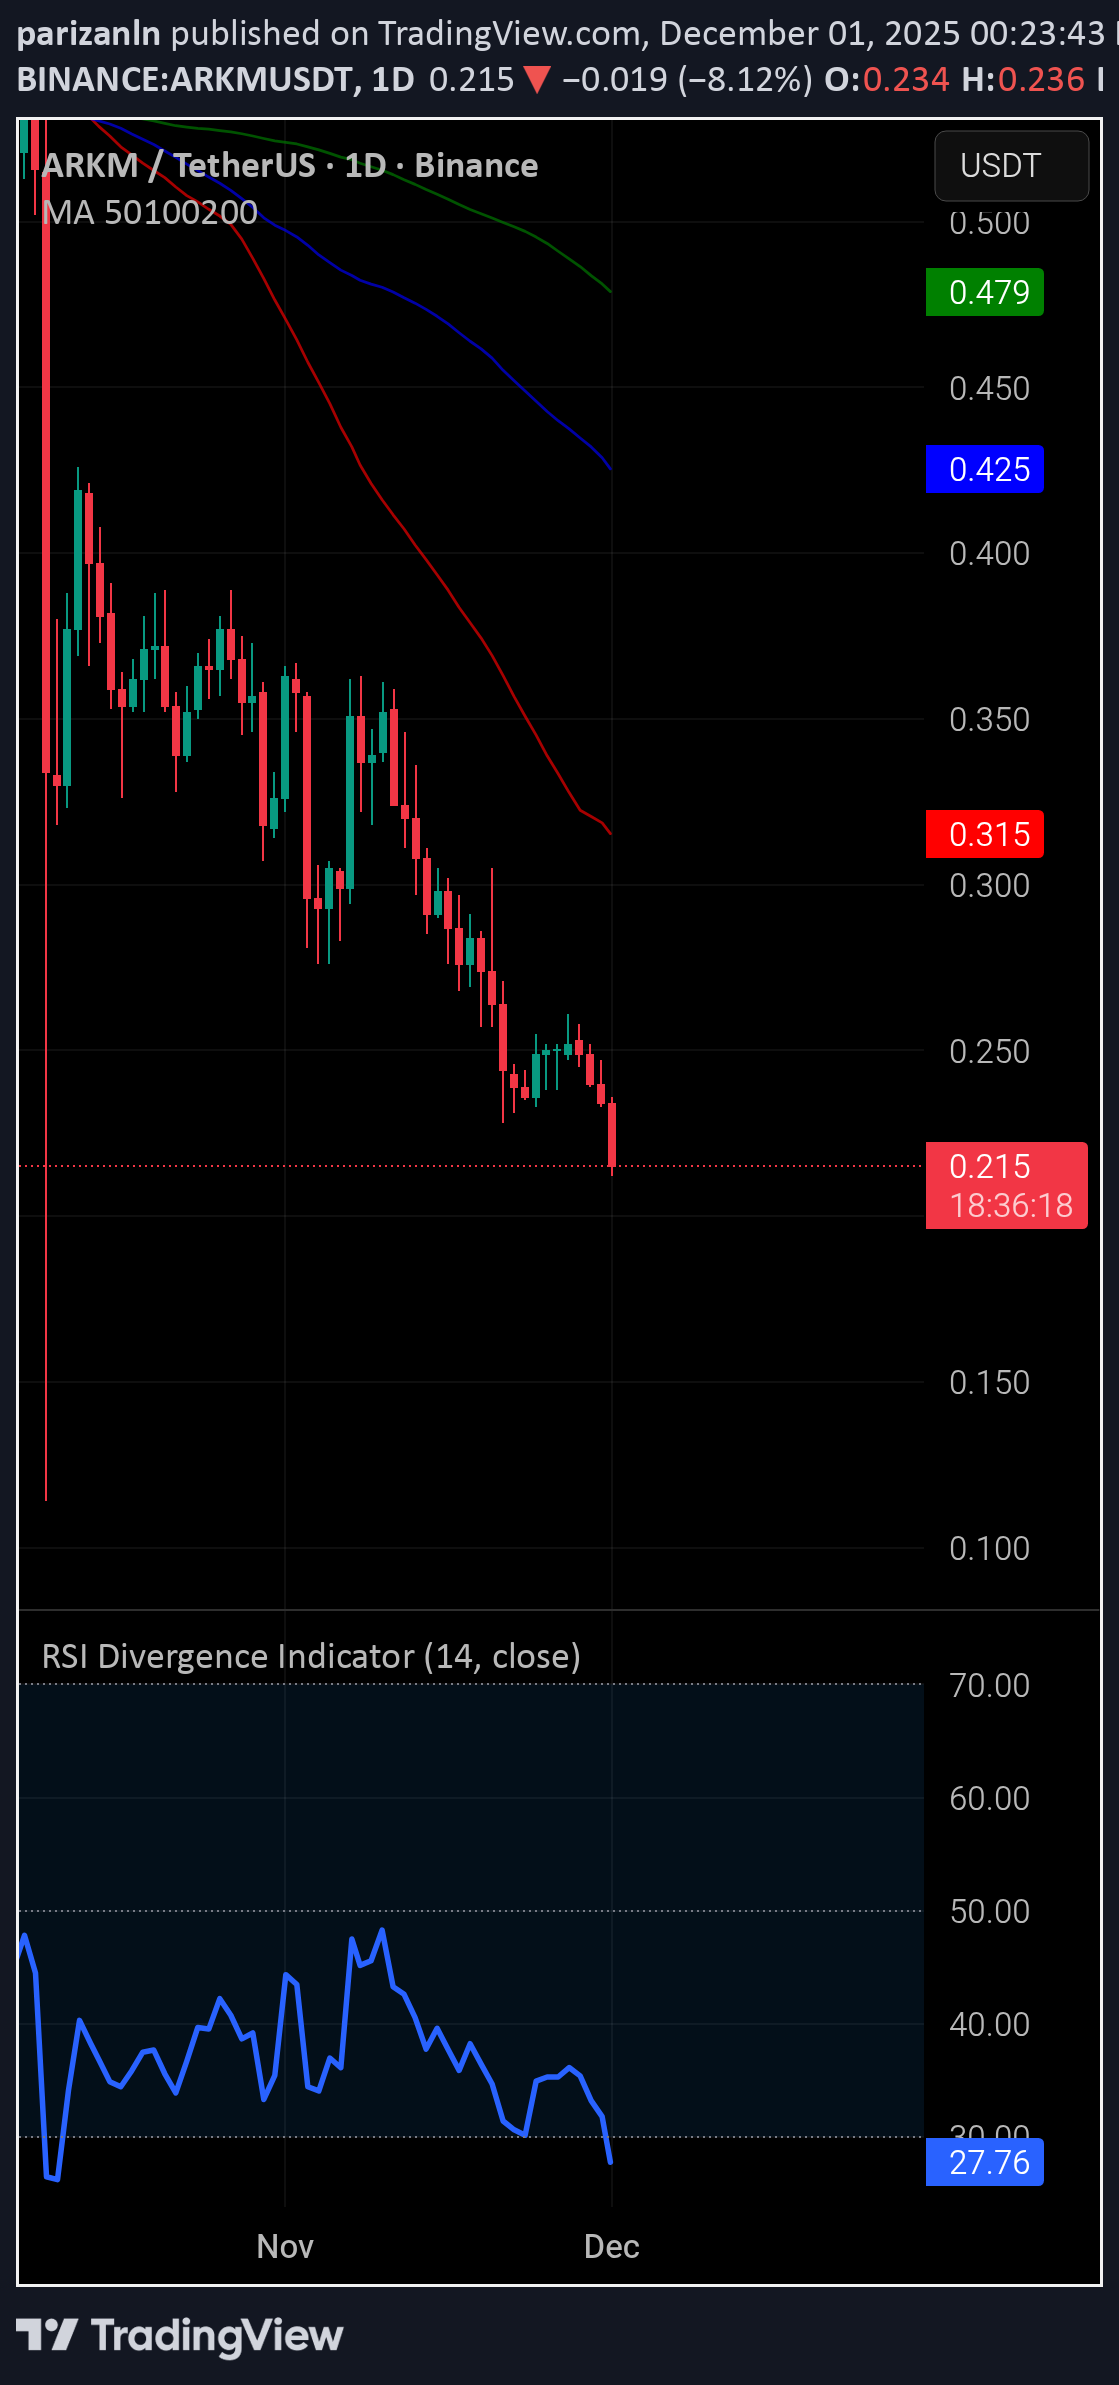
ARKM: فرصت نهایی برای صعود! آیا حمایت شکسته میشود؟

It did not break the support at 0.357 level and rose back inside. If the rise is to come, now is the time. Almost everyone has gone liq, all of them who opened long from the bottom have been reset. The BTC ARKM chart also looks good, it can go on the falling trend from here and break it, there is not much time left.
Disclaimer
Any content and materials included in Sahmeto's website and official communication channels are a compilation of personal opinions and analyses and are not binding. They do not constitute any recommendation for buying, selling, entering or exiting the stock market and cryptocurrency market. Also, all news and analyses included in the website and channels are merely republished information from official and unofficial domestic and foreign sources, and it is obvious that users of the said content are responsible for following up and ensuring the authenticity and accuracy of the materials. Therefore, while disclaiming responsibility, it is declared that the responsibility for any decision-making, action, and potential profit and loss in the capital market and cryptocurrency market lies with the trader.