
ALICE
MyNeighborAlice
| تریدر | نوع سیگنال | حد سود/ضرر | زمان انتشار | مشاهده پیام |
|---|---|---|---|---|
No results found. | ||||
Price Chart of MyNeighborAlice
سود 3 Months :
سیگنالهای MyNeighborAlice
Filter
Sort messages by
Trader Type
Time Frame

ALICE USDT
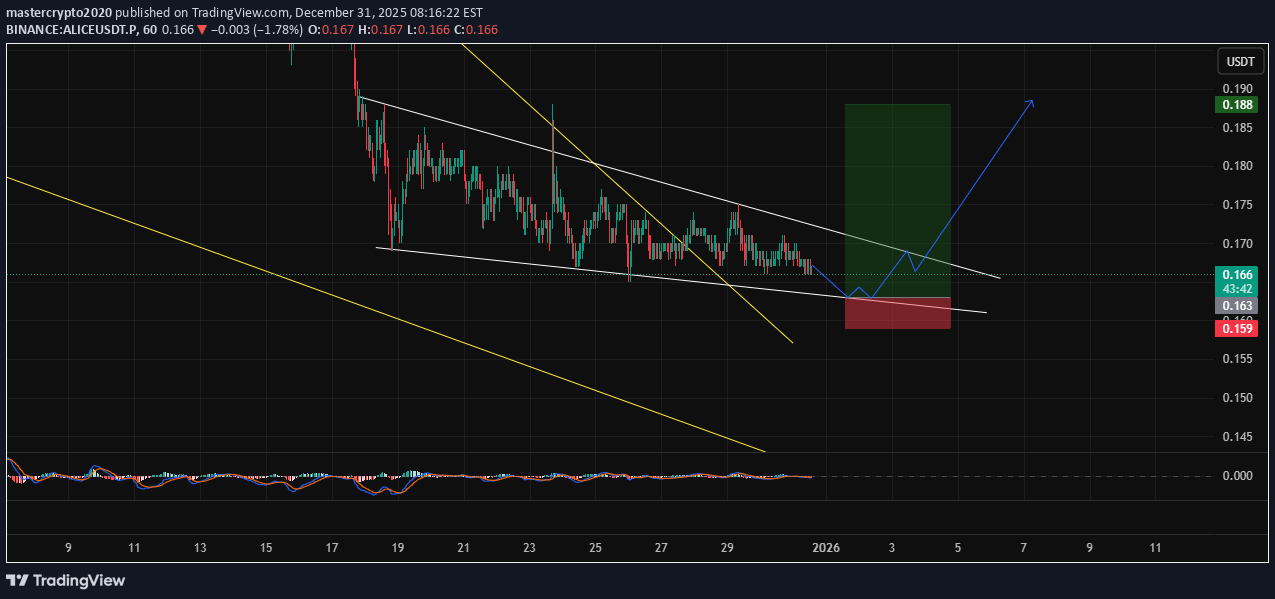
📊 Technical Analysis – ALICE/USDT (Structure-Based | No Entry / No TP / No SL) 🧠 Market Structure Overview ALICE is currently trading inside a contracting structure formed by two white trendlines, creating a descending wedge / falling wedge–like formation. Price is making lower highs and higher lows simultaneously. Volatility is compressing. Momentum is slowing near the lower boundary of the structure. This type of compression often precedes a trend reversal or strong directional expansion. 📐 Pattern Interpretation (Key Focus) Pattern Type: Descending Wedge / Contracting Structure Key Observation: The two white trendlines act like a wedge narrowing toward the right. Price is currently moving toward the lower white trendline, which is a critical decision zone. 📌 Your expectation is technically valid: Waiting for price to reach the lower white trendline and observing reaction is the correct and professional approach. 🔍 Price Behavior at the Lower White Trendline The lower boundary represents: Structural support Potential demand re-entry zone Area where sellers may lose control Possible reactions at this level: Strong bullish rejection (long wicks, impulsive candles) Momentum shift Break of internal micro structure Only after reaction, continuation toward the upper boundary becomes valid. 🔄 Expected Market Logic Compression → Liquidity builds Test of lower trendline → Decision point If support holds → Expansion to the upside Upper white trendline becomes the next structural objective 📈 This is why this structure is often associated with trend transition from bearish to bullish. 📊 Indicator Context (Secondary Confirmation) Momentum indicators are flat → confirms compression No aggressive bearish momentum → selling pressure weakening Indicators support patience, not anticipation 🧩 Summary (Clean & Post-Ready) ALICE is compressing inside a descending wedge formed by two white trendlines. Price is approaching the lower boundary of the structure. This zone is critical for observing buyer reaction. A confirmed hold and reaction can lead to a bullish expansion. No prediction — only structure-based expectation.

#ALICE/USDT – Potential Trend Reversal After Long Accumulation
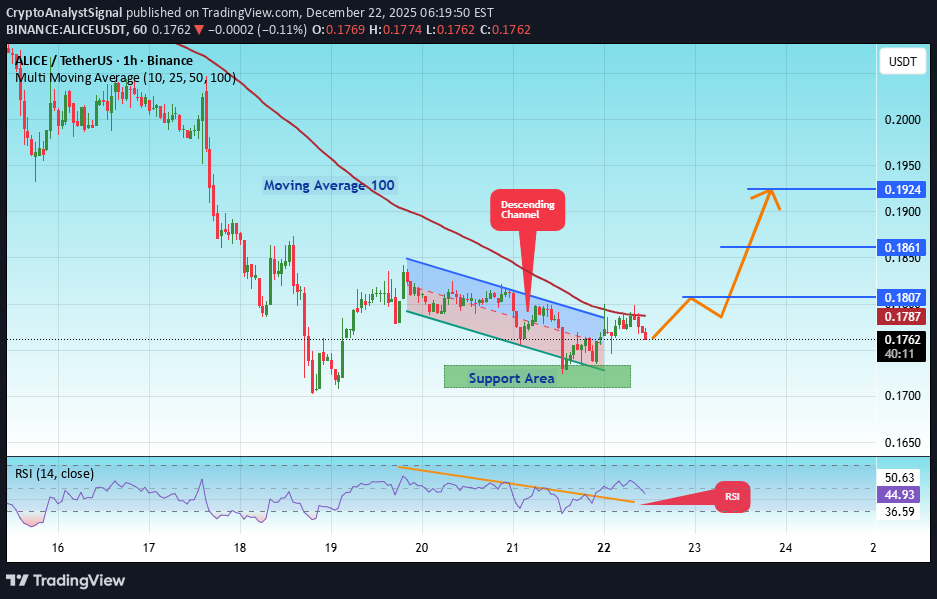
#ALICE The price is moving in a descending channel on the 1-hour timeframe. It has reached the lower boundary and is heading towards breaking above it, with a retest of the upper boundary expected. We have a downtrend on the RSI indicator, which has reached near the lower boundary, and an upward rebound is expected. There is a key support zone in green at 0.1724. The price has bounced from this zone multiple times and is expected to bounce again. We have a trend towards consolidation above the 100-period moving average, as we are moving close to it, which supports the upward movement. Entry price: 0.1807 First target: 0.1807 Second target: 0.1861 Third target: 0.1924 Don't forget a simple principle: money management. Place your stop-loss order below the support zone in green. For any questions, please leave a comment. Thank you.#ALICE First target: 0.1807 Reached Second target: 0.1861 Reached
آلیس (ALICE) در آستانه انفجار قیمتی؟ تحلیل تکنیکال و نقاط ورود و خروج قطعی
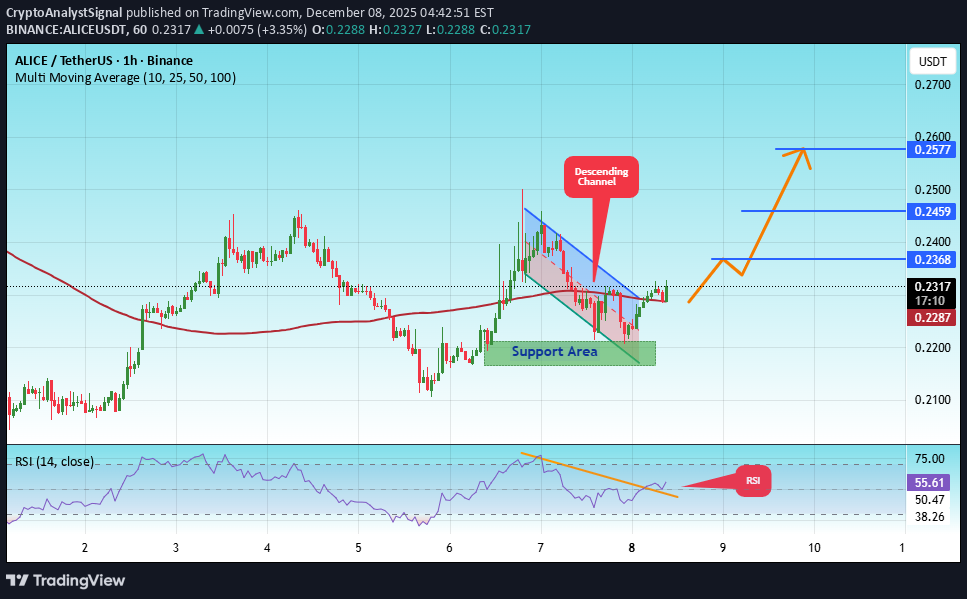
#ALICE The price is moving in a descending channel on the 1-hour timeframe. It has reached the lower boundary and is heading towards breaking above it, with a retest of the upper boundary expected. We have a downtrend on the RSI indicator, which has reached near the lower boundary, and an upward rebound is expected. There is a key support zone in green at 0.2185. The price has bounced from this zone multiple times and is expected to bounce again. We have a trend towards consolidation above the 100-period moving average, as we are moving close to it, which supports the upward movement. Entry price: 0.2320 First target: 0.2370 Second target: 0.2460 Third target: 0.2577 Don't forget a simple principle: money management. Place your stop-loss order below the support zone in green. For any questions, please leave a comment. Thank you.

آیا آلیس (ALICE) آماده جهش بزرگ است؟ تحلیل تکنیکال و منطقه تقاضای حیاتی!
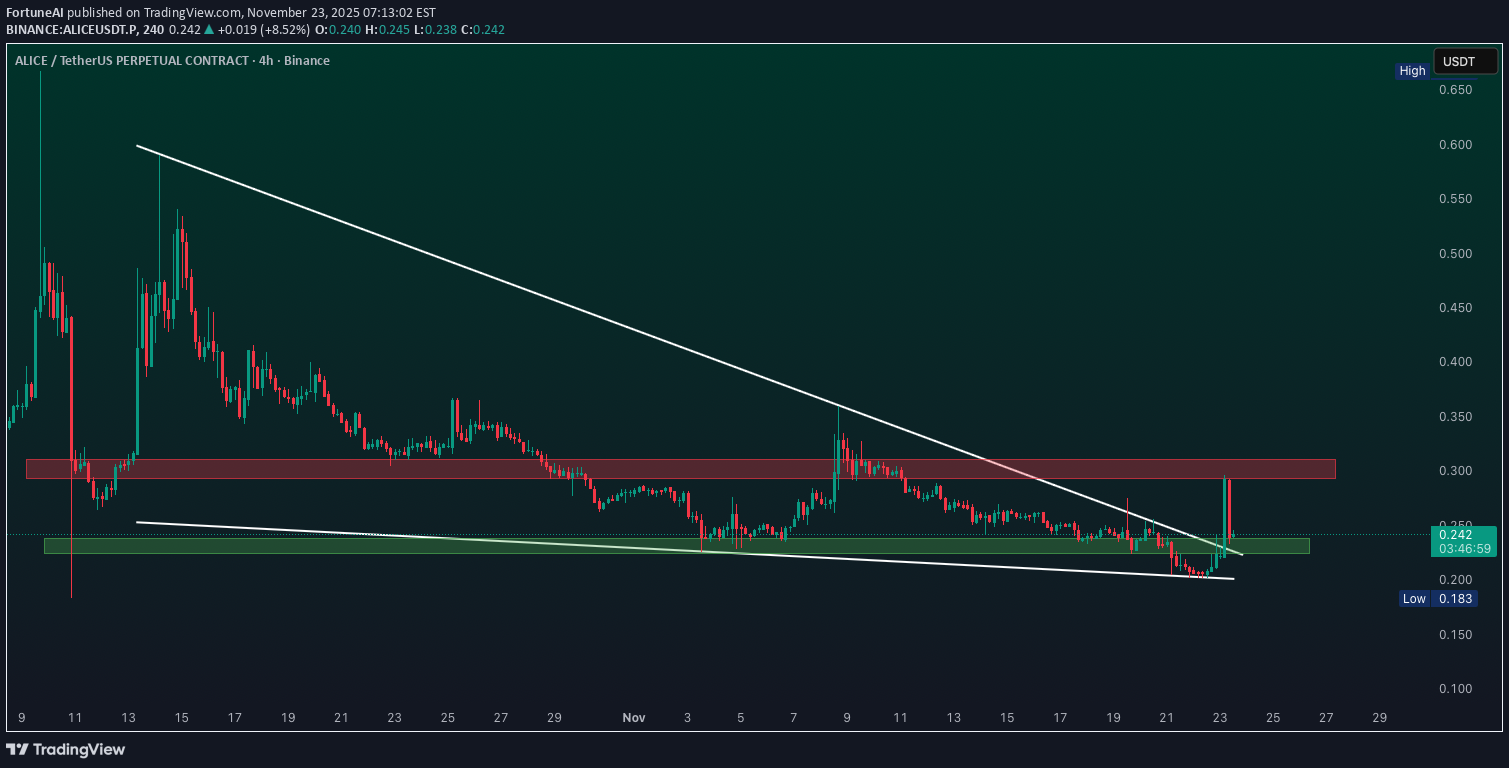
ALICE Looks Highly Oversold Here on HTF and Technicals Look Very Bullish, Sitting at Strong Liquidity Demand Zone with Breakout Confirmation. Use Proper Risk Management
سیگنال خرید پرقدرت ALICE/USDT: سود 10 برابری با حد ضرر محافظت شده!
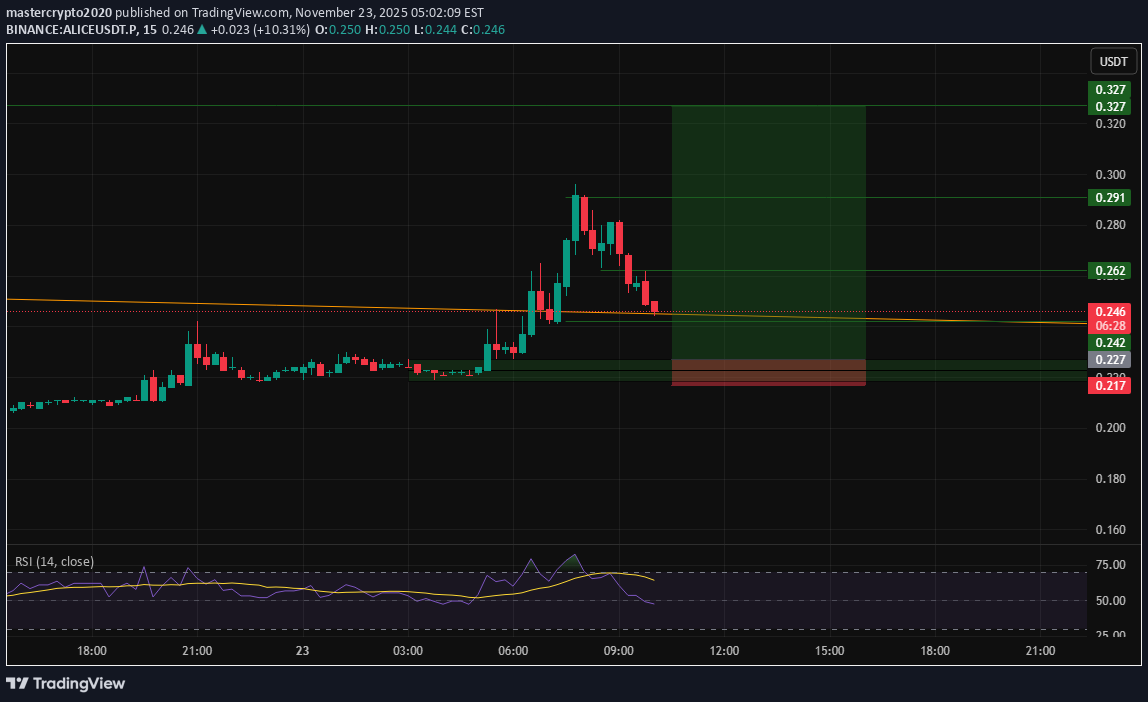
--- 📢 Trade Signal – ALICE/USDT 📈 Position Type: LONG 💰 Entry Price: 0.227 --- 🎯 Take-Profit Targets (Partial Exits) TP1 = 0.242 TP2 = 0.262 TP3 = 0.290 TP4 = 0.327 TP5 = — TP6 = — --- 🛑 Stop-Loss: 0.217 📊 Timeframe: — ⚖️ Risk/Reward Ratio: 10 💥 Suggested Leverage: 5× – 10× --- 🧠 Technical Analysis Summary ALICE is trading within a strong demand zone around 0.22–0.23, showing early bullish reaction. Price structure suggests accumulation with a potential reversal push toward upper resistance levels. Key bullish confirmations: Strong demand wick rejections Early bullish divergence forming on lower timeframes Price reclaiming micro-support levels Liquidity targets aligned at 0.242 / 0.262 / 0.290 A breakout above 0.242 (TP1) could accelerate momentum toward higher targets. --- ⚙️ Trade Management Rules ✔️ Take partial profit at TP1 ✔️ Move SL to Break-Even when TP1 is hit ✔️ Trail SL gradually toward TP2–TP4 ✔️ Avoid re-entry if price hits SL at 0.217 ✔️ Only enter after confirming chart structure --- ⚠️ Important Risk-Management Note ✔️ When TP1 is reached, SL moves to Entry Price (Break-Even) This is standard professional risk handling. ❗ If price later returns and stops you out at break-even, this is not a loss — it means risk was removed. 🔐 Capital protection always comes first. --- 📌 TradingView Hashtags #ALICEUSDT #ALICE #CryptoSignal #LongSetup #TradingView #Altcoins #TechnicalAnalysis #FuturesTrading ---
آلیس در آستانه انفجار: پیشبینی تغییر روند صعودی قوی (تحلیل تکنیکال ALICE/USDT)
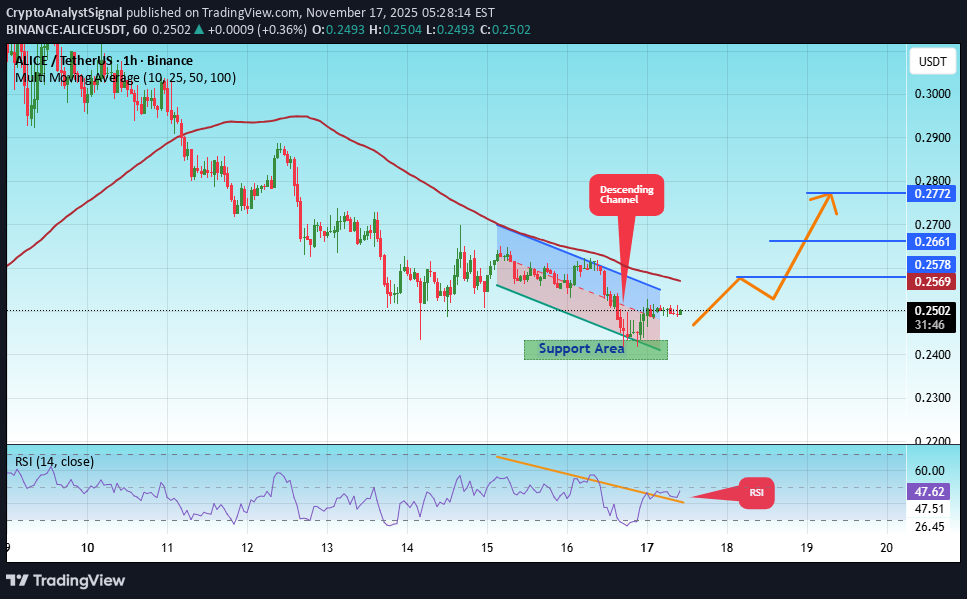
#ALICE The price is moving within an ascending channel on the 1-hour timeframe and is adhering to it well. It is poised to break out strongly and retest the channel. We have a downtrend line on the RSI indicator that is about to break and retest, which supports the upward move. There is a key support zone in green at the 0.2400 price level, representing a strong support point. We have a trend of consolidation above the 100-period moving average. Entry price: 0.2500 First target: 0.2578 Second target: 0.2661 Third target: 0.2272 Don't forget a simple money management rule: Place your stop-loss order below the green support zone. Once you reach the first target, save some money and then change your stop-loss order to an entry order. For any questions, please leave a comment. Thank you.#ALICE First target: 0.2578 Reached Second target: 0.2661 Reached Third target: 0.2272 Reached

آلیس: راز پنهان 1300 روزه و پتانسیل انفجاری 2000 درصدی!
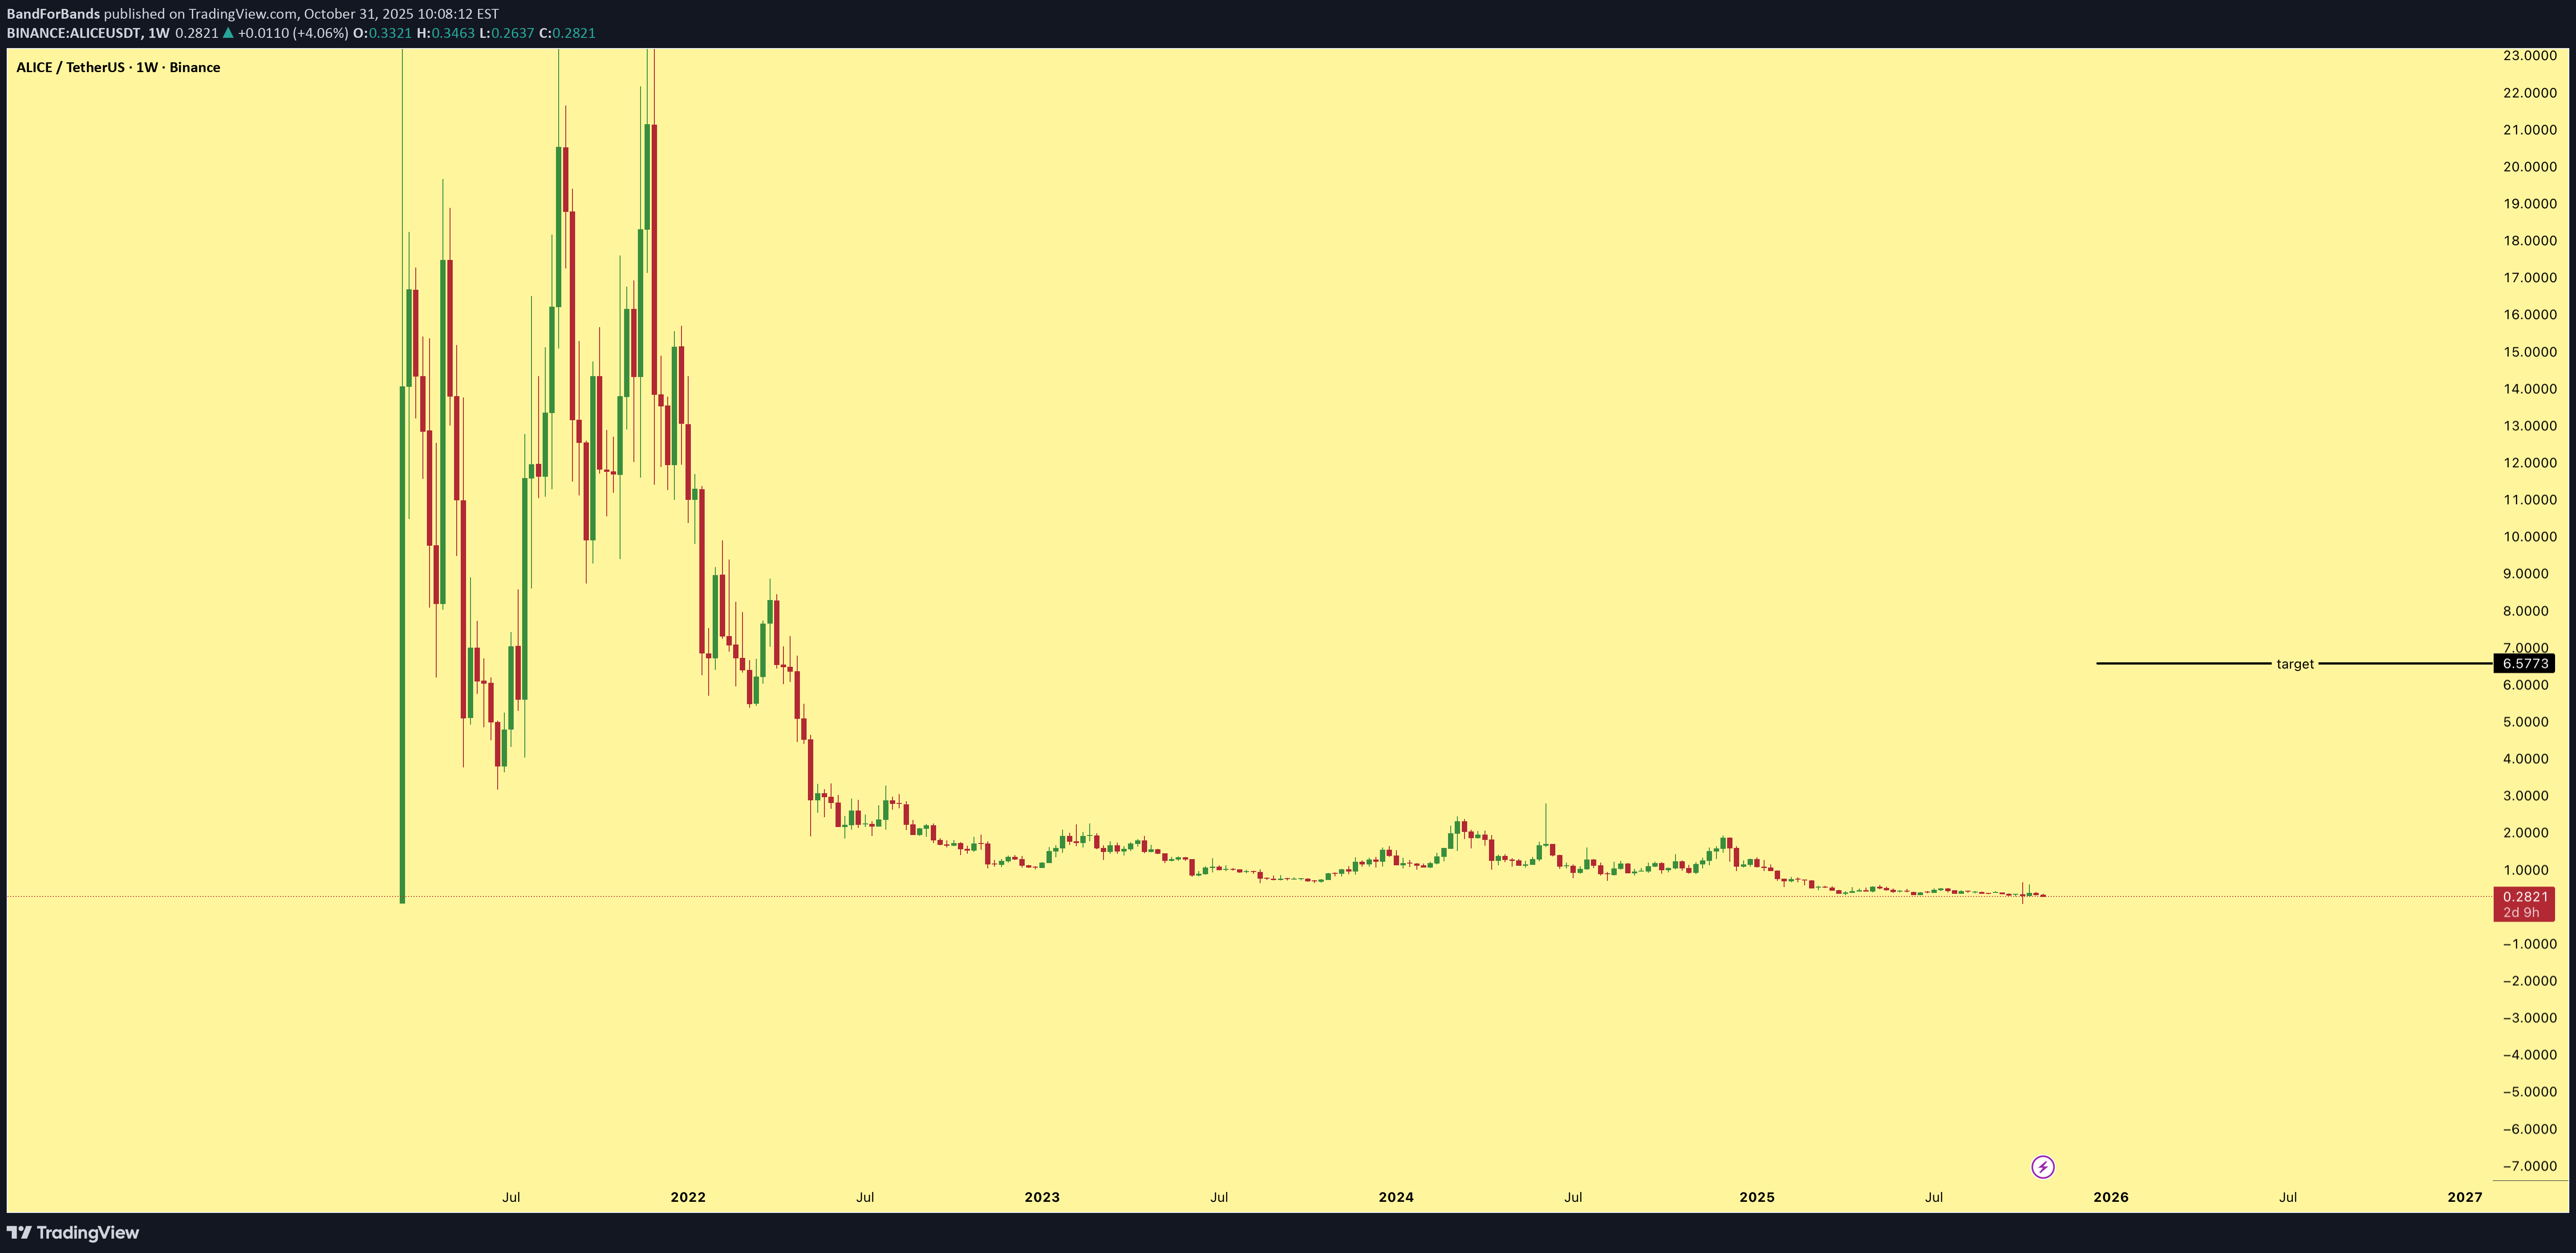
$ALICE has been accumulating for nearly 1300 days, forming a strong long-term base. The structure suggests a massive upside potential of over 2000% from current levels. This is a classic high-reward setup where patience could pay off in a major way.
آلیس در آستانه انفجار قیمتی: تحلیل شکاف کانال نزولی و فرصت خرید طلايی!
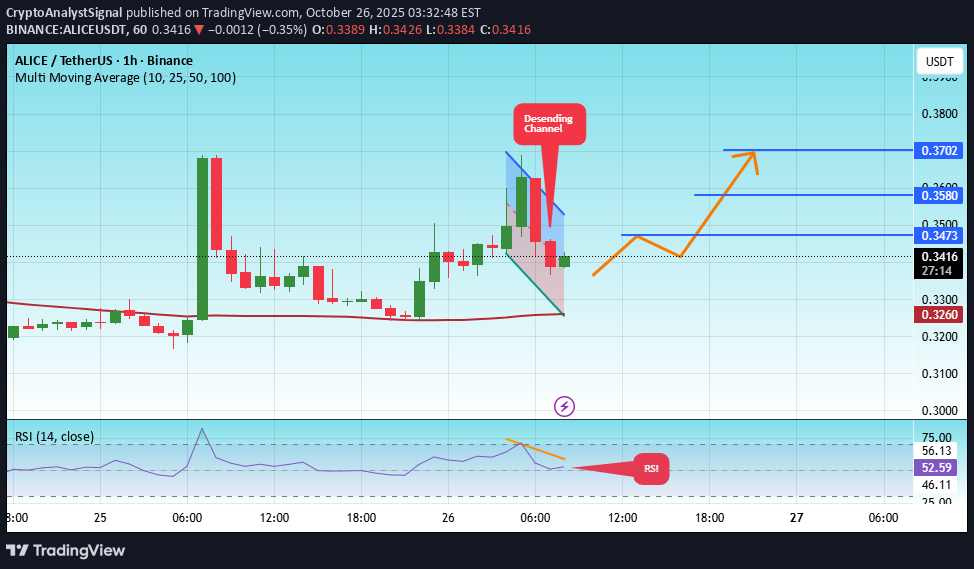
#ALICE The price is moving within a descending channel on the 1-hour frame, adhering well to it, and heading for a strong breakout and retest. We have a bearish trend on the RSI indicator that is about to be broken and retested, which supports the upward move. There is a major support area in green at 0.3306, which represents a strong support point. We are heading for consolidation above the 100 moving average. Entry price: 0.4168 First target: 0.3473 Second target: 0.3580 Third target: 0.7300 Don't forget a simple matter: capital management. When you reach the first target, save some money and then change your stop-loss order to an entry order. For inquiries, please leave a comment. Thank you.Update Price #ALICE Entry price: 0.3416 First target: 0.3473 Second target: 0.3580 Third target: 0.3702#ALICE First target: 0.3473 Reached Second target: 0.3580 Reached Third target: 0.3702 Reached
تحلیل شگفتانگیز آلیس (ALICE/USDT): فرصت صعود قوی در کانال نزولی!
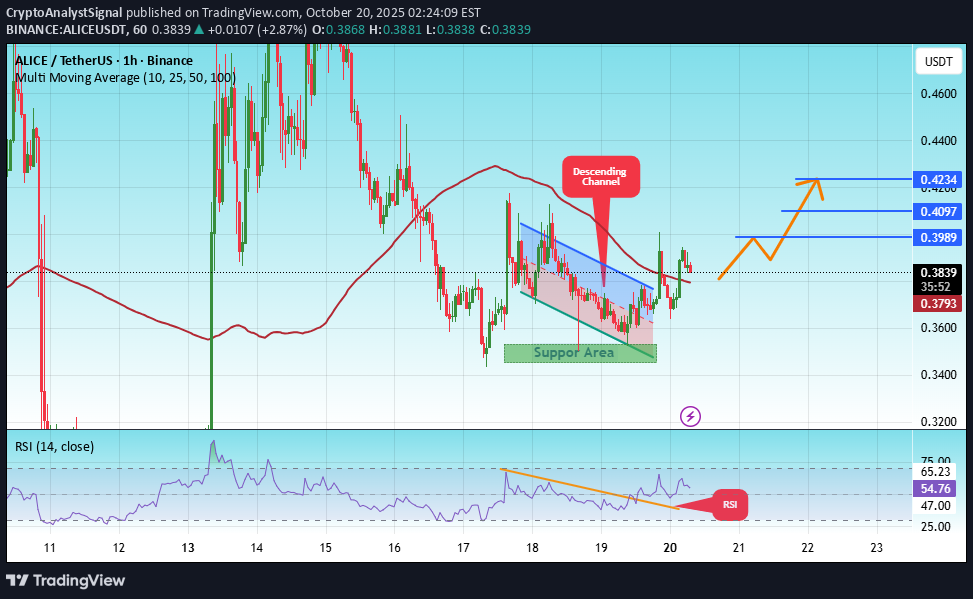
#ALICE The price is moving within a descending channel on the 1-hour frame, adhering well to it, and is heading for a strong breakout and retest. We have a bearish trend on the RSI indicator that is about to be broken and retested, which supports the upward breakout. There is a major support area in green at 0.3500, which represents a strong support point. We are heading for stability above the 100 moving average. Entry price: 0.3849 First target: 0.3989 Second target: 0.4097 Third target: 0.4234 Don't forget a simple matter: capital management. When you reach the first target, save some money and then change your stop-loss order to an entry order. For inquiries, please leave a comment. Thank you.

آیا قیمت موشک به ۱.۵ میرسد؟ پیشبینی صعودی و محدوده مهم حفظ قیمت!

Disclaimer
Any content and materials included in Sahmeto's website and official communication channels are a compilation of personal opinions and analyses and are not binding. They do not constitute any recommendation for buying, selling, entering or exiting the stock market and cryptocurrency market. Also, all news and analyses included in the website and channels are merely republished information from official and unofficial domestic and foreign sources, and it is obvious that users of the said content are responsible for following up and ensuring the authenticity and accuracy of the materials. Therefore, while disclaiming responsibility, it is declared that the responsibility for any decision-making, action, and potential profit and loss in the capital market and cryptocurrency market lies with the trader.