
ACM
AC Milan Fan Token
| تریدر | نوع سیگنال | حد سود/ضرر | زمان انتشار | مشاهده پیام |
|---|---|---|---|---|
 Alpha-GoldFXRank: 32207 | خرید | حد سود: تعیین نشده حد ضرر: تعیین نشده | 11/26/2025 |
Price Chart of AC Milan Fan Token
سود 3 Months :
سیگنالهای AC Milan Fan Token
Filter
Sort messages by
Trader Type
Time Frame

Bithereum_io
ACMUSDT 1D
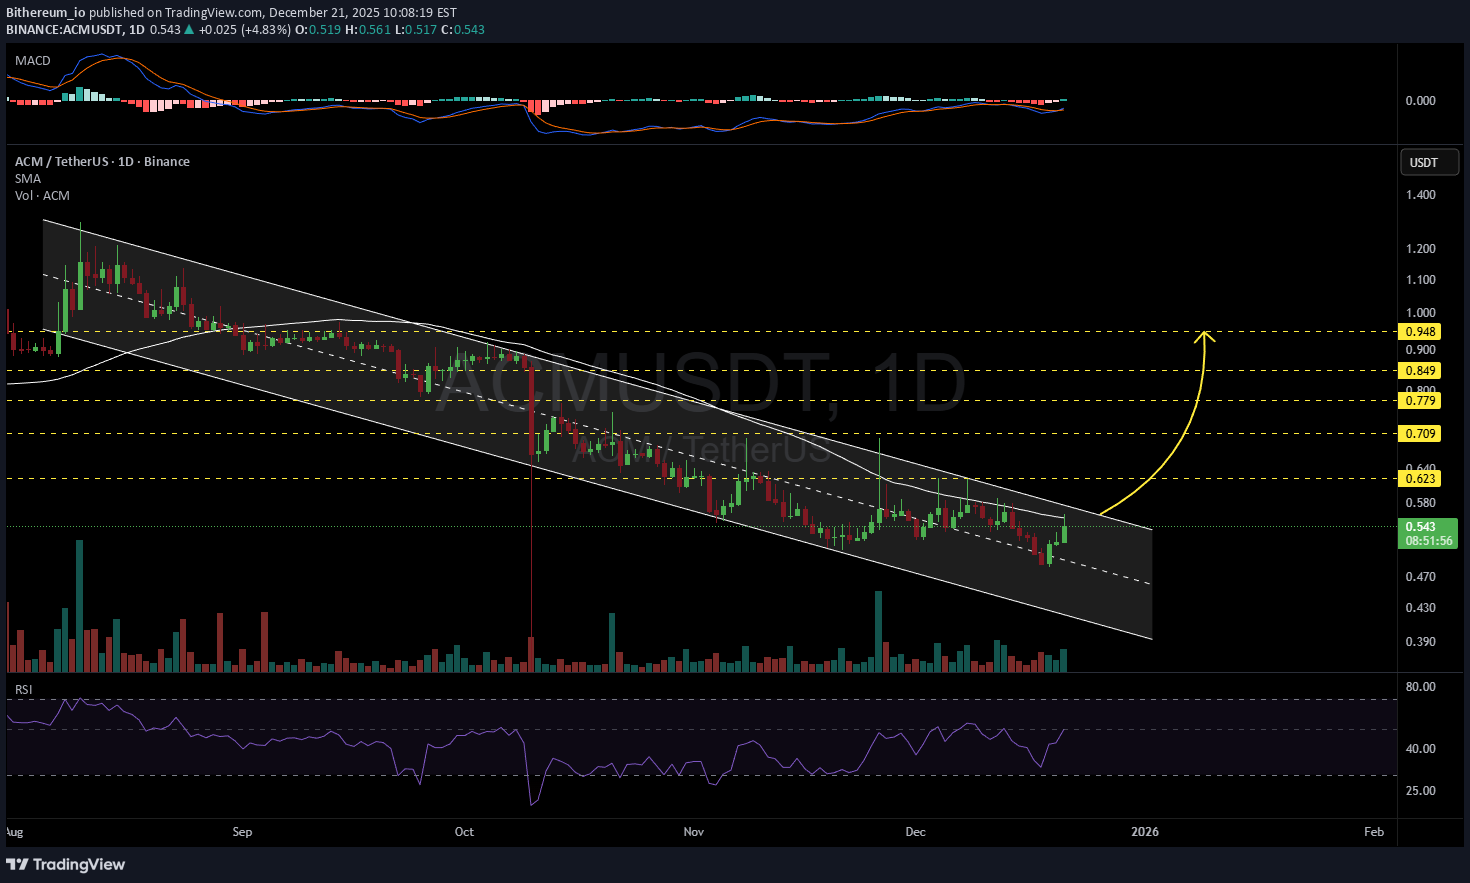
#ACM is trading within a descending channel on the daily timeframe. Entry is advised only after a confirmed breakout above both the daily SMA50 and the channel resistance. If that breakout occurs, the potential upside targets are: 🎯 $0.623 🎯 $0.709 🎯 $0.779 🎯 $0.849 🎯 $0.948 ⚠️ Always remember to use a tight stop-loss and maintain proper risk management.
Alpha-GoldFX
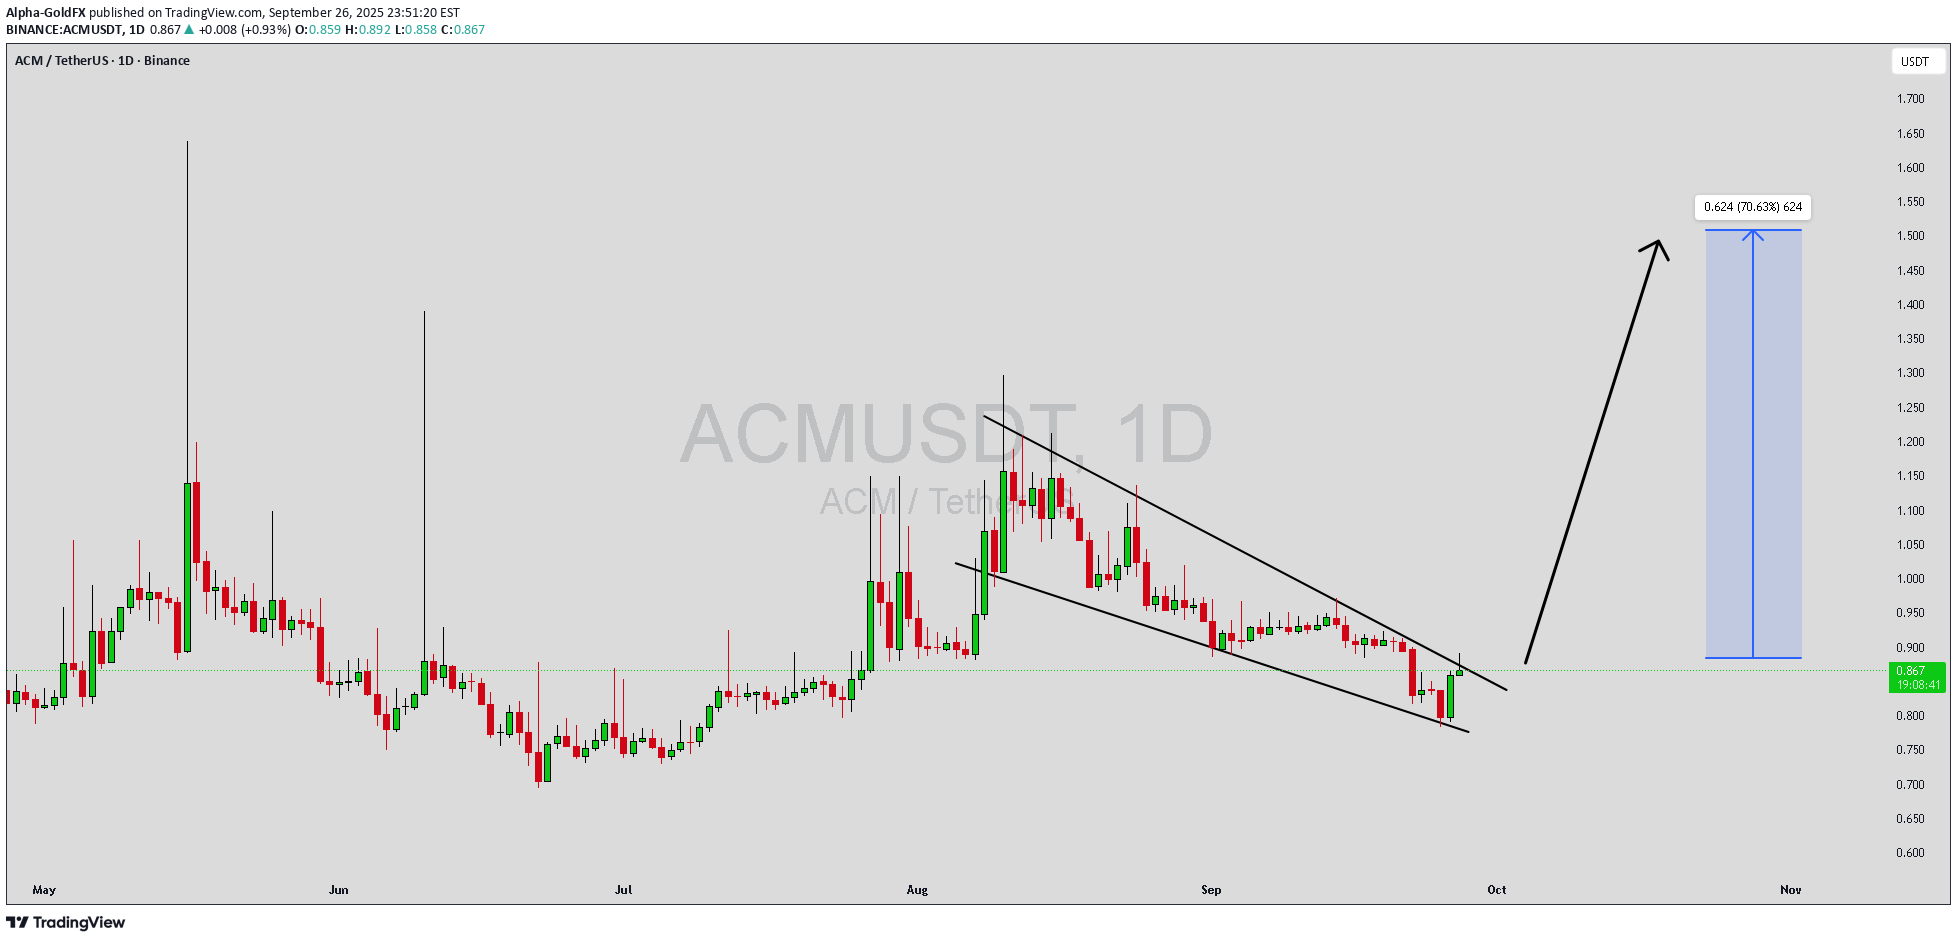
هشدار صعودی بزرگ: الگوی گُوِه نزولی در ACMUSDT نویدبخش رشد 100 درصدی!
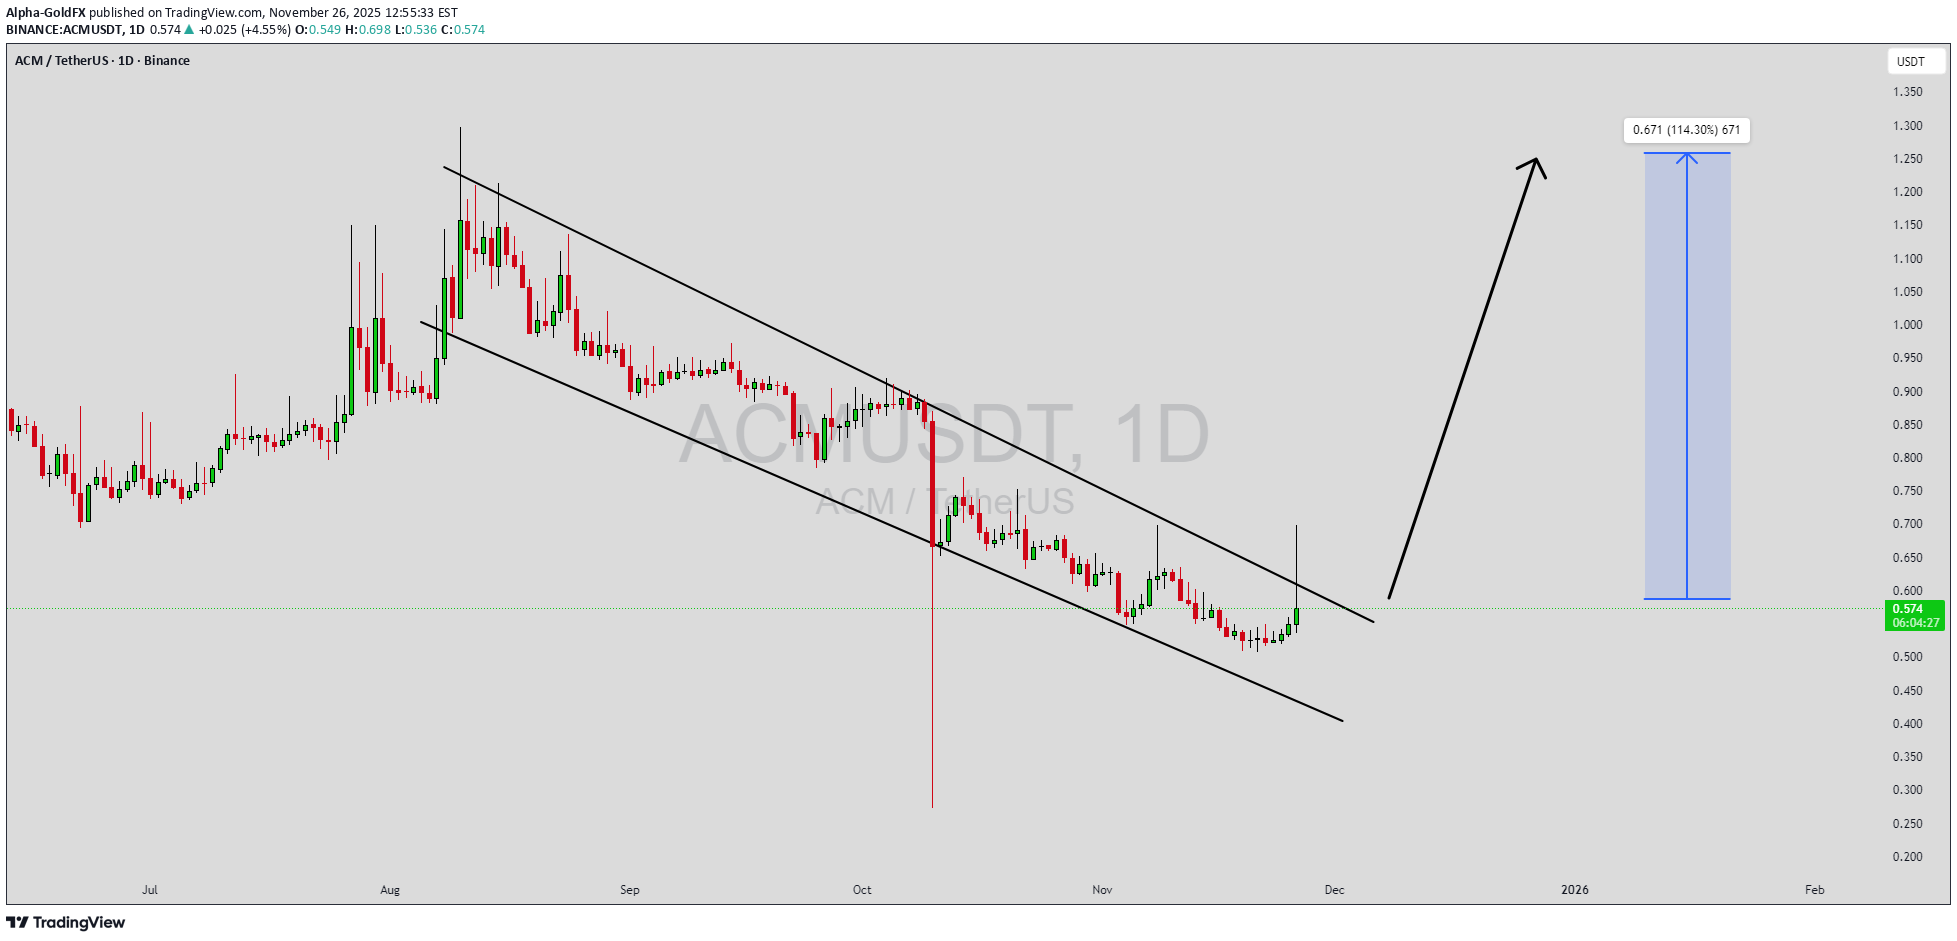
ACMUSDT is forming a clear falling wedge pattern, a classic bullish reversal signal that often indicates an upcoming breakout. The price has been consolidating within a narrowing range, suggesting that selling pressure is weakening while buyers are beginning to regain control. With consistent volume confirming accumulation at lower levels, the setup hints at a potential bullish breakout soon. The projected move could lead to an impressive gain of around 90% to 100% once the price breaks above the wedge resistance. This falling wedge pattern is typically seen at the end of downtrends or corrective phases, and it represents a potential shift in market sentiment from bearish to bullish. Traders closely watching ACMUSDT are noting the strengthening momentum as it nears a breakout zone. The good trading volume adds confidence to this pattern, showing that market participants are positioning early in anticipation of a reversal. Investors’ growing interest in ACMUSDT reflects rising confidence in the project’s long-term fundamentals and current technical strength. If the breakout confirms with sustained volume, this could mark the start of a fresh bullish leg. Traders might find this a valuable setup for medium-term gains, especially as the wedge pattern completes and buying momentum accelerates. ✅ Show your support by hitting the like button and ✅ Leaving a comment below! (What is your opinion about this Coin?) Your feedback and engagement keep me inspired to share more insightful market analysis with you!

CryptoWithJames
ACMUSDT UPDATE
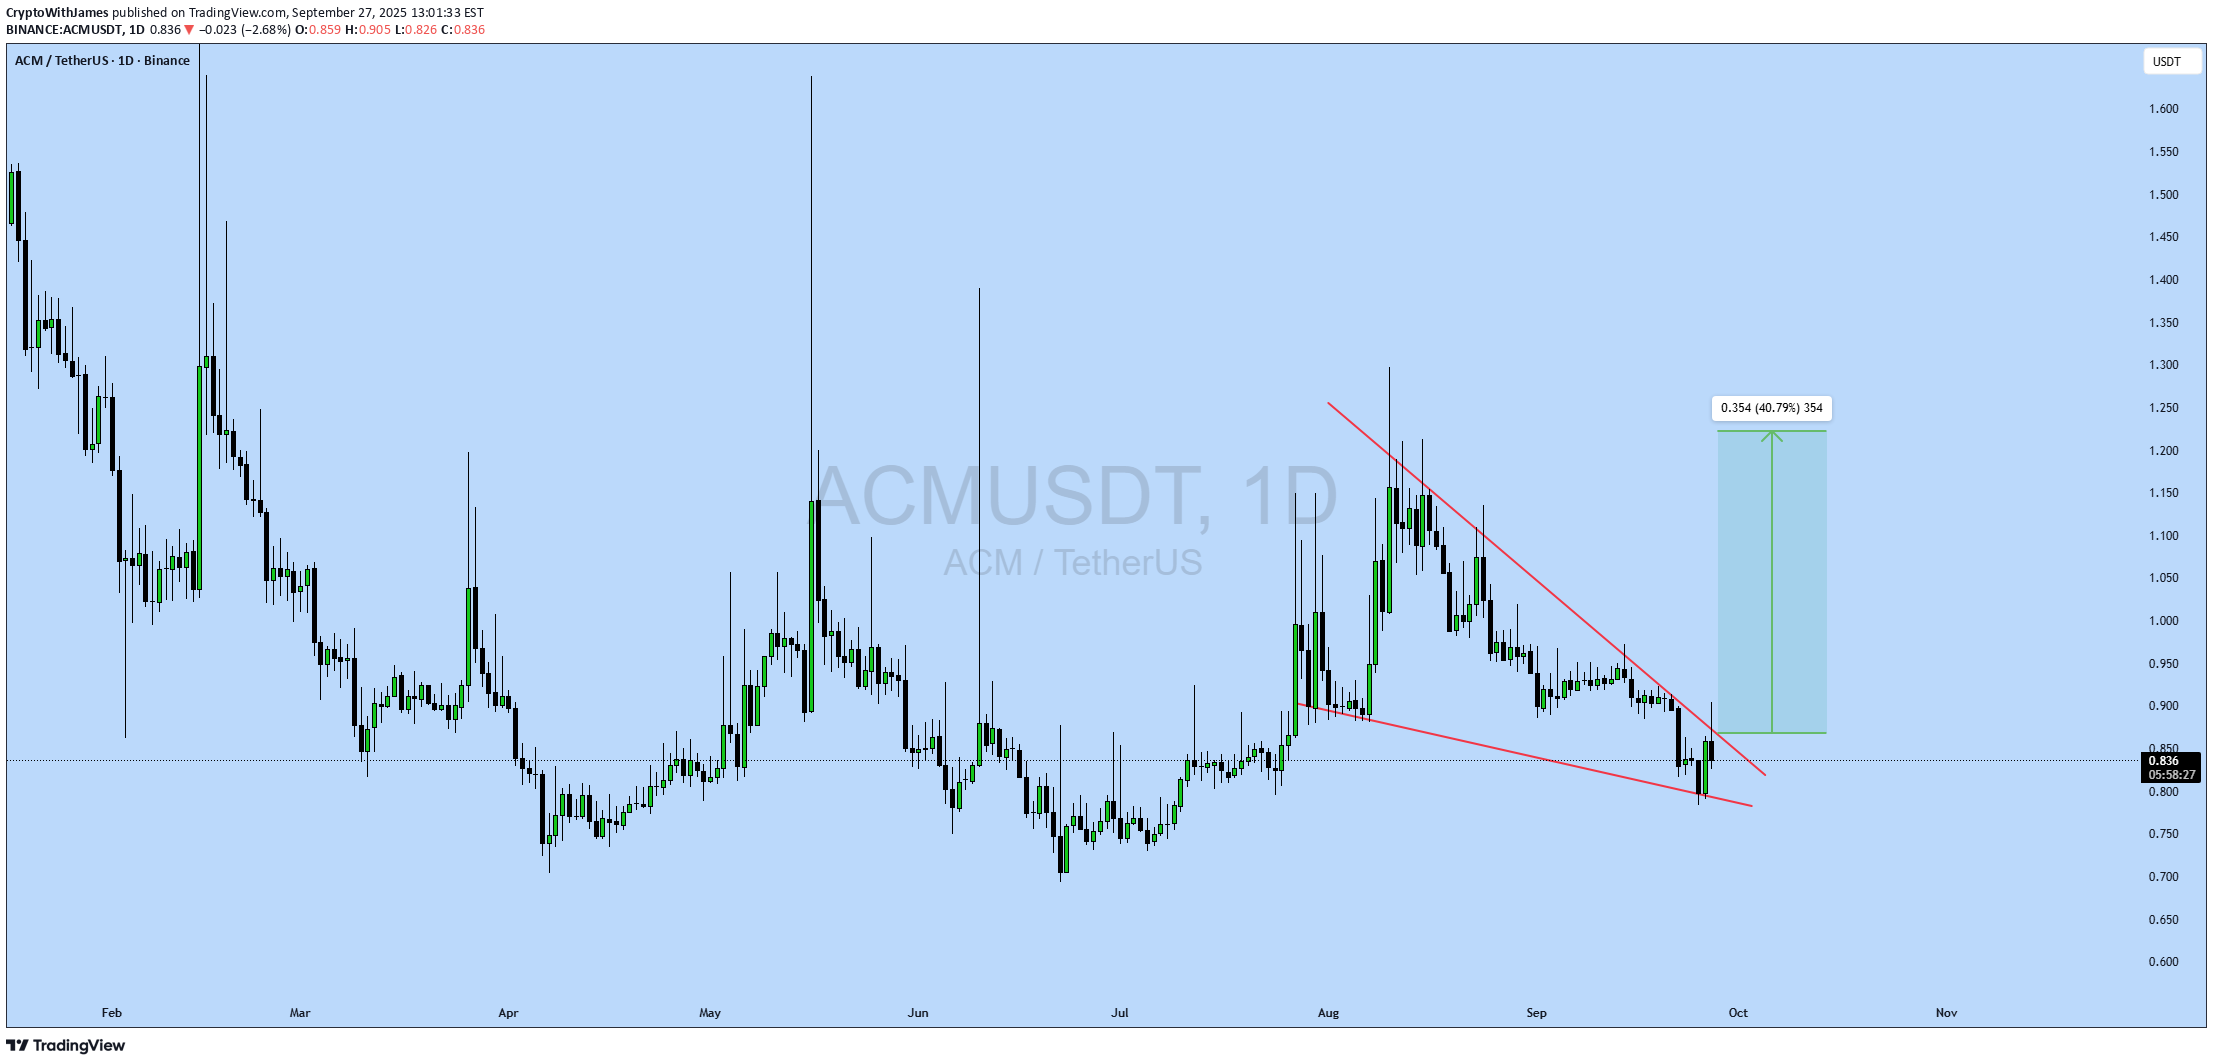
#ACM UPDATE ACM Technical Setup Pattern: Bullish falling wedge breakout Current Price: $0.836 Target Price: $1.19 Target % Gain: 40.79% ACM is breaking out of a falling wedge pattern on the 1D timeframe, signaling a bullish reversal setup with potential upside towards $1.19. The structure favors continuation if momentum sustains. Always use proper risk management.
Bithereum_io
ACMUSDT 1D
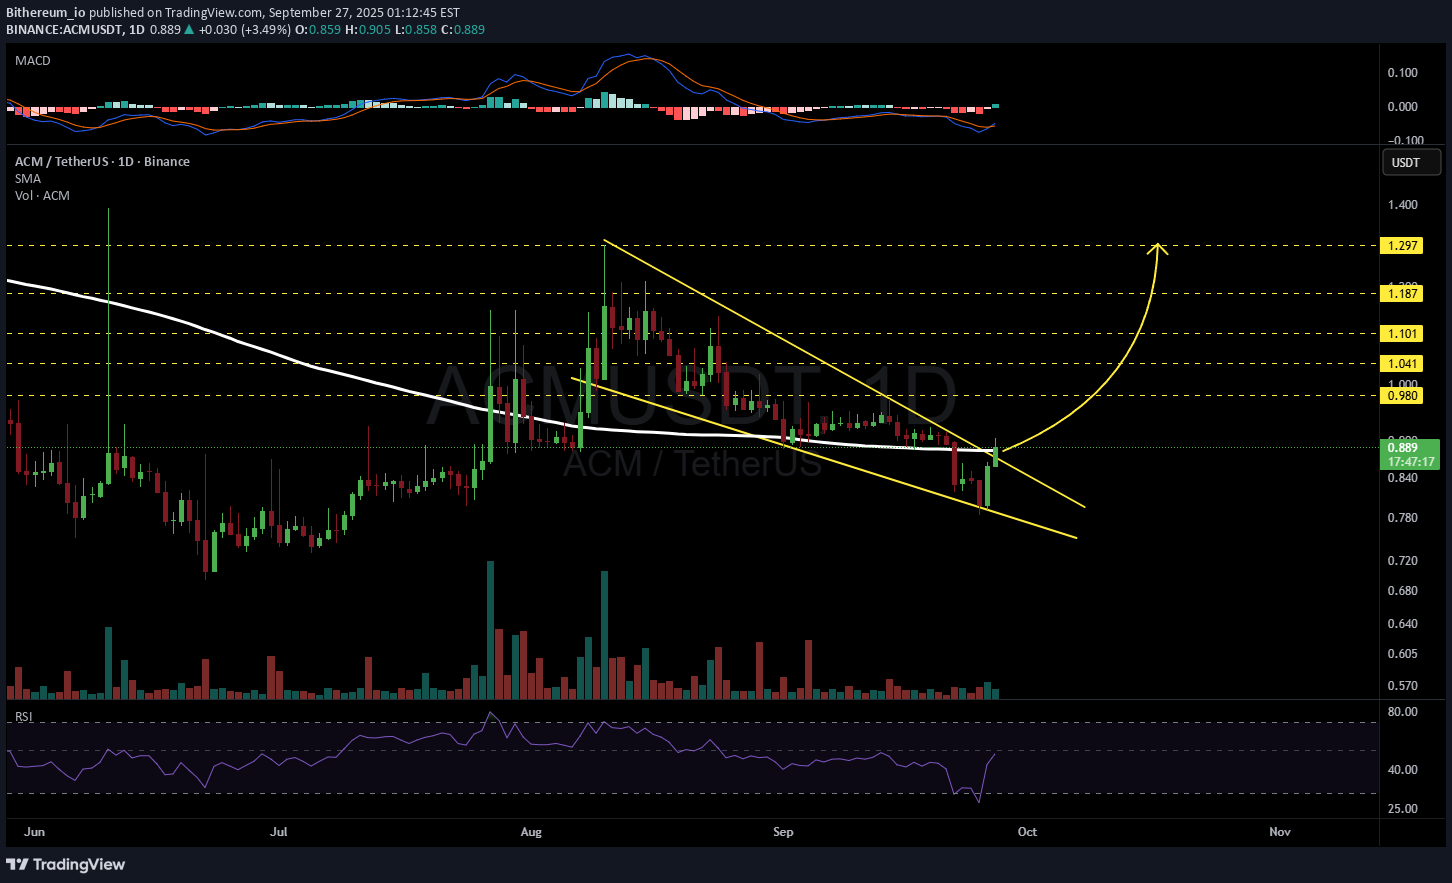
#ACM has broken above the falling wedge resistance on the daily timeframe and is now facing the daily SMA200. In case of a successful retest of the pattern and a breakout above the SMA200, the potential targets are: 🎯 $0.980 🎯 $1.041 🎯 $1.101 🎯 $1.187 🎯 $1.297 ⚠️ Always remember to use a tight stop-loss and follow proper risk management.
Alpha-GoldFX
ACMUSDT Forming Falling Wedge
ACMUSDT is currently showing a falling wedge pattern, which is a strong bullish reversal signal in technical analysis. This pattern often forms after a period of consolidation and usually indicates that the downtrend is losing momentum, paving the way for a breakout to the upside. With good trading volume backing the move, ACMUSDT looks poised for a potential rally targeting a 60% to 70%+ gain. The falling wedge structure highlights how the price is narrowing within declining trendlines, reflecting weakening selling pressure. Once buyers gain control and the price breaks above the resistance trendline, strong momentum could drive ACMUSDT into higher price zones. This makes the current market conditions favorable for those watching for an entry before the breakout confirmation. Investor interest in ACMUSDT is steadily growing, adding confidence to the bullish outlook. A breakout from this wedge pattern, coupled with increasing demand, could set the stage for a significant upward move, making ACMUSDT a coin worth keeping under close observation in the coming weeks. ✅ Show your support by hitting the like button and ✅ Leaving a comment below! (What is You opinion about this Coin) Your feedback and engagement keep me inspired to share more insightful market analysis with you!
Bithereum_io
ACMUSDT 1D

#ACM is moving inside a descending channel on the daily chart. It has been rejected from the channel resistance and the Ichimoku cloud. If the daily candle closes below the daily MA50, it will likely retest the support zone and the channel’s midline. In case of a breakout above the channel resistance, the targets are:🎯 $1.054🎯 $1.249🎯 $1.406🎯 $1.564⚠️ Use a tight stop-loss.

MasterAnanda
AC Milan Fan Token, Volume Signal

Here we have the "volume signal" as well as other signals that I mentioned in the ATM analysis. That is, ACMUSDT is now trading green for four consecutive weeks after a new All-Time Low and the action just recovered above its 3-Feb. low.Good afternoon my fellow football fan, how are you feeling in this wonderful day?This is a great chart because prices are low and the best time to buy is when a trading pair (a Cryptocurrency project) is trading low near support. As soon as the first major low came in February 2025, the session that followed produced the highest buy volume ever. Then again in late March there is really high volume and the last four weeks volume has been good (above-average) and green. Before February 2025, the volume bars are very small, very small... With the exception of August 2022 when the All-Time High was hit followed by the strongest and longest bearish cycle in the history of this coin.A long-term downtrend or bear market is followed by a long-term uptrend or bull market. This is a good pair right now.Strategy: Just buy and hold, never use a stop-loss, never, unless you are a professional trader and have been trading Crypto for 6 years or more. If you have been around for less than six years, you don't need a stop-loss. You can make more money with the strategy of buy and hold. With time you will understand. If you set a stop-loss, the whales and bots will take your money away. You just need to inject money into the market every day, every week, every month or as much as you can afford; let it grow. With time, you will be happy with the results. Set it and forget it, that is all it takes. You just wait patiently and over time you will see how your balance appreciates. This is a young market, imagine buying Google, Apple or Microsoft when these companies were new and young. You don't want to be selling nor setting stop-loss orders on these stocks, you just wanted to buy to later retire when the inevitable happens. Or you can sell when prices are up. Never sell when prices are down.If you don't sell at the All-Time High, there is no point in selling at the All-Time Low. Better wait, it will recover.Thanks a lot for your continued support.Namaste.Bullish breakout confirmed. That's more than 80% but this is only the start.Prepare for massive growth.

pasamalum

pasamalum


navid_aerospace
ACMUSDT Analysis: Meaningful Upside Opportunity

ACMUSDT is one of the rare coins showing a significant and meaningful upward movement. The blue box on the chart is a carefully identified demand zone, making it an ideal area to consider becoming a buyer.Key Points:Demand Zone: The blue box is selected using advanced techniques, including volume footprint, liquidity heatmaps, and cumulative delta volume.Market Context: ACMUSDT stands out in a market where few coins are displaying meaningful upward trends.Risk Management: Always manage your risk effectively and wait for proper confirmation before entering trades.Confirmation Indicators:When trading the blue box, I utilize the following tools for precision:Cumulative Delta Volume (CDV)Liquidity HeatmapVolume ProfileVolume FootprintUpward Market Structure Breaks on Lower Time FramesLearn with Me:If you want to learn how to identify demand zones using these professional tools, feel free to DM me for guidance and training.Final Note:In uncertain markets, it's essential to focus on strong, confirmed levels. Keep patience, follow the plan, and trade responsibly. Wishing you all success in your trading journey!
Disclaimer
Any content and materials included in Sahmeto's website and official communication channels are a compilation of personal opinions and analyses and are not binding. They do not constitute any recommendation for buying, selling, entering or exiting the stock market and cryptocurrency market. Also, all news and analyses included in the website and channels are merely republished information from official and unofficial domestic and foreign sources, and it is obvious that users of the said content are responsible for following up and ensuring the authenticity and accuracy of the materials. Therefore, while disclaiming responsibility, it is declared that the responsibility for any decision-making, action, and potential profit and loss in the capital market and cryptocurrency market lies with the trader.