
1INCH
1inch
| تریدر | نوع سیگنال | حد سود/ضرر | زمان انتشار | مشاهده پیام |
|---|---|---|---|---|
خرید | حد سود: تعیین نشده حد ضرر: تعیین نشده | 12/27/2025 | ||
خرید | حد سود: تعیین نشده حد ضرر: تعیین نشده | 12/16/2025 |


Price Chart of 1inch
سود 3 Months :
خلاصه سیگنالهای 1inch
سیگنالهای 1inch
Filter
Sort messages by
Trader Type
Time Frame
1INCHUSDT LONG SIGNAL
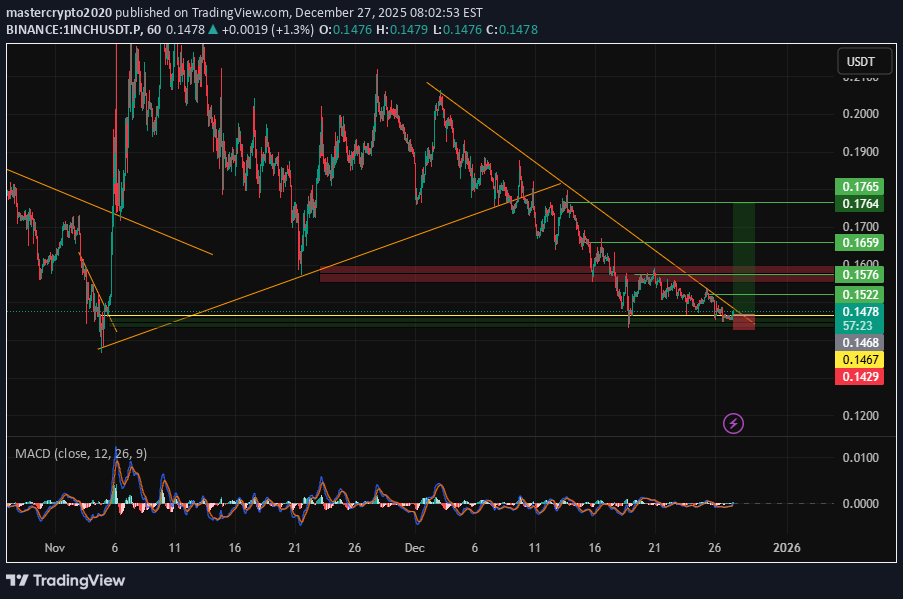
--- 📢 **Trade Idea – 1INCH/USDT** 📈 **Position Type:** LONG 💰 **Entry Price:** 0.1468 🛑 **Stop-Loss:** 0.1429 🎯 **Take-Profit Targets (Partial Exits):** • TP1: 0.1522 • TP2: 0.1576 • TP3: 0.1659 • TP4: 0.1764 📊 **Timeframe:** 15m ⚙️ **Suggested Leverage:** 3× --- 🧠 **Technical Analysis** Price is trading at the lower boundary of a falling wedge and reacting from a strong demand zone. The structure suggests a potential bullish breakout with continuation toward higher resistance levels. Targets are aligned with key liquidity and resistance zones. --- ⚙️ **Trade Management Plan** ✔️ Take partial profit at TP1 ✔️ Move Stop-Loss to Break-Even after TP1 ✔️ Secure profits step by step ✔️ If a 15m candle closes below 0.1429 → setup invalid --- ⚠️ **Risk Disclaimer** This is not financial advice. Always manage your own risk. Capital protection comes first. --- — **mastercrypto2020✅ UPDATE – 1INCH/USDT 🎯 TP1 Hit 📈 +3.6% Profit Secured • First target reached successfully • Partial profit taken • Stop-Loss moved to Break-Even • Trade is now risk-free ➡️ Holding remaining position for higher targets 📊 Structure still valid #1INCH #CryptoUpdate #TradingView #TPHit #RiskFreeTrade
1INCH: Swing position on the daily chart.
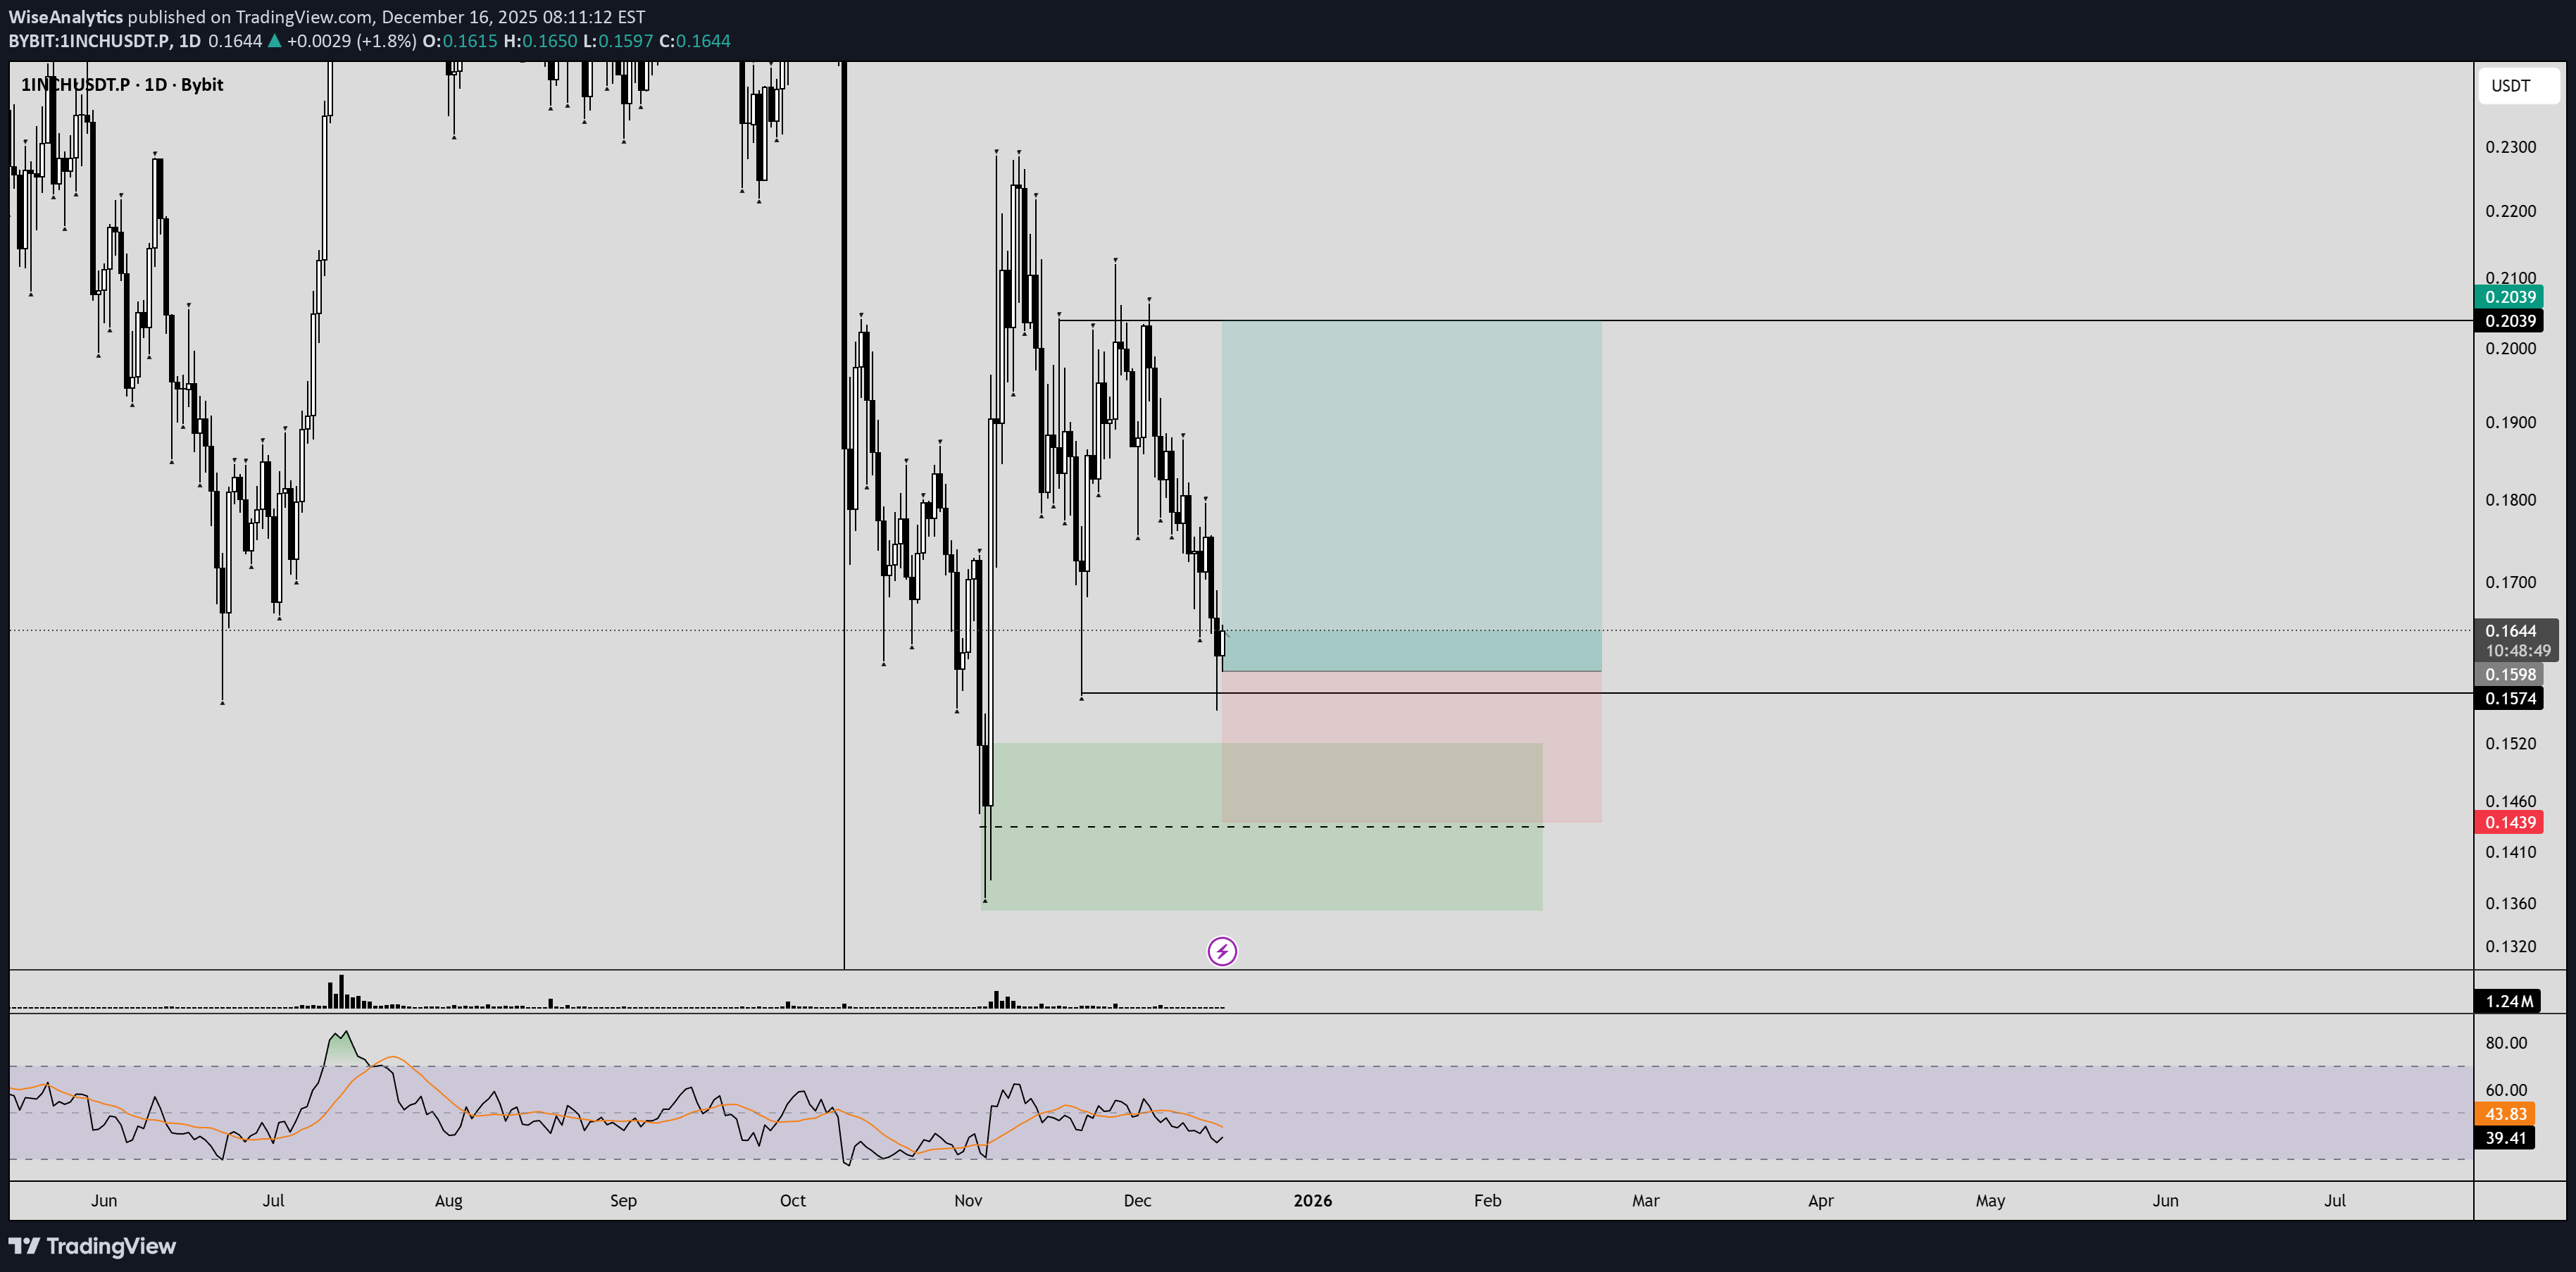
Excellent structure. I removed the fat — liquidity capture. The target is 0.204. When 0.17 is reached, I will secure part of the profit and move the stop to break even. 1INCHUSDT.P
1INCH – Long Setup Idea (15m)
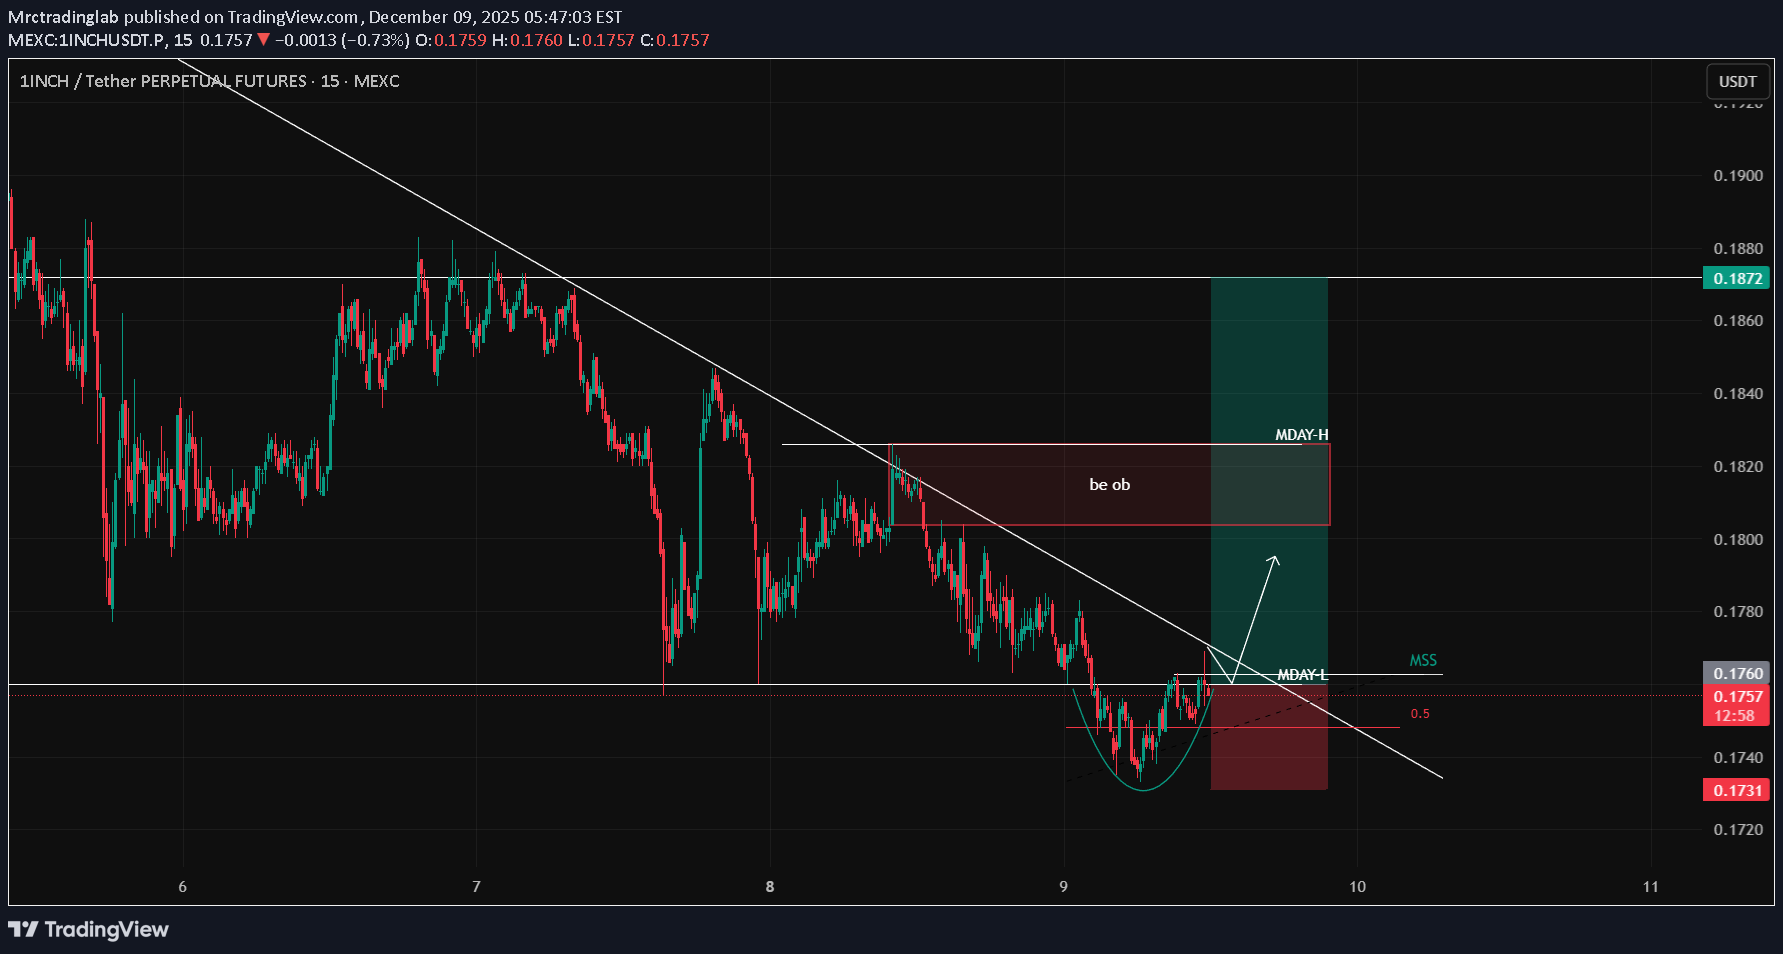
The weekend range has been fully swept, and price has moved back inside the Monday range. After reclaiming the MDAY-Low, we can see early signs of a shift in momentum, supported by the Total Market Cap structure which also suggests a potential long opportunity. Price is breaking above the descending trendline while forming a rounded retest structure. My first target is the Monday High (MDAY-H), where a bearish order block sits. I plan to secure 50% profits at that level and let the remainder run if market strength continues. Invalidation sits below the recent swing low. MrCMoved SL to EP. free ride nowTarget hit 🎯
تحلیل 1INCH/USDT: مثلث نزولی بلندمدت و دو راهی حیاتی حمایت و مقاومت
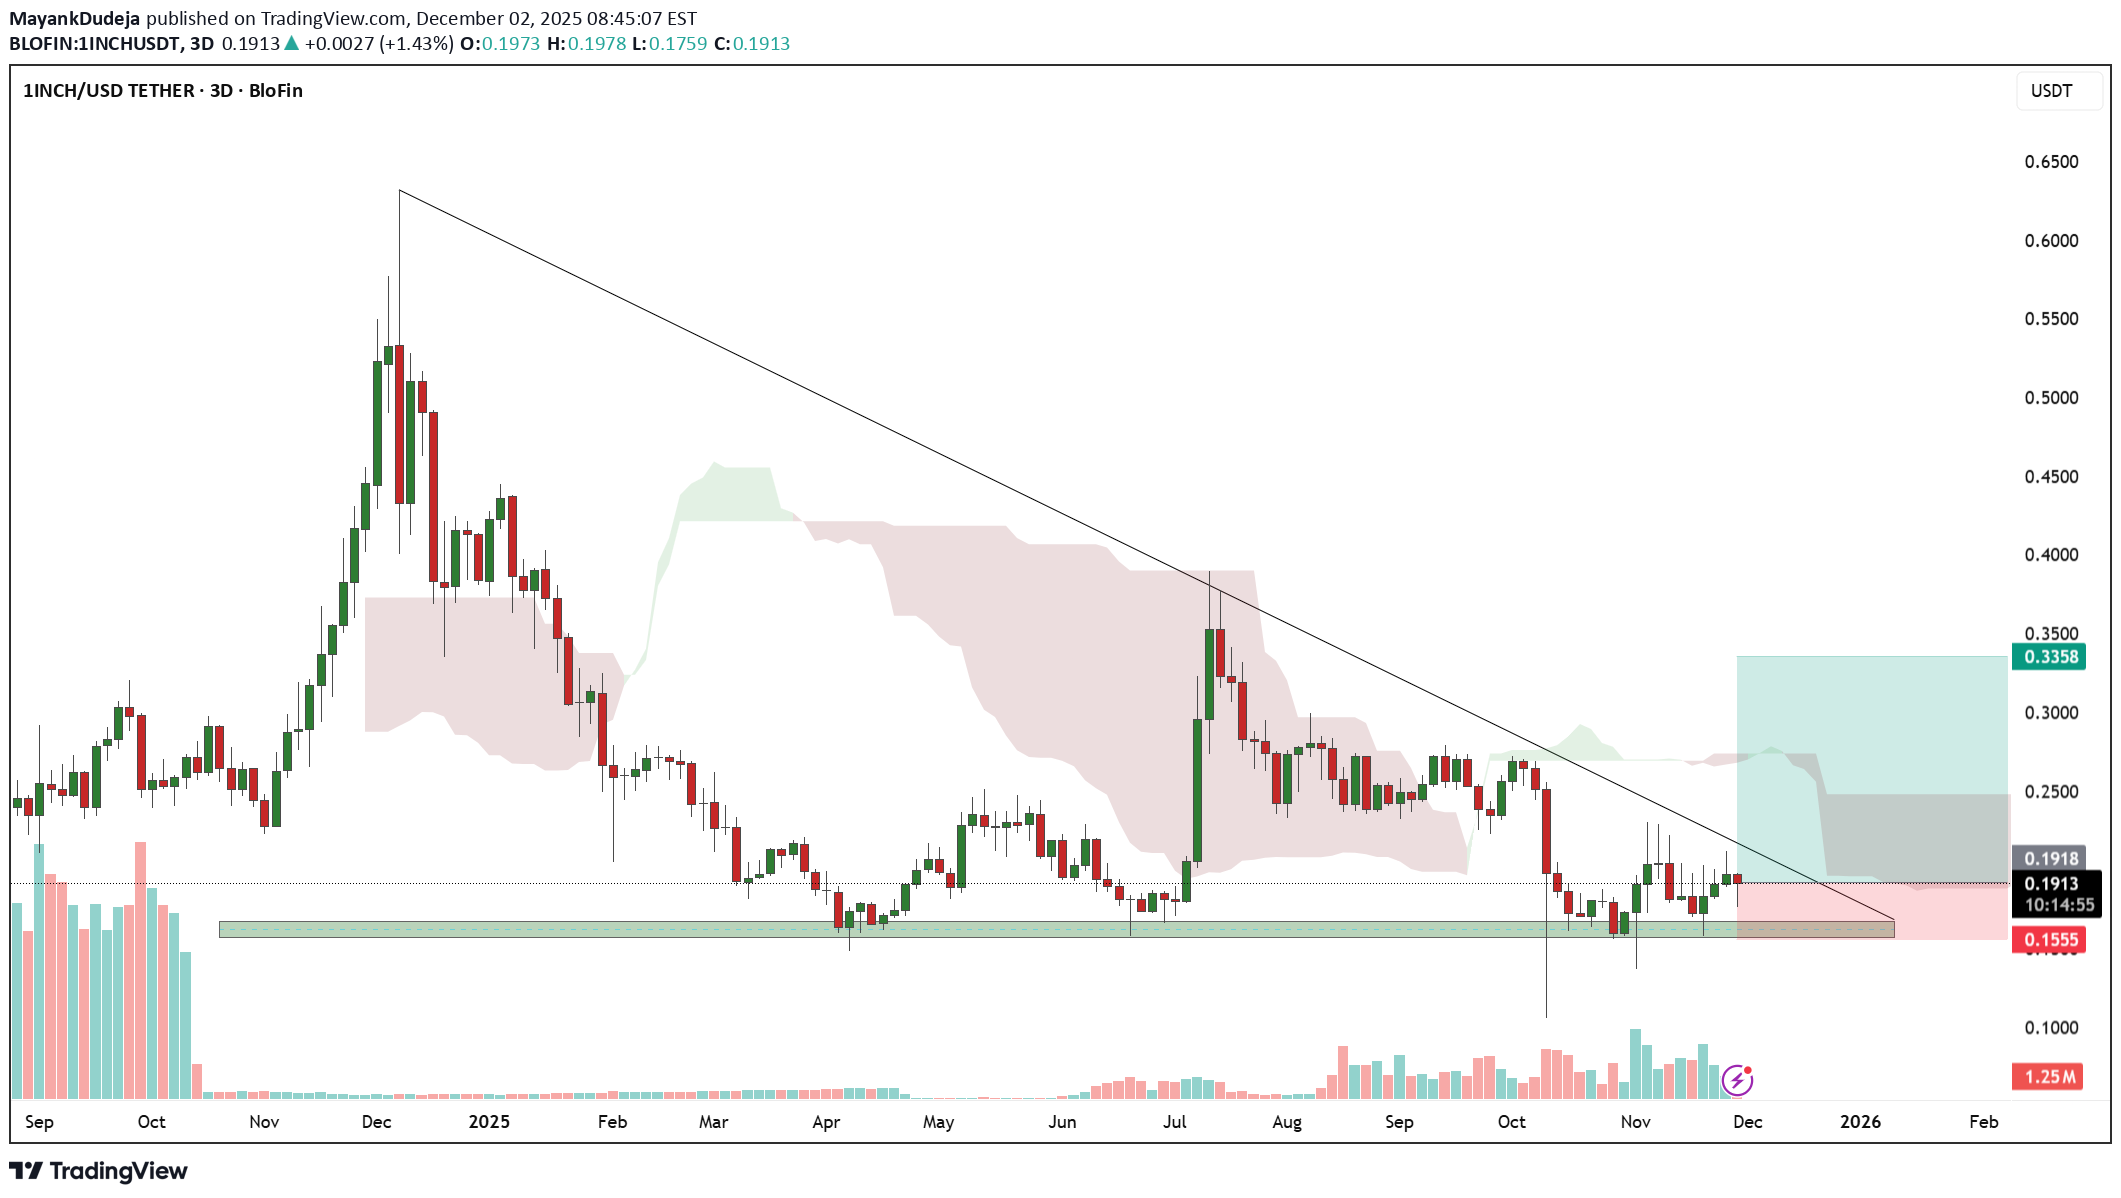
On the 3-day chart of 1INCH/USDT, the price is trading inside a long-term descending triangle pattern, capped by a strong downtrend line from the previous major high near $0.60. The horizontal support zone around $0.16–$0.18 has repeatedly held since early 2025, acting as a major accumulation base. Each dip into this area has been met with buying pressure, shown by long lower wicks and volume spikes, confirming it as a strong demand zone. However, momentum remains weak as the candles are still forming below the Ichimoku cloud, keeping the broader trend bearish. Currently, 1INCH is consolidating near $0.19, facing resistance from the descending trendline and lower edge of the cloud near $0.22–$0.24. A decisive breakout and close above that zone would be the first sign of a potential trend reversal, possibly targeting $0.28–$0.32 in the mid-term. But if the price fails to hold above the $0.16–$0.18 support and breaks down, it could extend lower toward $0.13–$0.14, which is the next major liquidity pocket. Overall, the structure remains bearish-neutral, with accumulation signs at the base but no confirmed reversal until a breakout above the descending trendline.
تحلیل تکنیکال 1INCH/USDT: آیا مثلث نزولی شکسته میشود یا حمایت تاریخی فرو میریزد؟
On the 3-day chart of 1INCH/USDT, the price is trading inside a long-term descending triangle pattern, capped by a strong downtrend line from the previous major high near $0.60. The horizontal support zone around $0.16–$0.18 has repeatedly held since early 2025, acting as a major accumulation base. Each dip into this area has been met with buying pressure, shown by long lower wicks and volume spikes, confirming it as a strong demand zone. However, momentum remains weak as the candles are still forming below the Ichimoku cloud, keeping the broader trend bearish. Currently, 1INCH is consolidating near $0.19, facing resistance from the descending trendline and lower edge of the cloud near $0.22–$0.24. A decisive breakout and close above that zone would be the first sign of a potential trend reversal, possibly targeting $0.28–$0.32 in the mid-term. But if the price fails to hold above the $0.16–$0.18 support and breaks down, it could extend lower toward $0.13–$0.14, which is the next major liquidity pocket. Overall, the structure remains bearish-neutral, with accumulation signs at the base but no confirmed reversal until a breakout above the descending trendline.
1اینچ (1INCH): مسیر صعودی داغ با پتانسیل رشد ۲۰ تا ۴۰ درصدی!

This looks extremely attractive on Valuation and the upside potential after Ethereum Upgrade. We can expect a minimum 20-40% in short term!

تحلیل ۱ اینچ (1INCH): آیا زمان جمعآوری سرمایه است یا در آستانه سقوط؟
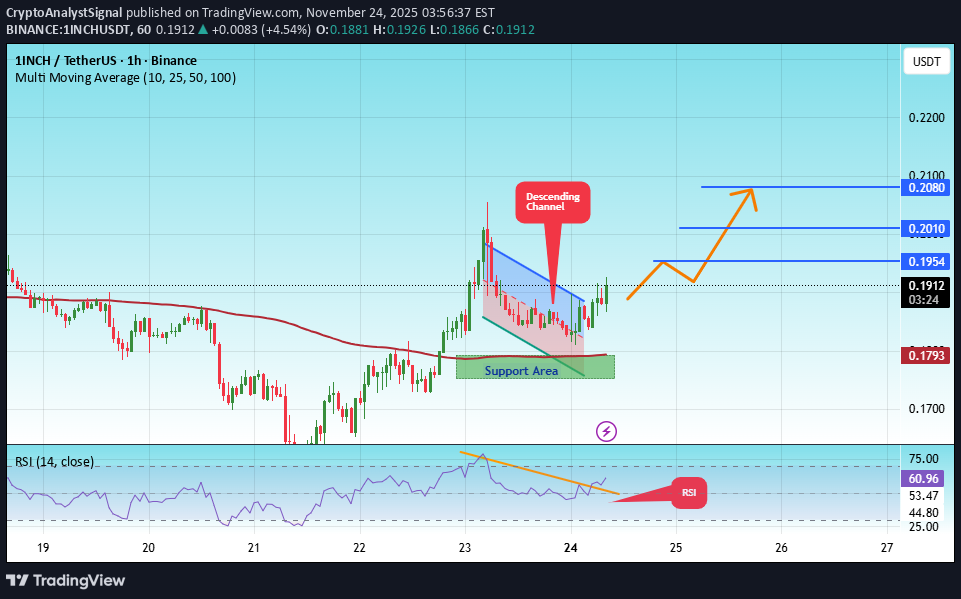
#1INCH The price is moving within an ascending channel on the 1-hour timeframe and is adhering to it well. It is poised to break out strongly and retest the channel. We have a downtrend line on the RSI indicator that is about to break and retest, which supports the upward move. There is a key support zone in green at 0.1770, representing a strong support point. We have a trend of consolidation above the 100-period moving average. Entry price: 0.1909 First target: 0.1954 Second target: 0.2010 Third target: 0.2080 Don't forget a simple money management rule: Place your stop-loss order below the green support zone. Once you reach the first target, save some money and then change your stop-loss order to an entry order. For any questions, please leave a comment. Thank you.#1INCH First target: 0.1954 Reached Second target: 0.2010 Reached

تحلیل روزانه 1INCH: فرصت خرید در کانال نزولی و اهداف هیجانانگیز صعودی!
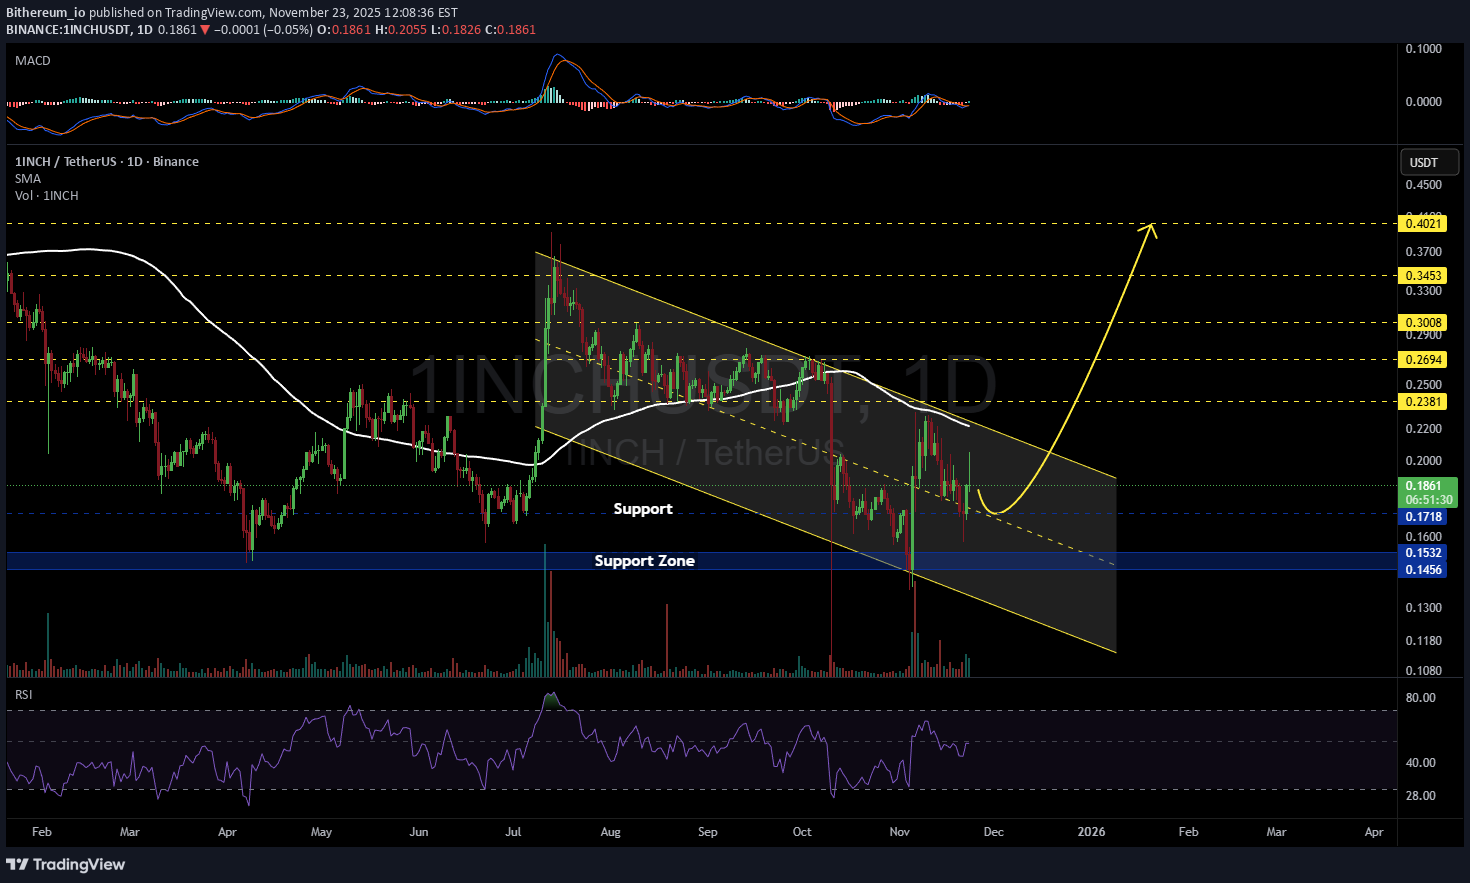
#1INCH is moving inside a descending channel on the daily chart. It is currently trading above the channel’s midline, but there’s a chance it may pull back to retest that midline. Consider buying a small bag here and near the support level at $0.1718, as well as the support zone at $0.1532 ~ $0.1456 in case of a deeper dip, which could happen depending on Bitcoin’s movement tomorrow. If price breaks above both the channel resistance and the daily SMA100, the potential upside targets are: 🎯 $0.2381 🎯 $0.2694 🎯 $0.3008 🎯 $0.3453 🎯 $0.4021 ⚠️ Always use a tight stop-loss and maintain proper risk management.

تحلیل فنی 1INCH: هشدار فروش و اهداف قیمت در تایم فریم 2 ساعته
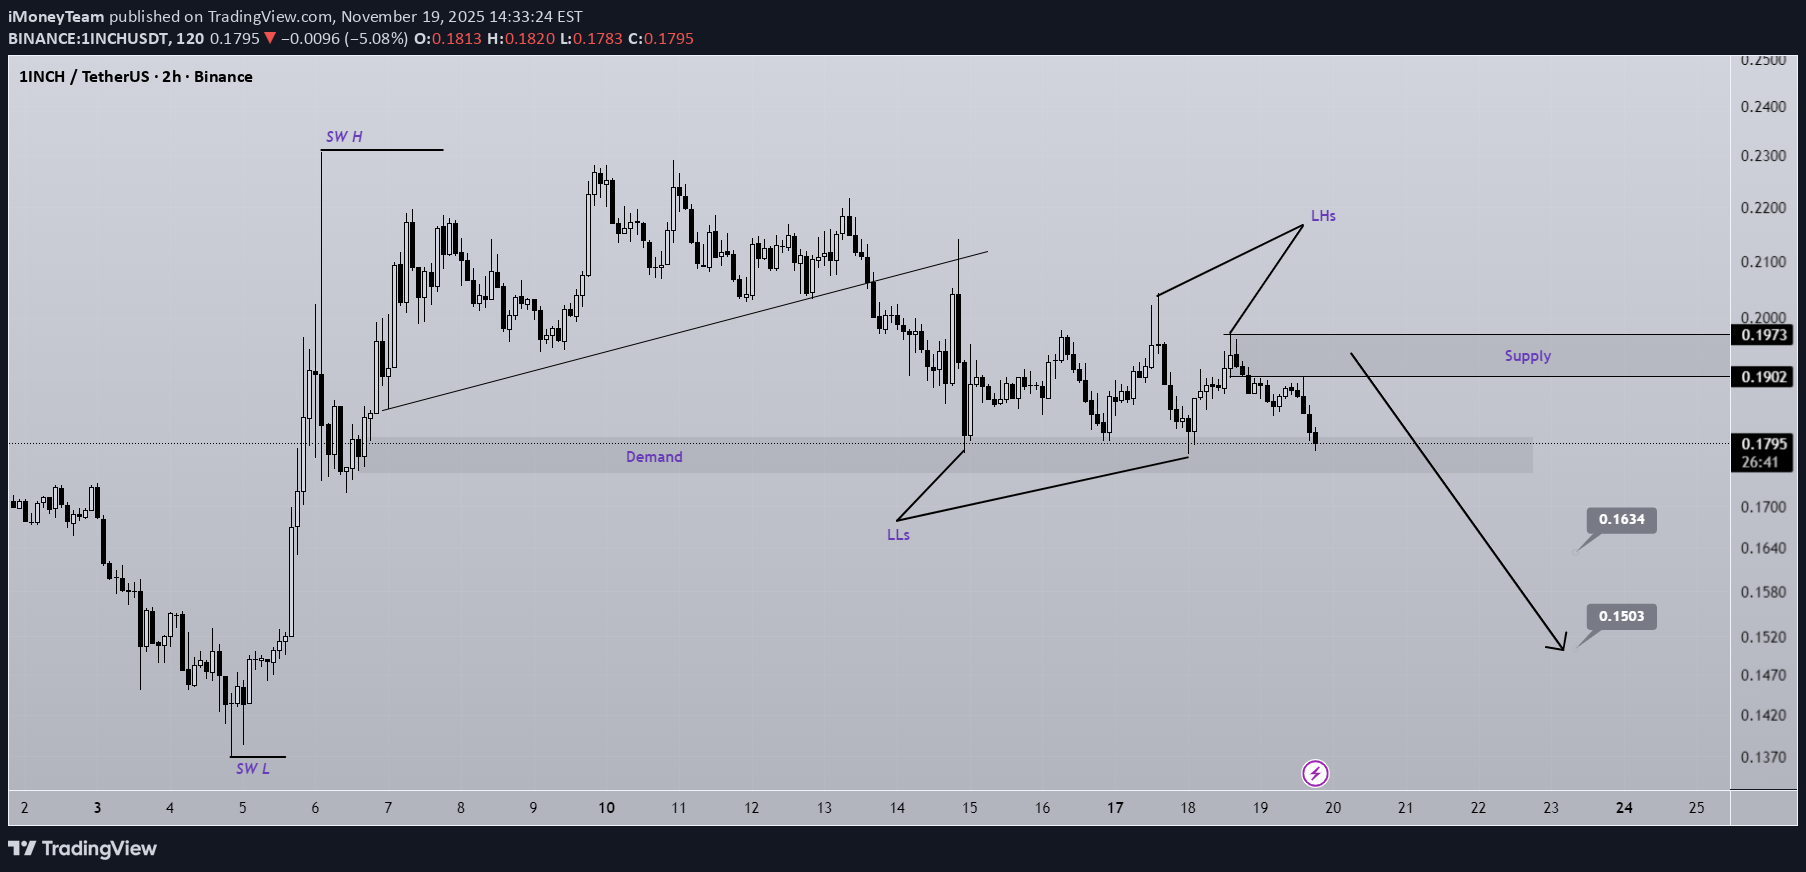
The internal trendline has been broken and the structure is bearish. Below the current price, there is an important support level that has been tested multiple times, and lower highs have formed, indicating selling pressure. The targets are marked on the chart. A daily candle closing above the invalidation level will invalidate this analysis. Do not enter the position without capital management and stop setting Comment if you have any questions thank youThe bearish outlook on 1INCH was correct, and the price dropped more than 14%

تحلیل فوری: آیا $1INCH به زودی سقوط میکند؟ (الگوی سقف دوقلو)
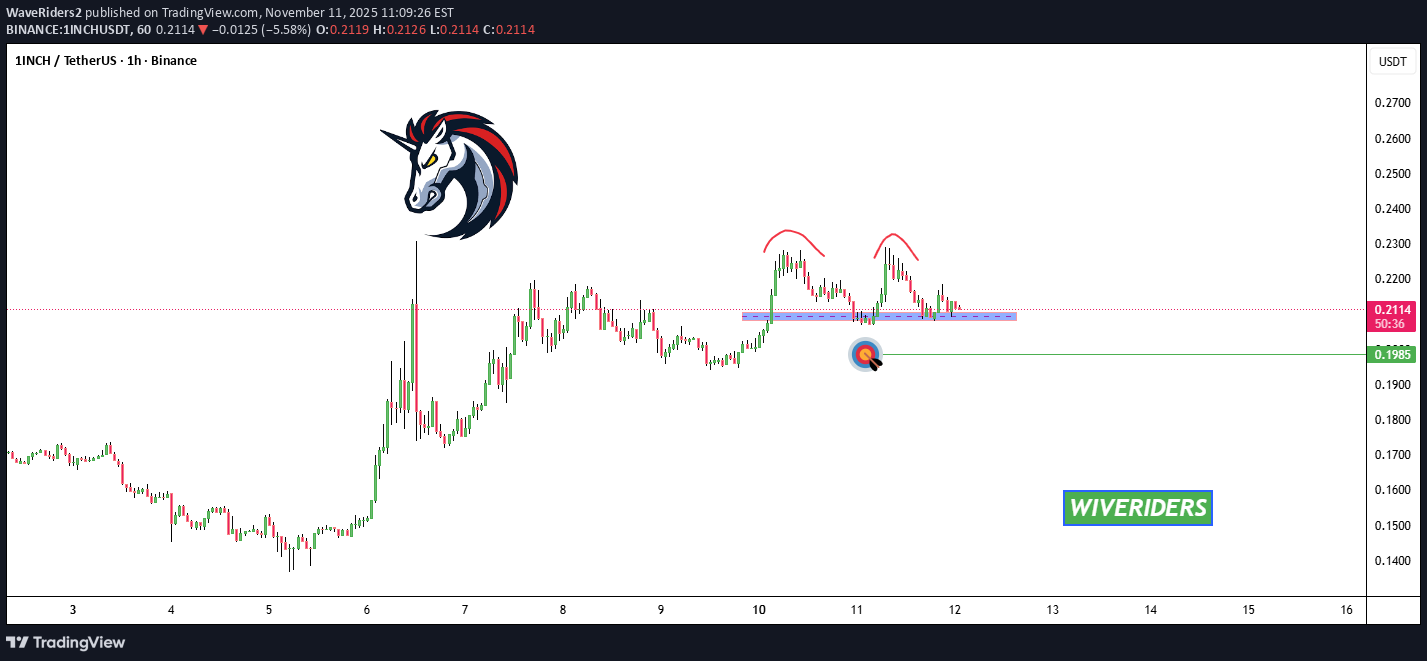
📊 $1INCH Update $1INCH has formed a Double Top pattern 🧠 If price breaks below the 🔵 support zone, it could confirm a bearish setup 📉 Short-term target = 🟢 level 👇
Disclaimer
Any content and materials included in Sahmeto's website and official communication channels are a compilation of personal opinions and analyses and are not binding. They do not constitute any recommendation for buying, selling, entering or exiting the stock market and cryptocurrency market. Also, all news and analyses included in the website and channels are merely republished information from official and unofficial domestic and foreign sources, and it is obvious that users of the said content are responsible for following up and ensuring the authenticity and accuracy of the materials. Therefore, while disclaiming responsibility, it is declared that the responsibility for any decision-making, action, and potential profit and loss in the capital market and cryptocurrency market lies with the trader.