
agatarigan
@t_agatarigan

ما هو الشيء الذي ننصحك بشراءه من المواد الغذائية؟
سابق في الشراء
پیام های تریدر
مرشح
The 3-Method Framework: Simplifying Technical Analysis
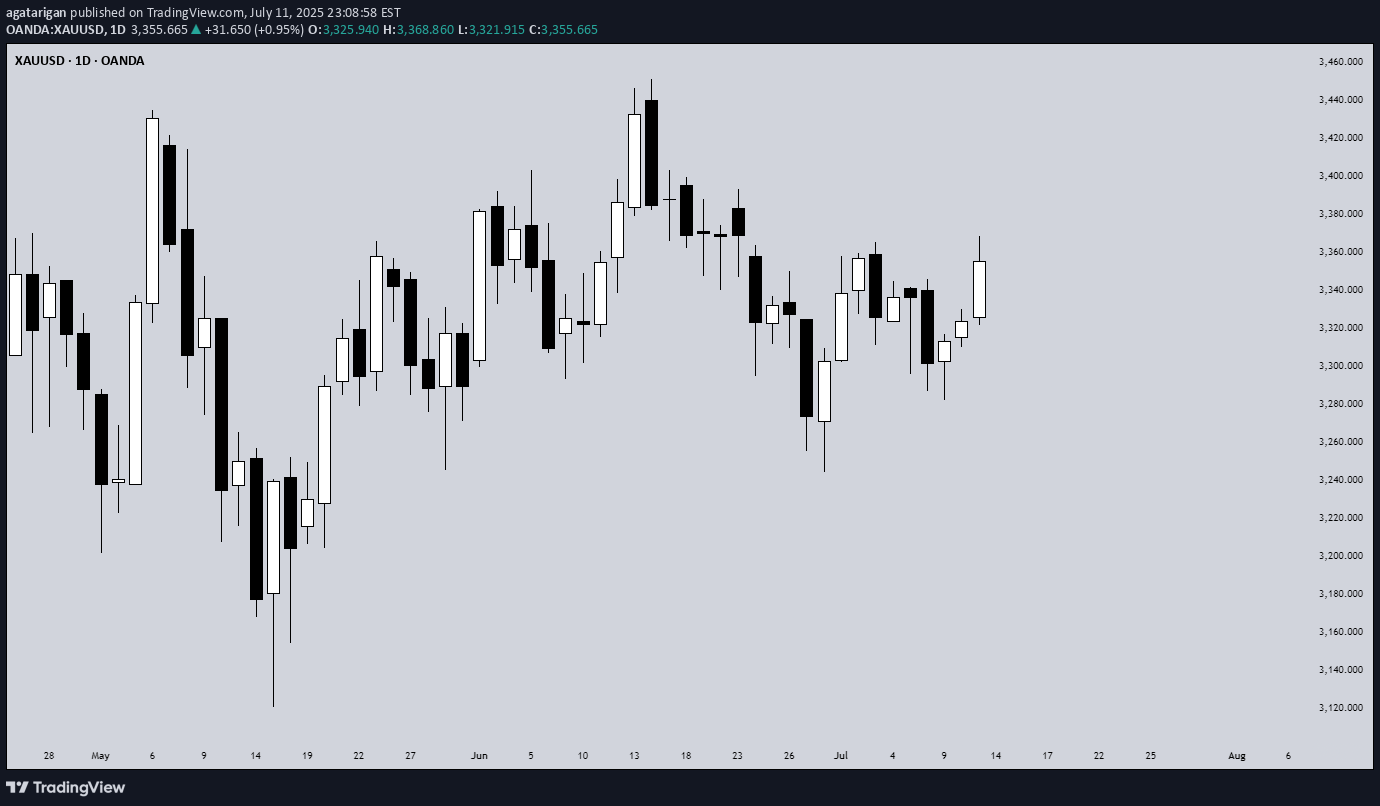
Most traders get caught up in complex indicator setups, thinking that more tools equal better results. We rely on moving averages to tell us if prices are trending up or down, and we depend on support and resistance levels to predict market movement. But what if I told you there's a simpler, more powerful way to read the market using pure price action? Today, I want to share my experience and understanding of bias and expectations for the next candle formation. This approach is refreshingly simple because we don't need to understand every single price movement - we just need to focus on what matters most. Method 1: Opening Price Comparison The first method is beautifully straightforward. For a bullish bias, the current opening price should be above the previous opening price. That's it. Sounds almost too simple, right? But simplicity often holds the greatest power in trading. For Gold yesterday, we simply needed to compare the latest opening price on the Daily timeframe with the previous opening price. It's that simple. Method 2: Mid-Level Analysis The second approach involves comparing mid-levels between candles. We compare the mid-level of the previous candle with the mid-level of the candle before that. I know it might sound a bit complicated when explained this way, but once you visualize it on your chart, the concept becomes crystal clear. Still on Gold, we just compare the 50% or mid-level of the previous candle with the candle two periods back from the latest candle on the daily chart. Method 3: Expansion Expectations The third method helps us anticipate expansion in price. Traditional complex methods require analyzing numerous factors, but this simplified approach only needs two candles before the current one. Here's how it works: we use the high and low of the candle two periods back, and the open and close (body) of the previous candle. If the previous candle's body sits within the high-low range of the two-candle-back formation, we can expect price expansion. The beauty of this method is that we don't care whether the price is bullish or bearish - we simply expect expansion to occur. Think of it like a compressed spring: when price gets squeezed within a previous range, it often seeks to break out in either direction. We're not predicting the direction, just the likelihood of significant movement. Still on Gold, I randomly selected all inside candles on the Daily timeframe. Remember, the purpose is only to expect expansion, not direction. If you want to use this for directional bias, make sure you apply the additional analysis required. Remember, there are no guarantees in trading, but this method provides valuable insight into potential market expansion. Advanced Combinations for Enhanced Analysis Combining Methods 1 and 2 creates our most accessible approach since you only need two candles. When both the opening price and mid-point from two candles ago indicate bullish conditions, we can expect the current candle to follow an OLHC bullish pattern. You can see the 3 examples I've provided in the image, and all of these are applicable across all timeframes, both daily and 4-hour. Combining all three methods offers a more sophisticated analysis, particularly useful for anticipating market reversals. This involves marking the current and previous opening prices, comparing mid-levels from the last two candles, and identifying the high/low range from two to three candles back. Now I'm adding Inside Candles from 2-3 periods back (My personal rule is maximum 3 candles before the current candle, or this analysis will lead to analysis paralysis). The Bullish and Bearish Rules Bullish Rule 1: Opening price above the previous opening price Mid-level of the previous candle above the mid-level of the previous candle before that. Inside candle formation (optional) Bearish Rule 1: Opening price below the previous opening price Mid-level of the previous candle below the mid-level of the previous candle before that. Inside candle formation (optional) The Secret Sauce: Timeframe Harmony Here's where the "devil is in the details" comes into play. You might find perfect bullish conditions on your chart, but the market still reverses. The secret lies in using this method on Daily and 4-hour timeframes simultaneously. Simply understand it from the chart. Simply understand it from the chart. If Rule 1 conditions are met on the daily chart, they must also align on the 4-hour chart. When the 4-hour contradicts the daily, follow the 4-hour signal as it might indicate a "sell on strength" or "buy on weakness" scenario. The formula is simple: [Daily Rule 1] must align with [4-Hour Rule 1] I've never tested this on 1-hour charts because the Daily and 4-hour combination provides sufficient accuracy for my trading approach. Enhanced Rules for Precision Rule 2 makes the inside candle formation mandatory rather than optional. Sometimes you'll encounter mixed signals where the mid-level suggests one direction while the opening price suggests another. The solution? Drop down to a lower timeframe for additional confirmation. I don't recommend using this method below the 4-hour timeframe, but you can certainly apply it to Monthly or Weekly charts for long-term bias determination. The key is analyzing both Daily AND 4-hour timeframes together, not just one or the other. When timeframes conflict, often just one key level provides the confirmation you need - typically a previous Monthly or Weekly high or low. Final Thoughts Pure price action mastery isn't about having the most sophisticated setup or the most indicators on your chart. It's about understanding the fundamental relationship between opening prices, mid-levels, and candle formations across meaningful timeframes. This approach has served me well because it cuts through market noise and focuses on what price is actually telling us. Start with these three methods, practice identifying the patterns, and gradually build your confidence in reading pure price action. Remember, consistent profitability comes from mastering simple, reliable methods rather than chasing complex strategies. Keep practicing, stay disciplined, and let price action guide your trading decisions. Good Luck! :)
Is It Possible to Predict Market Direction with Certainty?

سألنی أحدهم عن التنبؤ بحرکات السوق على وجه الیقین. رداً على سؤال حول اکتشاف الطلبات الکبیرة وتوجیهات التنبؤ فی السوق ، دعونا نستکشف کیف تعمل الأسواق حقًا وکیفیة النمو کمتداول. تتحرک طبیعة أسواق حرکات السوق من خلال السلوک الجماعی ، ولیس الطلبات الفردیة. حتى عندما تظهر مؤشرات المشاعر تقسیمًا تقریبًا 50:50 بین المواقف القصیرة/الطویلة ، لا یزال بإمکان الأسواق الاتجاه بقوة فی اتجاه واحد. لماذا؟ نظرًا لأن حرکة السوق تعتمد على: عدوانیة الطلبات (أوامر السوق مقابل أوامر الحد) توقیت أحجام تنفیذ التجارة وعوامل التوزیع النفسیة التی تؤثر على السلوکیات الجماعیة: تخیل BTCUSD بمشاعر متوازنة على ما یبدو. ومع ذلک ، إذا کانت المناصب الطویلة هی أوامر الحد الأقصى للسلبی فی المقام الأول ، بینما تکون السراویل القصیرة أوامر فی السوق عدوانیة مع توقفات ضیقة ، فقد یتراجع السعر بشکل حاد على الرغم من النسبة "المتوازنة". إن وهم الیقین لیس وسیلة للتنبؤ بتوجیه السوق على وجه الیقین. یشتمل السوق على ملایین المشارکین مع: أسالیب التحلیل المختلفة الأطر الزمنیة (أطراف الرأس للمستثمرین على المدى الطویل) دوافع متنوعة (التحوط ، التکهنات ، الاستثمار) ردود الفعل الفریدة على نفس مثال العالم الإخباری: خلال major أحداث الأخبار مثل اجتماعات FOMC ، أنت غالبًا ما ترى الأسعار تتأرجح بعنف فی کلا الاتجاهین. لماذا؟ لأنه حتى مع نفس المعلومات ، یفسر المتداولون ویتفاعلون بشکل مختلف بناءً على: Portfolio ResireRisk olerancetrading timeframeoverall marketpingpliding أفضل habitsinstead تداول أفضل للبحث عن الیقین ، الترکیز على تطویر عادات تداول جیدة: 1. إدارة المخاطر فی البدایة تحجیم المناسبة (لا تخاطر أکثر من 1-2 ٪ لکل تجارة) توقف بناءً على المستویات التقنیة ، ولیس الأرقام التعسفیة مثال: إذا کان الدعم/المقاومة التداول ، فإن المکان یتوقف إلى ما هو أبعد من المستوى المهم التالی ، ولیس فقط بأرقام مستدیرة 2. عوائد غیر متماثلة للتداولات حیث یتجاوز الربح المحتمل أن الربح المحتمل Losstarget 1: 2 مکافأة المخاطر فی الحد الأدنى من العینة: إذا المخاطرة بمبلغ 100 دولار ، فیجب أن یکون الحد الأدنى للهدف 200 دولار. الاتساق فی الاستراتیجیة - التمسک بخطة التداول الخاصة بک حتى عندما تبدو الاستراتیجیات الأخرى جذابة - توثیق جمیع المهن والمراجعة بانتظام - مثال: احتفظ بمجلة تجاریة مع الإعداد والدخول والخروج والدروس المستفادة 4. بناء habitsstart جید کل یوم مع تحلیل السوق major الأخبار و effect المحتملة قواعد الدخول/الخروج واضحة قبل التداول مراجعة الأداء التداول الجدول الزمنی: - 8:00 صباحًا: نظرة عامة على السوق - 8:30 صباحًا: مراجعة الإعدادات المحتملة - 9:00 صباحًا : تحقق من حدوث أحداث الأخبار-4:00 مساءً: عیوب مراجعة نهایة الیوم لتجنب 1. استراتیجیات Hoppingswitching الإستراتیجیة تعتمد بشکل متکرر على الأداء الحدیثة المتداولین المتعددین مع اتباع نهج مختلف: الالتزام بنهج واحد لمدة 3 أشهر على الأقل 2. یتداول الإفراط فی التداول من الملل أو fomosolution: وضع حدود تجاریة یومیًا/أسبوعیًا 3. Revenge Tradingtrying لاستعادة الخسائر بسرعة: خذ استراحة بعد الخسائر ، راجع ما حدث خطأً: السوق لا یهتم بما ترید. إنه یتحرک على أساس العمل الجماعی ، ولیس الرغبات الفردیة. رکز على التکیف مع ظروف السوق بدلاً من محاولة التنبؤ بها. لا یتم تحدید نجاحک فی التداول من خلال مدى معرفتک ، ولکن من خلال مدى تطبیق ما تعرفه من خلال العادات المتسقة المنضبطة.
Awal Terjunnya Harga Emas atau Awal ATH Baru?

ذکر تحلیلی السابق أن تقدیری کان على السعر XAUUSD هی الزیادة إلى الهدف الأقرب عند 2426,530، ثم إلى High القدیم الذی کسره السعر الآن وأصبح high جدید أو ATH جدید على سعر الذهب. هذه المرة، قدم الذهب مقاومة سعریة قویة جدًا کما أثبت +FVG والذی لا یحترمه السعر ویجعله IFVG. حدث هذا أیضًا فی الفترة من 16 إلى 23 مایو 2024. توقعاتی هی أنه إذا سُئلت "أین سیتجه السعر؟"، فإن إجابتی ستکون عند أقرب هدف. بعد ذلک، إذا قاومت Premium Array السعر وسجل السعر مستوى منخفضًا جدیدًا، فمن المرجح أن تکون أقرب سیولة من جانب البیع هی السعر المستهدف التالی. هدفی الأخیر فی هذا التحلیل هو بیع السیولة والذی یقع فی أسفل الرسم البیانی. إذا قمت بفتح الإطار الزمنی الشهری، فإن سیولة جانب البیع منخفضة من FVG والتی من المحتمل أن یتم استخدامها کمستوى دخول للمؤسسات المالیة الدولیة. من وجهة نظر المؤسسات المالیة الدولیة، وأحدها بنک کریدی أجریکول، فإنه لا یزال هو نفسه کما نقلت فی الفکرة السابقة، ولا یزال الذهب هو المفضل لأن الفورکس لیس فی وضع جید بالنسبة لهم (قد یکون وقت الاحتفاظ بهم أکثر من شهر واحد بسبب الأموال التی لدیهم تصل إلى ملایین الدولارات). الاستنتاج فی هذا التحلیل هو توقع انخفاض الأسعار XAUUSD حتى الهدف الأول عند 2380 (50% من النطاق). لمزید من الانخفاض، مازلت أنتظر ظهور data فی الأیام القلیلة القادمة. شکرًا لک على قراءة الأفکار التی نشرتها، إذا کانت لدیک ada أسئلة، فیرجى طرحها مباشرة فی التعلیقات وآمل أن تکون هذه المعلومات مفیدة لک. 😁 تداول سعید ونتمنى لک التوفیق!
إخلاء المسؤولية
أي محتوى ومواد مدرجة في موقع Sahmeto وقنوات الاتصال الرسمية هي عبارة عن تجميع للآراء والتحليلات الشخصية وغير ملزمة. لا تشكل أي توصية للشراء أو البيع أو الدخول أو الخروج من سوق الأوراق المالية وسوق العملات المشفرة. كما أن جميع الأخبار والتحليلات المدرجة في الموقع والقنوات هي مجرد معلومات منشورة من مصادر رسمية وغير رسمية محلية وأجنبية، ومن الواضح أن مستخدمي المحتوى المذكور مسؤولون عن متابعة وضمان أصالة ودقة المواد. لذلك، مع إخلاء المسؤولية، يُعلن أن المسؤولية عن أي اتخاذ قرار وإجراء وأي ربح وخسارة محتملة في سوق رأس المال وسوق العملات المشفرة تقع على عاتق المتداول.