
SmartMoneyDayTrading
@t_SmartMoneyDayTrading

ما هو الشيء الذي ننصحك بشراءه من المواد الغذائية؟
سابق في الشراء
پیام های تریدر
مرشح
نوع الإشارة
SmartMoneyDayTrading
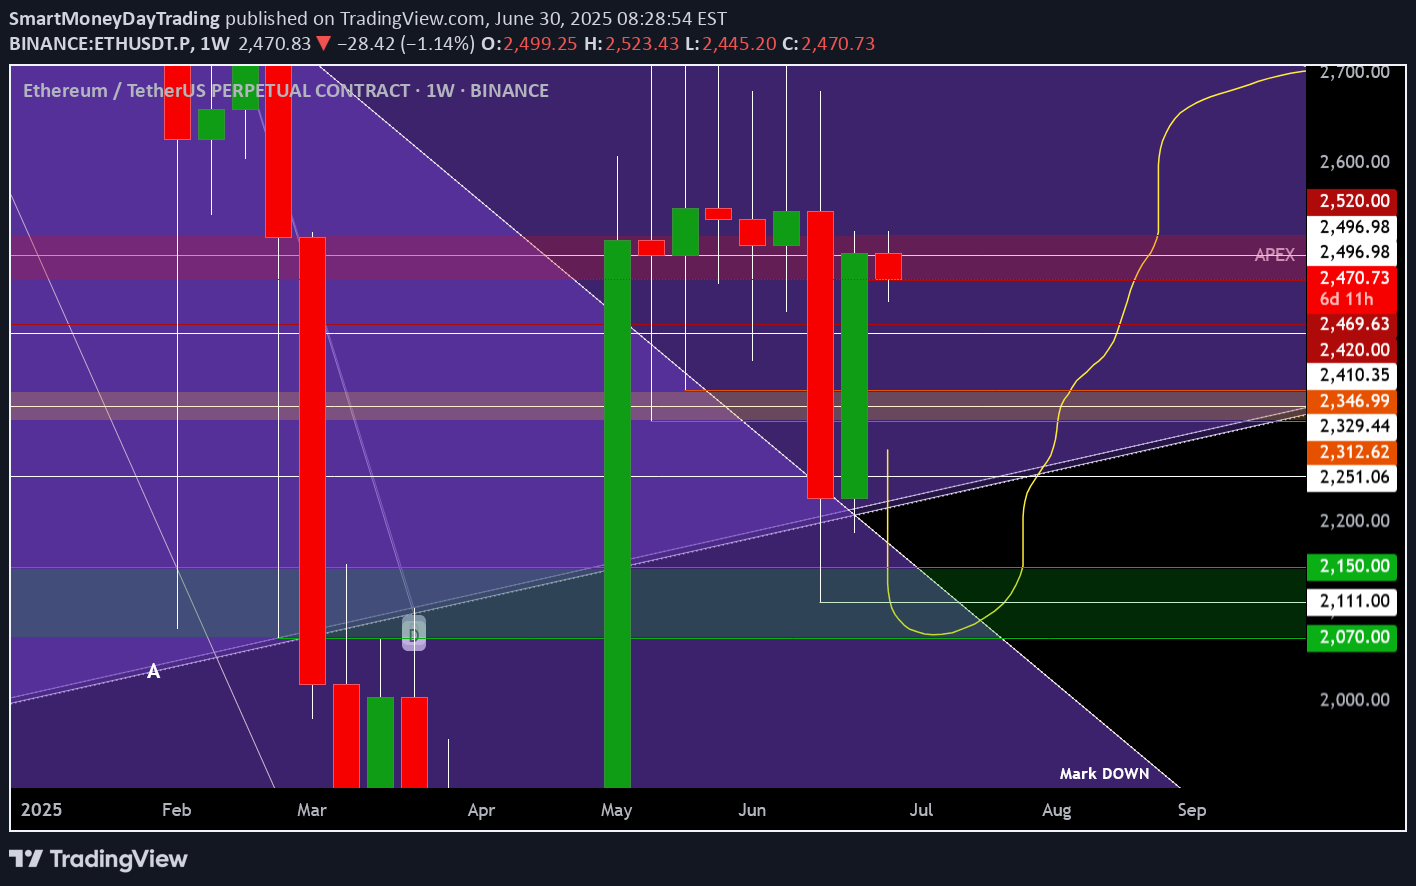
عندما تفشل الإدانة: رفض Apex ، وإعادة التوزیع الخفی ، ووهم صباح الطلب ، صباح الخیر ، مساء الخیر ، أینما کنت تنقر. الآن ، کما هو الحال دائمًا ، أنا لست هنا لأضیع وقتک مع الوفل غیر الضروری. دعنا نذهب مباشرة إلى ذلک ونفصل عن هذه الفوضى خطوة بخطوة. رفض القمة | أکثر من مجرد ویکسو یلتقط من تحدیث الأسبوع الماضی ، نجد أنفسنا فی مفترق الطرق ، ولیس من النوع الرومانسی أیضًا. ما ننظر إلیه الآن حتى الآن ، هو رفض نظیف ولکنه قاطع بنسبة 100 ٪ من قمة بنیة الماکرو الرئیسیة. هذا لیس مجرد مستوى. هذا هو تقاطع الزخم الرأسی والذاکرة الأفقیة ، قمة المثلث الذی یتکون لعدة أشهر. هذا هو المکان الذی کان من المفترض أن یحمل فیه النیة الصعودیة ، من المفترض أن تؤکد الهیمنة ، ولکن بدلاً من ذلک ، ماذا حصلنا؟ دفعة قویة إلى المقاومة ، وفشل فی الإصلاح فوقها ، تلیها الإرهاق وعلامات التفریغ المؤسسی. الآن ، للعین غیر المدربة ، قد یبدو هذا بمثابة تراجع ، أو حتى تصحیح صحی. لکننا لسنا هنا للنظر فی المخططات مع نظارات التجزئة. نحن هنا لتتبع النیة الحقیقیة وراء حرکة السعر ، وإذا کنت تعرف مخططاتک ، فهذا یصرخ إعادة التوزیع. ولیس فقط أی إعادة توزیع ، النوع الذی یحدث قبل أن یغیر السوق شخصیته. أین نحن فی التخطیطی؟ إذا تراکب منطق Wyckoff أعلى هذا الهیکل ، فمن الواضح جدًا: لقد حصلنا على الدعم الأولی الخاص بنا. تلیها الربیع ، وهز ، وحاشیة مزیفة. الآن نحن نرقص حول ما یبدو أنه UTAD (UPTHRUST بعد التوزیع) - ولکن أضعف. هذا لیس توزیعًا کلاسیکیًا ، فهو إعادة توزیع ملثمین فی تشویش الماکرو. فی هنا ، هذا النطاق لیس مجرد توحید الأسعار ، إنه تکییف سلوکی. تم تصمیم هذه الحرکة الجانبیة الطویلة المتقلبة لتبدید کل من الثیران والدببة ، مما یجعلها تشکک فی تحیزهم ، وسوءان مخاطرهم ، وإما تجاوز أو الخروج فی وقت مبکر جدًا. السوق منهجی ولیس عشوائیًا. هذه الشموع لیست حوادث ، فهی أقدام من إعدادات فخ الخوارزمیة ، والآن ، یبدو أن الشبکة على وشک الإغلاق. یحکی المجلد حقیقة لا تنسى المجلد. انظر إلى الحجم الأسبوعی من خلال هذه الدفعة الأخیرة: تقلیل حجم المسیرات ، والحجم الأعلى على الإغلاق red ، والارتفاع المتعدد الذی فشلت فی حمل المقاومة السابقة. لا تحتاج إلى أن تکون معالجًا ، فقط اتبع القرائن. یتم دفع السعر ، ولیس رفع. لا یتدخل الطلب ، ویتم إزالة السیولة. هذا لیس تراکمًا ذکیًا من الأموال ، إذا تم تأکیده فی نهایة هذا الأسبوع ، فإن هذه الأکیاس الأخیرة التی تقوم بها أکیان الأزیاء الذکیة تفریغ الأموال الذکیة ، بهدوء وکفاءة. إن التخفیضات هی الآن معالجة الفیل فی الغرفة فی الغرفة ، حیث کان النطاق المنخفض والنقطة C من المثلث فی 4H.That حیث یجلس السیولة. وما لم یتحول شیء مهم ، فإن الخطوة المنطقیة التالیة هی اکتساح هذه النقطة ، وإخراج الدعم العاطفی ، إما: الاستفادة من الطلب الحقیقی (إذا کان موجودًا) ، أو ابدأ التتالی نحو مناطق الطلب الخضراء النهائیة بین 2150 و 2،070 ، والتی وضعنا علامة علیها قبل أسابیع. یمکن أن نحصل على ترتد مزیف فی منتصف المدى-وهو ما یکفی للطعم فی مزید من الطول ، فقط للالتفاف مرة أخرى. الطبقة النفسیة ما یحدث هنا لیست مجرد تقنیة ، إنها الحرب العاطفیة. کان هذا النطاق بأکمله مصباح غاز طویل للمتداول المتوسط. بین الانهیار الفاشل ، والتعثرات الفاشلة ، والسلوک الفوضوی خلال الیوم ، تحولت البیع بالتجزئة إلى سیولة. وإذا کنت لا تزال تحاول بشکل أعمى فی الجزء العلوی من هذا ، على أمل الحصول على 3K ETH بدون بنیة مؤکدة ، ثم باحترام ، فأنت محترم الآن. تم ضبطها القصیر والمتوسط والطویل الأجل-سأبقی flow متماسک ومنظم وعدوانی. لا زغب. لا الهوبوم. مجرد هیکل وعلم النفس والتنفیذ.
SmartMoneyDayTrading
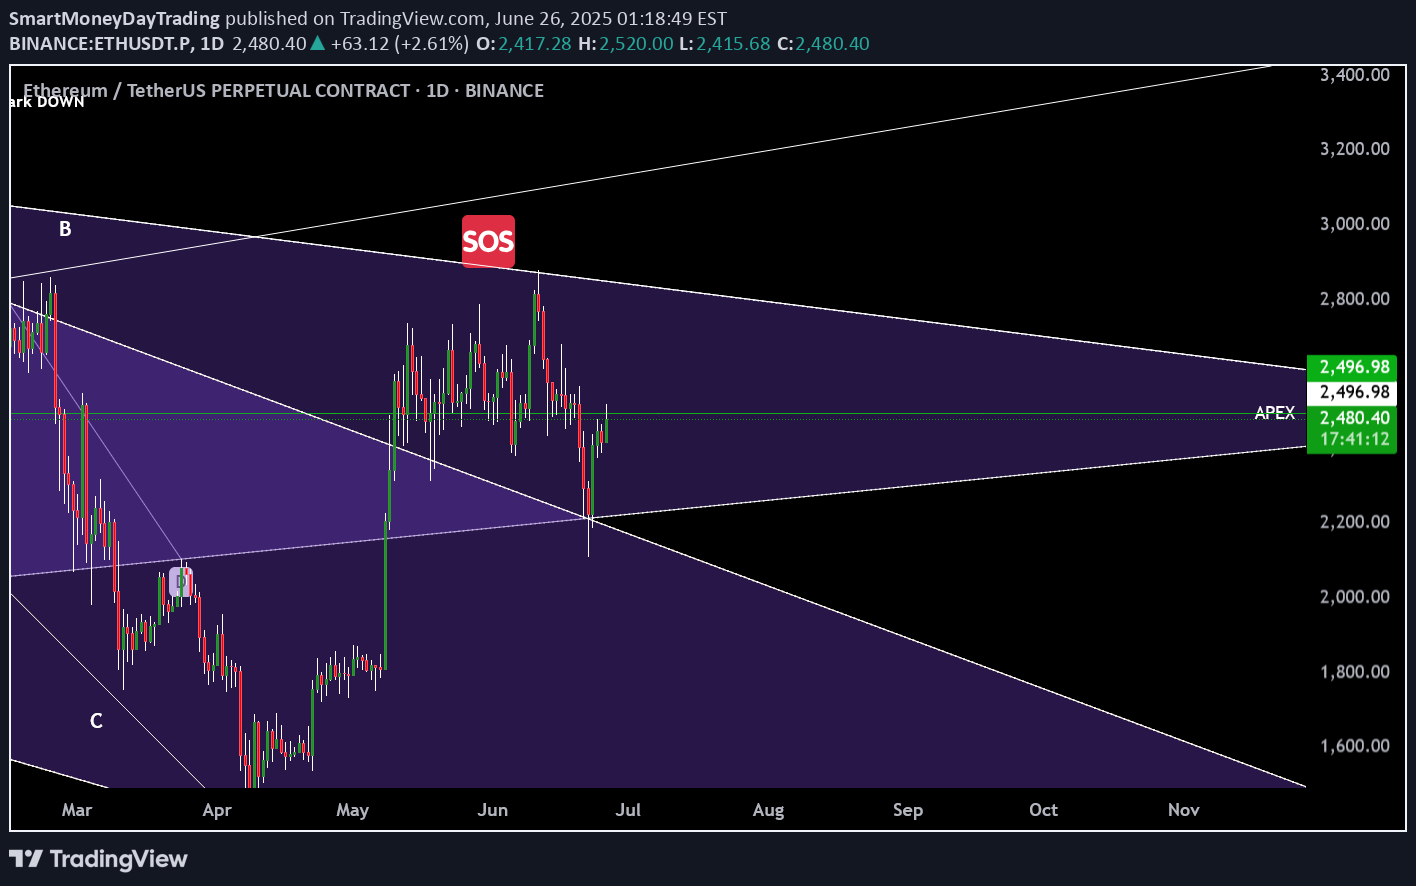
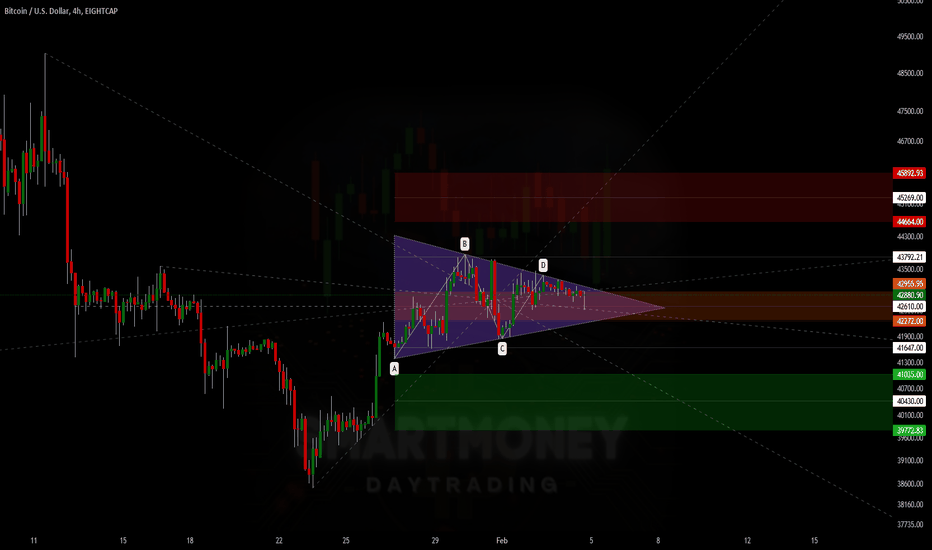
In just four days, ETH has impressively climbed 19.37%, achieving a substantial trading volume of 34.9 million, indicative of both renewed interest and heightened speculative activity. This sharp move follows two intensely impulsive trading days that thrust price upwards aggressively, followed immediately by two days of intermittent volatility and macro consolidation—perfectly manifesting the anticipated Bart Simpson pattern previously identified and traded with clinical precision. Our initial boundary of the macro distribution zone at 2470 marked a critical juncture. ETH faced vehement rejection here, forming a violent wick as price sharply retraced, providing us with the ideal entry for our hedge short. This level—keenly highlighted in prior analyses—initiated a cascade of rapid selling pressure, driving price down with impressive velocity and ferocity directly into the pre-established supply zone. This pullback validated our short, subsequently propelling price downward into demand territory at approximately 2380, where immediate liquidity absorption occurred, confirming demand strength. Notably, ETH’s rapid recovery during the early Asian session surged back towards the optimal trade entry (OTE) region of the redistribution zone, affirming both market efficiency and the dynamic liquidity interplay present. This cyclical behavior reinforces the significance of clearly defined supply and demand zones, which have acted as robust reference points throughout this trading period. At this juncture, ETH finds itself at a critical crossroad—a profound decision point characterized by considerable uncertainty. Three distinct scenarios now dominate trader psychology and technical rationale: Liquidity Hunt Scenario: ETH could swiftly retrace to retest the mean, specifically targeting liquidity pools located near the spring wick from the latest impulse. Such a move would serve to shake out weak longs and solidify the market structure before another upward thrust. Continuation Scenario: A bullish advance could propel ETH towards testing the upper boundary of the overarching macro symmetrical triangle, aligning with continued momentum and suggesting further bullish intent supported by current oscillatory readings. Worst-Case Scenario (LL Scenario): The alternative, more extreme scenario involves ETH breaching structural integrity, aggressively flushing out late entrants with a sharp lower low (LL). While perceived as unlikely given recent volume and market resilience, this outcome cannot be discounted—particularly given global macroeconomic uncertainty and geopolitical tensions. Several exogenous factors compound this uncertainty, most notably ongoing international conflicts and recent market sensitivities tied to off-the-cuff comments from influential figures such as former President Donald Trump. These events amplify volatility potential, exerting tangible influence upon investor sentiment and market positioning. Analyzing the market structurally, ETH price action is now interacting directly at the apex of the current triangle structure, precisely aligning with the 50% Fibonacci retracement of the recent range—a pivotal area frequently respected by both algorithmic and discretionary traders. Complementing this technical view, oscillators such as the Relative Strength Index (RSI) currently hold a neutral stance at exactly 50%, highlighting equilibrium in buying and selling pressure and reinforcing the indecisive nature of the current market environment. However, adding weight to bullish sentiment in the near term, the Commodity Channel Index (CCI) presently indicates upward momentum, suggesting possible further upside if sustained during today's London and subsequent New York sessions. Consequently, immediate trading decisions should remain sensitive to intraday price behavior around these critical junctures. If you've closely tracked my analyses—especially the detailed insights shared in the recent macro Bart Simpson formation update—you'll likely have secured the short precisely at the 2503 rejection point, efficiently hedging against any potential drawdown from open long positions established lower down. This strategy exemplifies disciplined trading, strategically balancing risk and reward, capitalizing on clearly defined market structures and critical levels. Summarizing the current state of play with utmost clarity, ETH stands delicately poised between bullish confirmation and bearish capitulation. Intraday sessions in the coming hours, notably London open and subsequently New York open, are expected to provide the decisive directional impulse. Traders should actively monitor price response at these critical levels, maintaining protective hedges where necessary while remaining flexible and adaptive to emerging market dynamics. In conclusion, ETH’s immediate trajectory hinges upon nuanced market reactions at this strategically significant confluence point. Stay vigilant, as ETH approaches a potentially transformative decision—one offering both substantial opportunity and considerable risk, contingent upon disciplined execution and strategic clarity in your trading approach.
SmartMoneyDayTrading
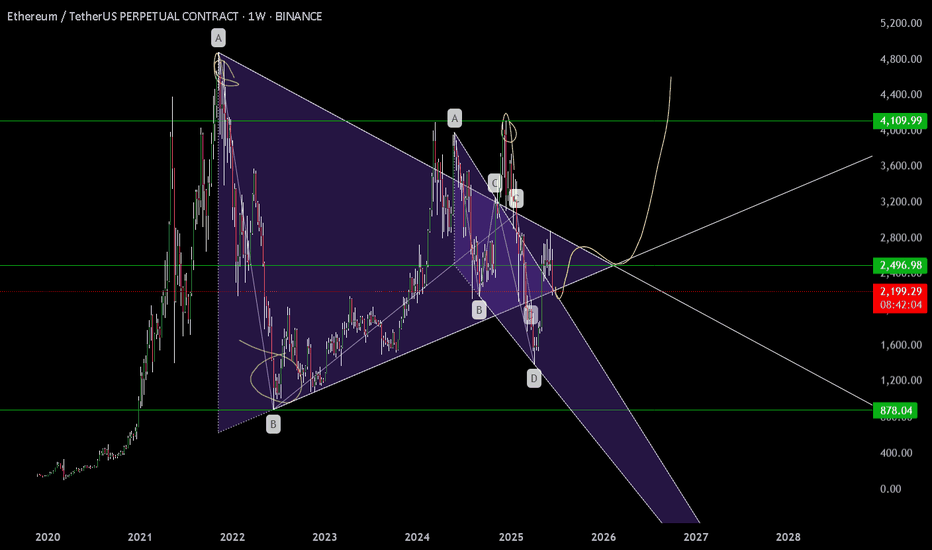
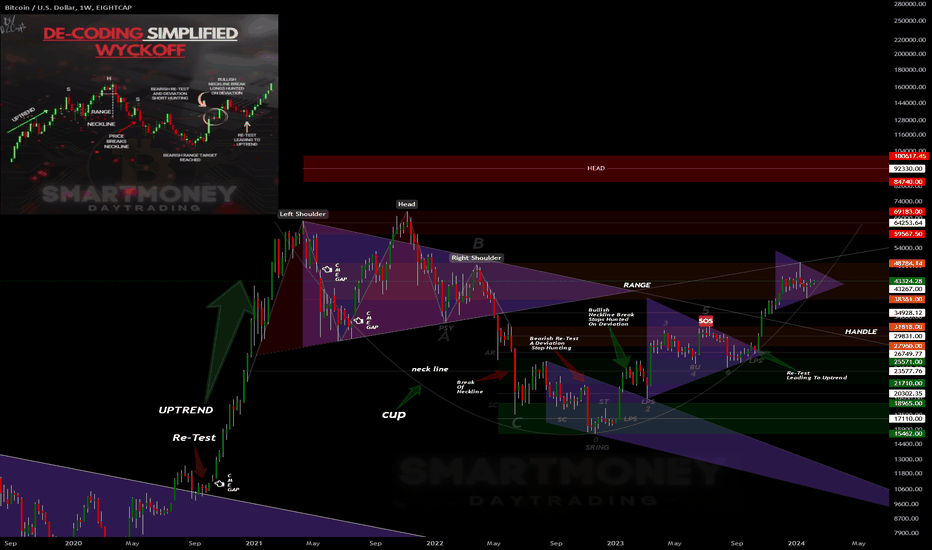
This is my full Ethereum weekly chart analysis — not just what I think might happen, but a walk-through of everything I’ve mapped and labelled, based on how price has behaved since the 2021 top. Every structure you see here is there for a reason — from the symmetrical triangle and wedge, to the Wyckoff schematics, Elliott wave flow, Spring, and more. What we’re seeing now, in my opinion, is the end of a three-year macro compression. The move that follows could define the rest of this cycle. Let me take you through it. After the all-time high in late 2021, Ethereum entered a structured, controlled decline. Not a crash — but a step-by-step transition through market phases. Price dropped and bottomed into a clear accumulation phase — that’s the first box on this chart, labelled as “Accumulation (cause)”. This is where smart money started taking positions, confirmed by the Spring down to 0 and the base of the move at point 2. From there, price consolidated, gained strength, and then jumped the creek — a clear breakout above the accumulation range, which gave us the confirmation for markup. The markup phase took us from that Spring up into a five-wave impulsive move, peaking around the distribution zone. You can see it clearly — labelled Distribution, and boxed off between points A, B, C and the final wave 5. This rally failed to make new all-time highs, stalled, and was rejected cleanly. From there, we rolled over and started losing structure — and this is where it gets important. Right after distribution, we got a breakdown I’ve labelled “Break The Ice”. This wasn’t just another dip. It was the moment we lost all structure from the markup — the line that had held the previous lows snapped, and volume stepped in. This is often the first real signal that we’ve entered the markdown phase. From a Wyckoff perspective, this breakdown is what separates Phase D from the start of a new accumulation cycle. It’s aggressive, deliberate, and clears out late longs — and that’s exactly what it did here. Following that breakdown, we formed a new falling wedge — drawn from the top of the markdown all the way to the most recent lows. Price was making lower highs and lower lows, but with less aggression and momentum weakening. This wedge sits inside the larger symmetrical triangle, which has been developing ever since the 2021 top. The apex of this triangle, marked around $2,496, is where I believe everything will come to a head. Break that with conviction — and we could start a whole new macro leg. But before we get there, something happened worth pointing out. That final breakdown inside the wedge? The one that dipped below and quickly reclaimed? That, for me, was the Spring. It’s labelled in yellow as “Spring” under point D. And it matches the Wyckoff schematic almost perfectly. Volume dried up on the move down. RSI and CCI both showed divergence. Then price bounced hard, reclaimed structure, and we’ve held ever since. This doesn’t look like continuation — it looks like a trap. If that Spring holds, then we’re now in the Sign of Strength (SOS) phase. This is the moment where price reclaims its mid-structure levels, consolidates, and prepares for the breakout. We haven’t broken out yet — but the groundwork is in place. My Elliott count also lines up. We had a 5-wave impulse from the Spring to the failed rally, followed by an ABC correction. What we may now be seeing is the completion of another Wave 2, setting up for a possible Wave 3 — the strongest wave of the cycle, if confirmed. Now let’s talk entries. I’ve got my eye on the $2,130–$2,030 region. That’s where I’m placing my DCA bids. It’s the area just above the Spring reclaim zone, where price should react again if we retest. If we lose $1,690, I consider the Spring invalidated and will reassess. That’s my clean risk level. Break and hold above $2,496, and the breakout is confirmed. That level is not just the wedge and triangle resistance — it’s also the psychological midpoint of this whole macro structure. Everything’s mapped. Structure is clean. Volume is drying up. Momentum is shifting. And price is compressing right into the apex. This isn’t a moment to chase. It’s a moment to plan. If we break out, I’m ready to scale in. If we reject, I’ll be watching the DCA zone and the Spring level closely. Either way, I know what I’m looking for — and I know what invalidates the setup. Let’s see what price does next.Following directly on from my previous macro analysis, let's zoom into what's currently happening on the lower timeframe (30-min chart) and see how Ethereum is behaving in real-time, exactly as we anticipated. Previously, I highlighted the critical breakdown below the macro apex around 2,496—what I labelled our "Break the Ice" moment. As expected, price steadily drifted downward into my pre-defined DCA range between 2,130 and 2,100, aligning perfectly with the lower diagonal support of our larger wedge formation. That move formed a textbook Wyckoff Spring: price gently tapped the lows with diminishing volume, while both RSI and CCI clearly displayed bullish divergence—confirming that selling pressure had effectively dried up, and smart money was quietly accumulating positions. Now, let's closely examine the current 30-minute structure shown clearly in today's updated chart: Since confirming our spring at the wedge’s lower boundary, Ethereum swiftly reversed upward and is now in the process of establishing a shorter-term ascending channel—precisely as we would expect following a successful spring event. Notice how price action has developed a clean harmonic structure within this ascending channel. Initially, we saw a smaller bearish wedge formation appear, labelled on the chart as "Failed bear wedge + Bart formation." Importantly, this bearish pattern failed and resolved upwards, indicating short-term bear exhaustion and providing additional confirmation for our bullish perspective. At this moment, Ethereum is consolidating tightly between well-defined supply and demand zones, currently capped just beneath resistance around the 2,430–2,448 area (labelled clearly as "Supply"). Just above this supply zone, we encounter a critical distribution zone extending from approximately 2,471 up to 2,534, which represents our next major challenge. For bullish momentum to persist, ETH needs to firmly hold above the immediate demand zone between roughly 2,349 and 2,374. From there, we want to see Ethereum decisively reclaim and hold above the immediate supply resistance at 2,448. Successfully reclaiming this key area with conviction and increasing volume would negate the bearish "Bart Simpson" consolidation scenario currently forming. Speaking of which—it's important to note that the current consolidation has started shaping into what traders often describe as a "Bart Simpson" pattern: a quick and impulsive upward move, followed by a flat-top consolidation, which sometimes results in an equally rapid reversal downward. This is definitely something we must watch closely. Therefore, for bullish confirmation, ETH must first defend and hold above the immediate demand zone (2,349–2,374), then convincingly break above supply at 2,448. Clearing that resistance would invalidate the potential Bart pattern, instead paving the way towards our distribution area near 2,534. Securing this higher level with robust volume would align beautifully with our broader macro roadmap, opening up a path for Ethereum to revisit and retest the critical apex level at 2,496. On the flip side, should Ethereum fail to hold this consolidation and break downward, validating the bearish Bart Simpson scenario, we might see price retesting lower demand levels—initially around 2,312–2,269. Should price pressure intensify further, a deeper retest towards our previous spring support at 2,226–2,187 could follow. In any case, the original DCA zone (2,130–2,100) remains my primary area of interest, with the macro invalidation clearly defined at the critical support around 1,690. For now, remain closely focused on these immediate short-term levels—particularly the supply resistance at 2,448 and the crucial distribution zone near 2,534—as Ethereum navigates this pivotal range. Despite the current consolidation and Bart formation, the larger picture remains fully intact, and our broader roadmap continues to unfold as expected. Stay patient, remain prepared, and as always, stay tuned.15min ChartWyckoff Logic: Low Volume / Failed Rally Zooming into the lower timeframe, ETH price action now displays the hallmark characteristics of a Low Volume Rally or Failed Rally within the distribution phase. After reaching up into the critical "Distribution" resistance area (around 2,471–2,534), Ethereum began consolidating sideways within a narrow trading range. This tight, flat consolidation mirrors what traders often recognize as a "Bart Simpson" pattern—characterized by rapid upward movement, low-volume sideways action, and potentially quick downward reversals. In simple terms, what we're seeing here is indecision and exhaustion—bullish strength is waning precisely where sellers historically step back in. Short-term Elliott Wave Structure Looking even closer (on the15-minute chart), price structure clearly outlines an ongoing Elliott corrective sequence. After the sharp impulsive drop from recent highs (Wave 1), ETH retraced upwards (Wave 2), rejected sharply, and has now likely completed or is completing Wave 4—right around the crucial Fibonacci resistance zone between 2,446–2,455. This current wave formation further strengthens the bearish bias, suggesting a final Wave 5 downwards to potentially test lower supports near 2,415–2,400. However, caution is needed: if ETH can reclaim and hold above Wave 2's high (approximately 2,458), this would invalidate the bearish Elliott scenario, suggesting bulls are reclaiming short-term control and targeting a push towards 2,496 once more. Key Levels to Watch Bullish scenario (Distribution invalidated): Break and sustain above immediate supply (2,448), and then distribution zone (2,471–2,534) with clear volume. Bearish scenario (Distribution confirmed): A decisive breakdown below immediate demand (2,412–2,374), followed by lower demand support around 2,312–2,269. Confirmation of Wave 5 downwards towards 2,400–2,415 support. Technical Indicators & Momentum RSI and CCI: Initially displayed bullish divergences during the spring, but short-term RSI is now flattening near neutral levels (~60), indicating weakening bullish momentum. Volume: Currently low—typical of consolidation phases—suggesting a lack of conviction from buyers at current prices. These indicators collectively reinforce our scenario of potential distribution and subsequent markdown unless significant bullish strength returns soon. Market Psychology & Logic Psychologically speaking, the current scenario is classic Wyckoff: the market has attracted late bulls who entered near the recent highs. Now price stalls, causing hesitation, doubt, and potential capitulation if selling picks up. This psychological dynamic could soon create a domino effect—accelerating price downward if support levels fail. Trading Strategy & Risk Management My plan remains disciplined: Bullish Invalidation: A clean reclaim above 2,458 would pause bearish setups temporarily, targeting upside resistance at 2,496. Bearish Confirmation: Look for clear rejections at current levels (2,446–2,455), targeting immediate lower support around 2,400–2,415, and deeper targets at 2,312–2,269 if bearish momentum accelerates. Keep stops tight above recent highs to manage risk effectively, ensuring that any invalidation of our bearish thesis results in minimal loss and quick reassessment. ................................................................................................................. Final Thoughts & Next Steps Ethereum stands right at a pivotal juncture: distribution or reaccumulation. The market structure we've carefully mapped out gives us clear boundaries and actionable levels. Now we let price action speak, confirm our bias, and react calmly and professionally. Stay vigilant, patient, and proactive. Updates will follow as we see decisive moves. Stay safe, and trade wisely.
SmartMoneyDayTrading
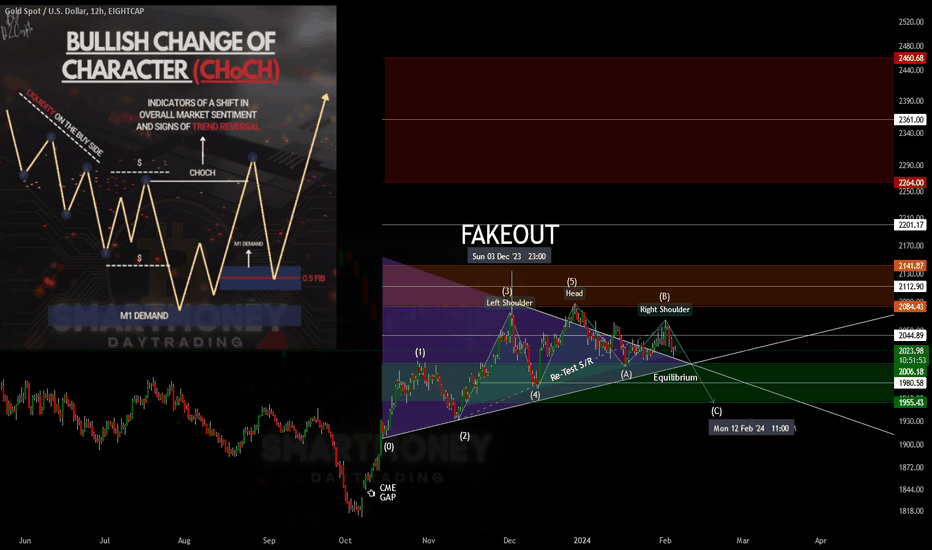
فک تشفیر المعنویات فی السوق من خلال التقنیة الرقص المعقد لقوى السوق ، غالبًا ما یعکس لمعان Gold اللامع التفاصیل الدقیقة للشعور الاقتصادی وسلوک المستثمر. تشیر الأنماط الحدیثة التی لوحظت فی أسواق الذهب ، التی تم تحلیلها من خلال عدسة تقنیة ، إلى تغییر صعود فی الشخصیة (Choch) ، مما یدل على تحول کبیر فی المشاعر وعکس محتمل للاتجاه السائد ، ویوضح الرسم البیانی المصاحب نمطًا متعرجًا حیویًا. یتم تثبیت هذا النمط من خلال منطقة الطلب M1 ، حیث أظهر المشترون تاریخیاً اهتمامًا قویًا ، مما یشیر إلى مستوى أساسی للدعم الصعودی. ومع ذلک ، کتجار ، یجب أن نتعامل مع میل السوق إلى الخداع والبدایات الخاطئة. مفهوم "المزیف" هو شهادة على ذلک ، کما یظهر فی اللقطة إلى الیمین. یمثل هذا المزیف بالذات سردًا للحذر ، وهو تذکیر بأنه حتى مع اقتراب المؤشرات شمالًا ، قد یکون المسار محفوفًا بفواصل خادعة تفشل فی الحفاظ. تتحدث الحرکة التصاعدیة الأخیرة ، التی تتحدى توقعات تأکید أو مزیفة واضحة ، إلى قوة السوق والمیل الأساسی لتقلید المرونة التاریخیة. فی هذه الحالة ، على الرغم من عدم وجود إشارة نهائیة ، فقد ارتفعت أسعار الذهب إلى الأعلى ، کما هو متوقع من قبل خبراء السوق المتمرس. فی ظل "GAP CME" ، نلاحظ فراغ الأسعار الذی یمکن أن یکون بمثابة محفز محتمل لحرکات الأسعار المستقبلیة. تمثل الفجوة مساحة ذات أسعار غیر مملوءة ، مما یؤدی غالبًا إلى تأثیر مغناطیسی یعید الأسعار لملء الفراغ. تشیر هذه الظاهرة ، إلى جانب إعادة اختبار التوازن الذی تم وضع علامة علیه کنقطة (أ) على الرسم البیانی ، إلى أن السوق مستعدة على أعتاب التوازن ، والبحث عن القرار. إن مراحل التراکم والتوزیع ، والتحلیل النقدی للعرض والطلب ، ودوریة حرکات السوق ذات صلة بسوق الذهب کما هی الحال فی أی أصول مالیة. ونحن ننظر إلى الکرة البلوریة للمخطط ، ویبدو أن سوق الذهب هو نصوصه الخاصة بالتعافی والانتعاش. یشیر المسار الصعودی الأخیر ، الذی لم یؤکده الانهیار التقلیدی ، إلى سوق یحتضن طریقه من خلال غابة الکثافة من التأثیرات الاقتصادیة والجغرافیة. للتنقل فی هذه الرحلة الذهبیة ، یجب على التجار تسلیح أنفسهم بالحیویة وفهم عمیق لعلم النفس فی السوق. تعمل الذاکرة التاریخیة لـ Gold کدلیل ، بوصلة من نوع ما ، تقود المستثمر الذکی من خلال متاهة حرکات السوق نحو الربحیة المحتملة. إن سرد الذهب بعیدًا عن الخطی ؛ إنه saga یتخلله التحولات والمنعطفات ، والتوزیعات ، وإعادة التنظیم. ونحن نشهد على أحدث فصل له ، فإن همسات السوق تلمیحات
SmartMoneyDayTrading
The Wyckoff Method, developed in the early 20th century by Richard Demille Wyckoff (1873–1934), a pioneering figure in technical analysis, which is still widely used and resonates within markets today. This comprehensive approach to trading is based on the relationship between supply and demand. Wyckoff's interest in the stock market materialized at the age of only 15 when he became a stock runner, thriving in the fast-paced, exuberant environment of the trading floor he came to love. Over the years, Wyckoff had the opportunity to observe the market and strategically study the strategies of the most successful traders of his time, notably Jesse Livermore and James R. Keene. With the finest attention to detail, these methodical extensive observations led Wyckoff to conclude that markets, no matter how old or liquid, are primarily governed by the laws of supply and demand. It was, in fact, large institutions and the monetary systems that underscored them that often influenced the markets. Believing that retail traders could identify the direction of market trends also, Wyckoff then set out on his next quest of understanding the market operations of these 'Composite Operators', a term he forged to describe the big players. Wyckoff believed that market behaviour could be predicted with a reasonable degree of accuracy by recognizing regular patterns. His method focuses on identifying the intentions of large institutional players, or "SmartMoney," and traded in harmony with them rather than the varied and numerous market participants. In 1907, Wyckoff founded "The Magazine of Wall Street," which gave him access to insights from many of the greatest traders of his day and further enriched his understanding of market dynamics. He also established a brokerage firm and later an educational institution, the Stock Market Institute, to teach his methods. There are 5 Stages or Steps that complete the Wyckoff Method: The Three Fundamental Laws. Market Cycles. Identification of Phases. Wykoff's Price Volume Analysis. Trading Ranges. 1. The Three Fundamental Laws: A) The Law of Supply and Demand governs price direction: Excess demand over supply propels prices upwards, whereas excess supply over demand drives prices downwards. B) The Law of Cause and Effect: Central to forecasting the potential range of price movements, the 'cause' is quantified by the horizontal point count within a trading range. The 'effect' is the extent of the price movement aligned with the period of either accumulation or distribution. C) The Law of Effort vs Result: A comparative analysis between the volume (effort) and the resulting price movement (result). This law declares that volume should confirm the price trend. Discrepancies between effort and result often signify a forthcoming shift in trend. 2. Market Cycles: The Wyckoff Method encapsulates the market's rhythm in a cyclical model. The model consists of four sequential stages: Accumulation, Markup, Distribution, and Markdown. A)- Accumulation: This stage is characterized by significant buying from large operators, who absorb available supply in anticipation of an upcoming bull market. B)- Markup: Post-accumulation, the ensuing demand drives the price upward. C)- Distribution: Following a sustained markup, the market witnesses distribution as large operators offload their coins (crypto) to the public, tipping the scales towards an excess supply. D)- Markdown: In this phase, prices weaken as the previously dominant demand is now overwhelmed by supply. 3. Identification of Phases: Wyckoff's method outlines distinct phases within the accumulation and distribution cycles to assist traders in determining the coin's (crypto) accumulation or distribution periods. Accumulation Phases: - PS (Preliminary Support): this is the phase where the selling pressure diminishes. - SC (Selling Climax): this phase is characterized by peak levels of panic selling. ST (Secondary Test): this phase Tests the newfound level of demand. SOS (Sign of Strength): Indicates a potent upward movement, suggesting the potential for higher prices. Distribution Phases: PL (Preliminary Supply): this phase is Where the initial signs of declining buying pressure emerge. BC (Buying Climax): this phase Represents the pinnacle of buying enthusiasm. AR (Automatic Reaction): this phase Represents The ensuing price decline post-buying exhaustion. ST (Secondary Test): this phase Assesses the established supply level. UT (Upthrust): This phase Characterizes a sign of market weakness, a potentially telltale sign of a forthcoming decrease in pricing. 4. Wyckoff's Price Volume Analysis: An essential tool in the Wyckoff Method is price and volume analysis. Wyckoff analysts look for price-volume convergence and divergence to understand the strength of a trend. They also look for specific patterns such as 'Springs' and 'Upthrusts', which are considered traps that go against the prevailing trend and indicate a potential reversal. 5. Trading Ranges: Wyckoff places considerable emphasis on trading ranges, perceiving them as critical phases of equilibrium where supply and demand find a balance. Breakouts from these ranges signal the onset of a new trend, whereas breakdowns typically indicate reversals. SmartMoneyDayTrading©️
SmartMoneyDayTrading
تداول مثلث متماثل مع نظام إشارة المرور: تحدید وتداول المزیفین ، وضمان تحدید التوقع الإیجابی المربح المتسق تحدید المثلث المتماثل: حدد موقع نمط المثلث المتماثل على الرسم البیانی ، الذی یتکون من خطوط الاتجاه المتقارب مع التناظر. تطبیق TLS: الضوء الأخضر (العمل): مراقبة توحید أعلى أو أسفل وخارج المثلث. Amber Light (دمج): مع اقتراب السعر من مستویات المفاتیح و Apex ، مما یشیر إلى التقلبات المحتملة ومناطق إعادة الاختبار المستقبلیة. Red الضوء (العمل): ما وراء مثلثات الحدود/خط الاتجاه العلوی أو السفلی ، استعد لحرکة أسعار کبیرة فی الاتجاه الآخر أو استمرار قوی للاتجاه السابق. تحدید مزیف: ابحث عن حرکات الأسعار المفاجئة والحادة التی یبدو أنها تحطم الاتجاه ولکنها تفتقر إلى التأکید من خلال زیادة الحجم أو الإشارات الفنیة القویة. تداول مزیف: ابق حذرًا خلال مرحلة الضوء العنبر. فی حالة الاشتباه فی وجود مزیف محتمل ، تجنب إدخال الصفقات حتى یکون هناک تأکید واضح. إنشاء توقع إیجابی: استخدم TLS لتصفیة الإشارات الخاطئة وتحسین دقة التجارة. رکز على الإعدادات عالیة الاحتمال ، واستخدم نسبة مواتیة لتکوین المخاطر لکل تجارة. التعافی من الفخ: إذا تم القبض علیه فی مجموعة مزیفة ، فقم بتنفیذ نظریة "الاختبار والکسر". انتظر إعادة اختبار نقطة الانهیار/الانهیار الأصلی. إذا فشل السعر فی تجاوز هذه النقطة ، فاعتبرها خطوة خاطئة وتعدیل تجارتک وفقًا لذلک. نهج الانتعاش الإیجابی: بدلاً من قبول الخسارة ، تکییف استراتیجیتک بناءً على إشارات TLS ونظریة إعادة الاختبار. استخدم هذا کفرصة للتعلم وصقل نهجک لتداولات المستقبل. المراقبة والضبط: مراقبة التجارة باستمرار ، وضبط مستویات التوقف والربح الاسترداد بناءً على إشارات TLS وملاحظات إعادة الاختبار. تساعد هذه الإدارة النشطة على زیادة المکاسب وتقلیل الخسائر إلى الحد الأدنى. تذکر تطبیق استراتیجیات إدارة المخاطر وإجراء تحلیل شامل قبل اتخاذ أی قرارات تداول. ابق قابلاً للتکیف والاستفادة من TLS لتعزیز موثوقیة استراتیجیة التداول الخاصة بک ، وتحویل النکسات المحتملة إلى فرص التعلم. إجراء عملیات إعادة الاختراق وإعادة الاختبارات: استراتیجیات مع نظام إشارات المرور (TLS) تکتشف استراتیجیات تداول فعالة للاختراق والاستخلاص ، والتعزیز مع التداخل ، والتحسینات ، والاحتفاظ ، والاستمرار ، والاحتفاظ. یوفر TLS إشارة واضحة لنقاط الدخول المواتیة. یتضمن Retests.mastering Breakout and Retest Trading التحلیل الفنی ، والوعی فی السوق ، والاستخدام الاستراتیجی لـ TLS ، مما یؤدی إلى اتخاذ القرارات الواثقة والدقیقة.
SmartMoneyDayTrading
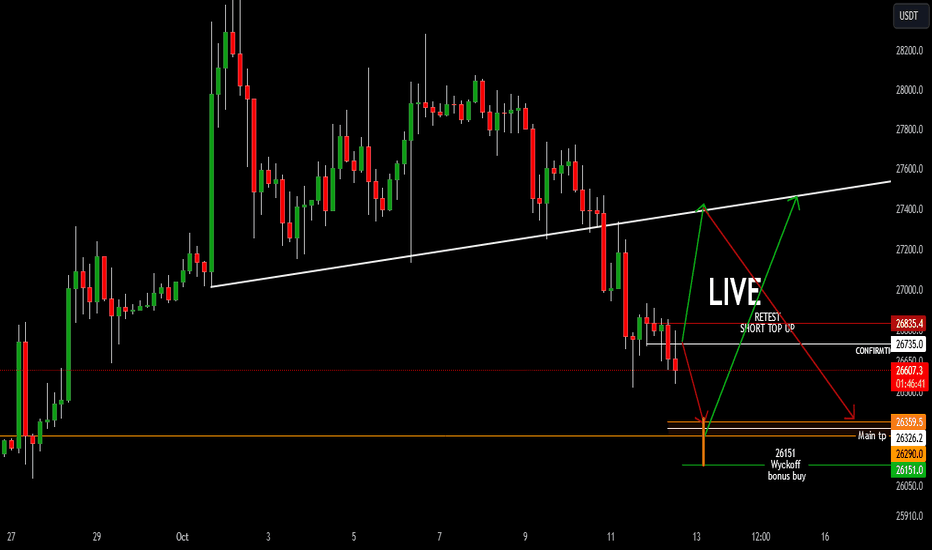
آسف مشغول للغایة ، أیدی ممتلئة الیوم .. هیریس الإعداد الخاص بی على HTF الآن نحن جمیعًا فی فخنا التالی. TA هو إذا کان أی شخص یتبع. الآن فقط تمسک بعد فترة قصیرة بعد الإغلاق لفترة طویلة ، سیتم تعیین الطلبات فی انتظار التعبئة الطویلة ... ستکون قریبًا مع التحدیث الکامل
SmartMoneyDayTrading
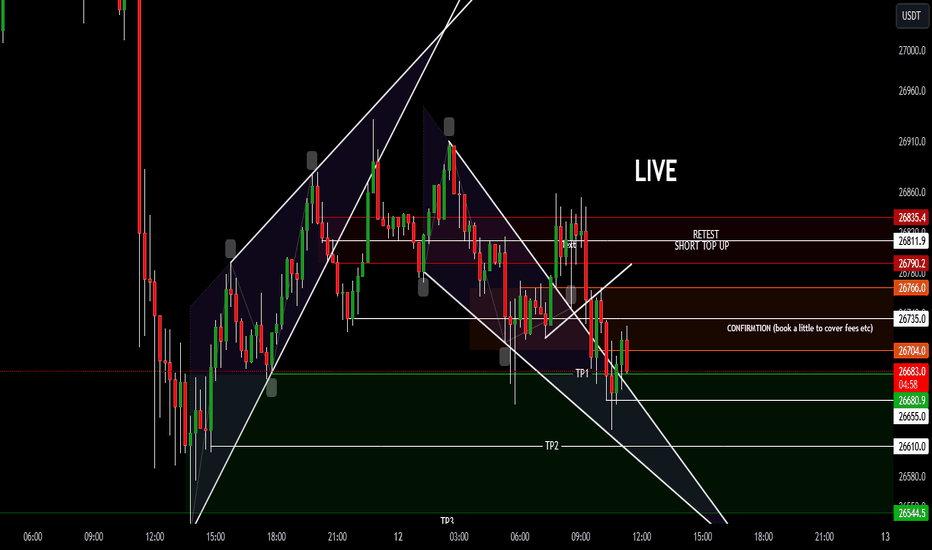
سیتم التحدیث قریبًا فقط نشر فکرة صغیرة لهذا الیوم
إخلاء المسؤولية
أي محتوى ومواد مدرجة في موقع Sahmeto وقنوات الاتصال الرسمية هي عبارة عن تجميع للآراء والتحليلات الشخصية وغير ملزمة. لا تشكل أي توصية للشراء أو البيع أو الدخول أو الخروج من سوق الأوراق المالية وسوق العملات المشفرة. كما أن جميع الأخبار والتحليلات المدرجة في الموقع والقنوات هي مجرد معلومات منشورة من مصادر رسمية وغير رسمية محلية وأجنبية، ومن الواضح أن مستخدمي المحتوى المذكور مسؤولون عن متابعة وضمان أصالة ودقة المواد. لذلك، مع إخلاء المسؤولية، يُعلن أن المسؤولية عن أي اتخاذ قرار وإجراء وأي ربح وخسارة محتملة في سوق رأس المال وسوق العملات المشفرة تقع على عاتق المتداول.