FXOpen
@t_FXOpen

ما هو الشيء الذي ننصحك بشراءه من المواد الغذائية؟
سابق في الشراء
پیام های تریدر
مرشح
FXOpen
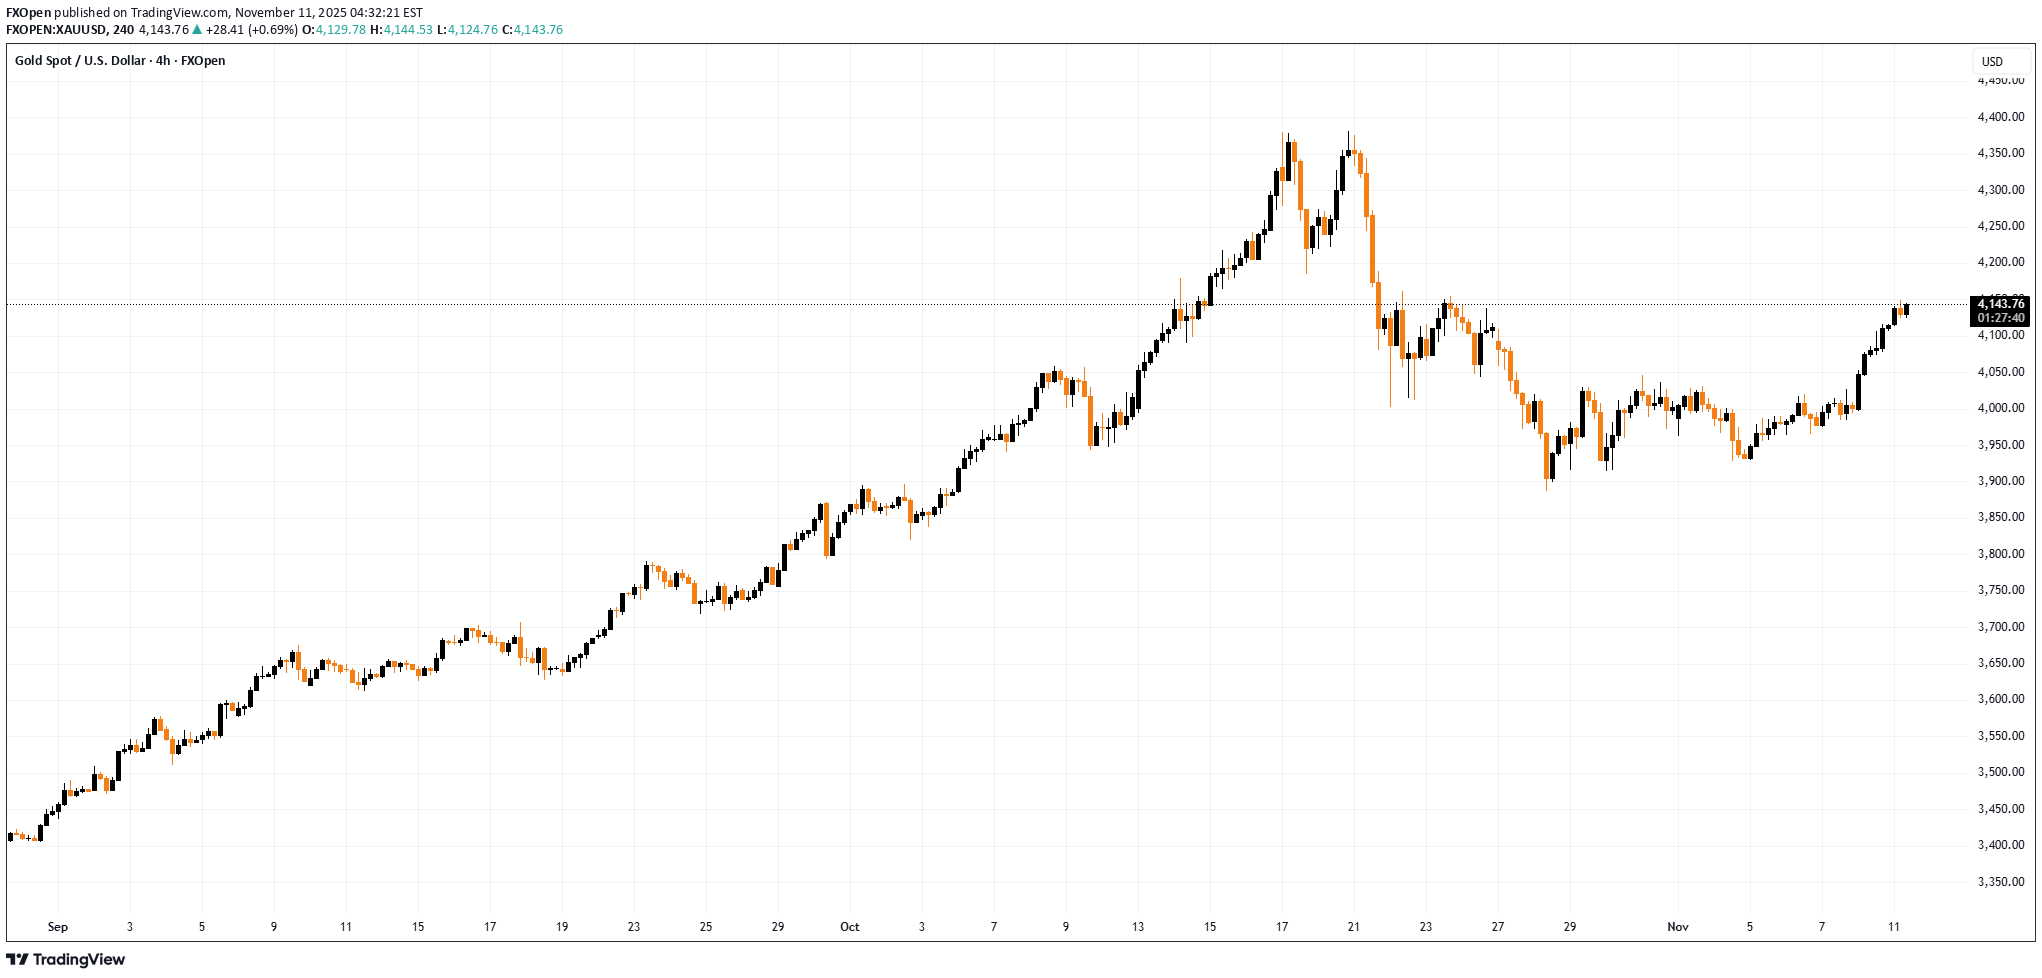
طلا در دوراهی حساس: منتظر دادههای بزرگ اقتصادی آمریکا!
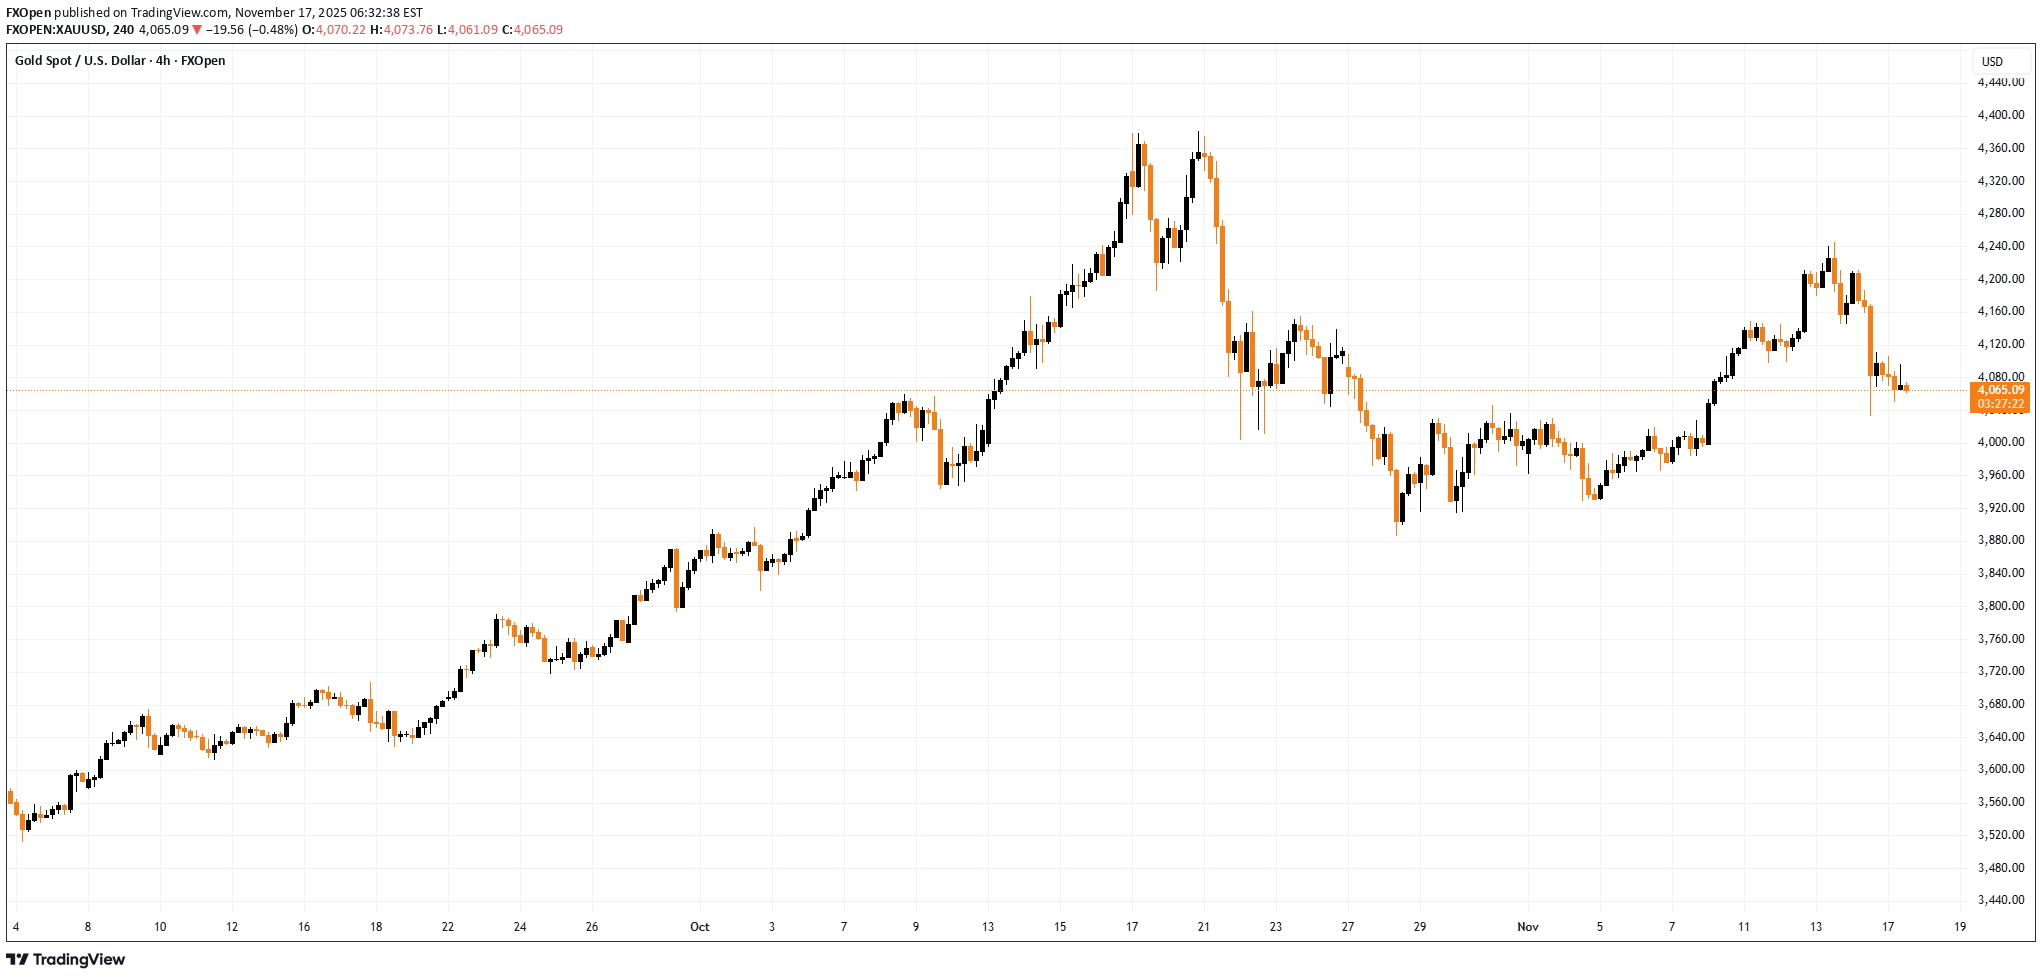
سعر الذهب متوازن وسط حالة عدم الیقین المتزایدة کما یظهر الرسم البیانی لزوج XAU/USD، انخفضت أسعار الذهب الأسبوع الماضی بشکل حاد، مما أدى إلى مقاطعة الاتجاه الصعودی السابق. وکان هذا الانخفاض مدفوعا بعاملین رئیسیین: → نهایة إغلاق الحکومة الأمریکیة. ویعتقد أن هذا قد أدى إلى تقلیل المخاطر الاقتصادیة على المدى القصیر وتقلیل الطلب على الذهب باعتباره أحد الأصول "الملاذ الآمن". → تصریحات متشددة من مسؤولی الاحتیاطی الفیدرالی، والتی خفضت توقعات السوق لخفض أسعار الفائدة. وقد أدى هذا إلى ارتفاع عوائد سندات الخزانة الأمریکیة، مما أدى تقلیدیا إلى فرض ضغوط هبوطیة على الأصول التی لا تدر عائدا مثل الذهب. تنتظر السوق هذا الأسبوع موجة من التقاریر الاقتصادیة الأمریکیة المؤجلة والتی تم تأجیلها خلال فترة الإغلاق، بما فی ذلک: → سوق العمل data (کشوف الرواتب غیر الزراعیة) ← التضخم data (مؤشر أسعار المستهلکین) ومن المتوقع أن تعطی هذه الإصدارات للمتداولین وضوحًا أکبر حول المسار المستقبلی لأسعار الفائدة الفیدرالیة. التحلیل الفنی لـ XAU/USD ومن الناحیة الفنیة، یتم تداول السعر حالیًا عند تقاطع خطین رئیسیین: → خط المقاومة من الحد العلوی للقناة الهابطة التی تبدأ عند أعلى مستوى لها على الإطلاق. وقد حاول المشترون اختراق هذا المستوى الأسبوع الماضی ولکنهم لم ینجحوا. ← خط الدعم من الحد السفلی للقناة الصاعدة، القائم منذ أوائل الخریف. وبناء على ما سبق، فمن المعقول أن نقترح ما یلی: ← السوق فی وضع متوازن، حیث یعتمد المتداولون أسلوب الانتظار والترقب؛ → قد یشیر الاختراق من المثلث المتماثل إلى اتجاه المستوى المهم التالی move فی أسعار الذهب. یمثل هذا المقال رأی الشرکات العاملة تحت العلامة التجاریة FXOpen فقط. لا ینبغی تفسیره على أنه عرض أو التماس أو توصیة فیما یتعلق بالمنتجات والخدمات التی تقدمها الشرکات العاملة تحت العلامة التجاریة FXOpen، ولا ینبغی اعتباره نصیحة مالیة.
FXOpen
پیشبینی حرکت قیمت انویدیا (NVDA) پیش از اعلام نتایج: تحلیل تکنیکال و انتظارات بازار
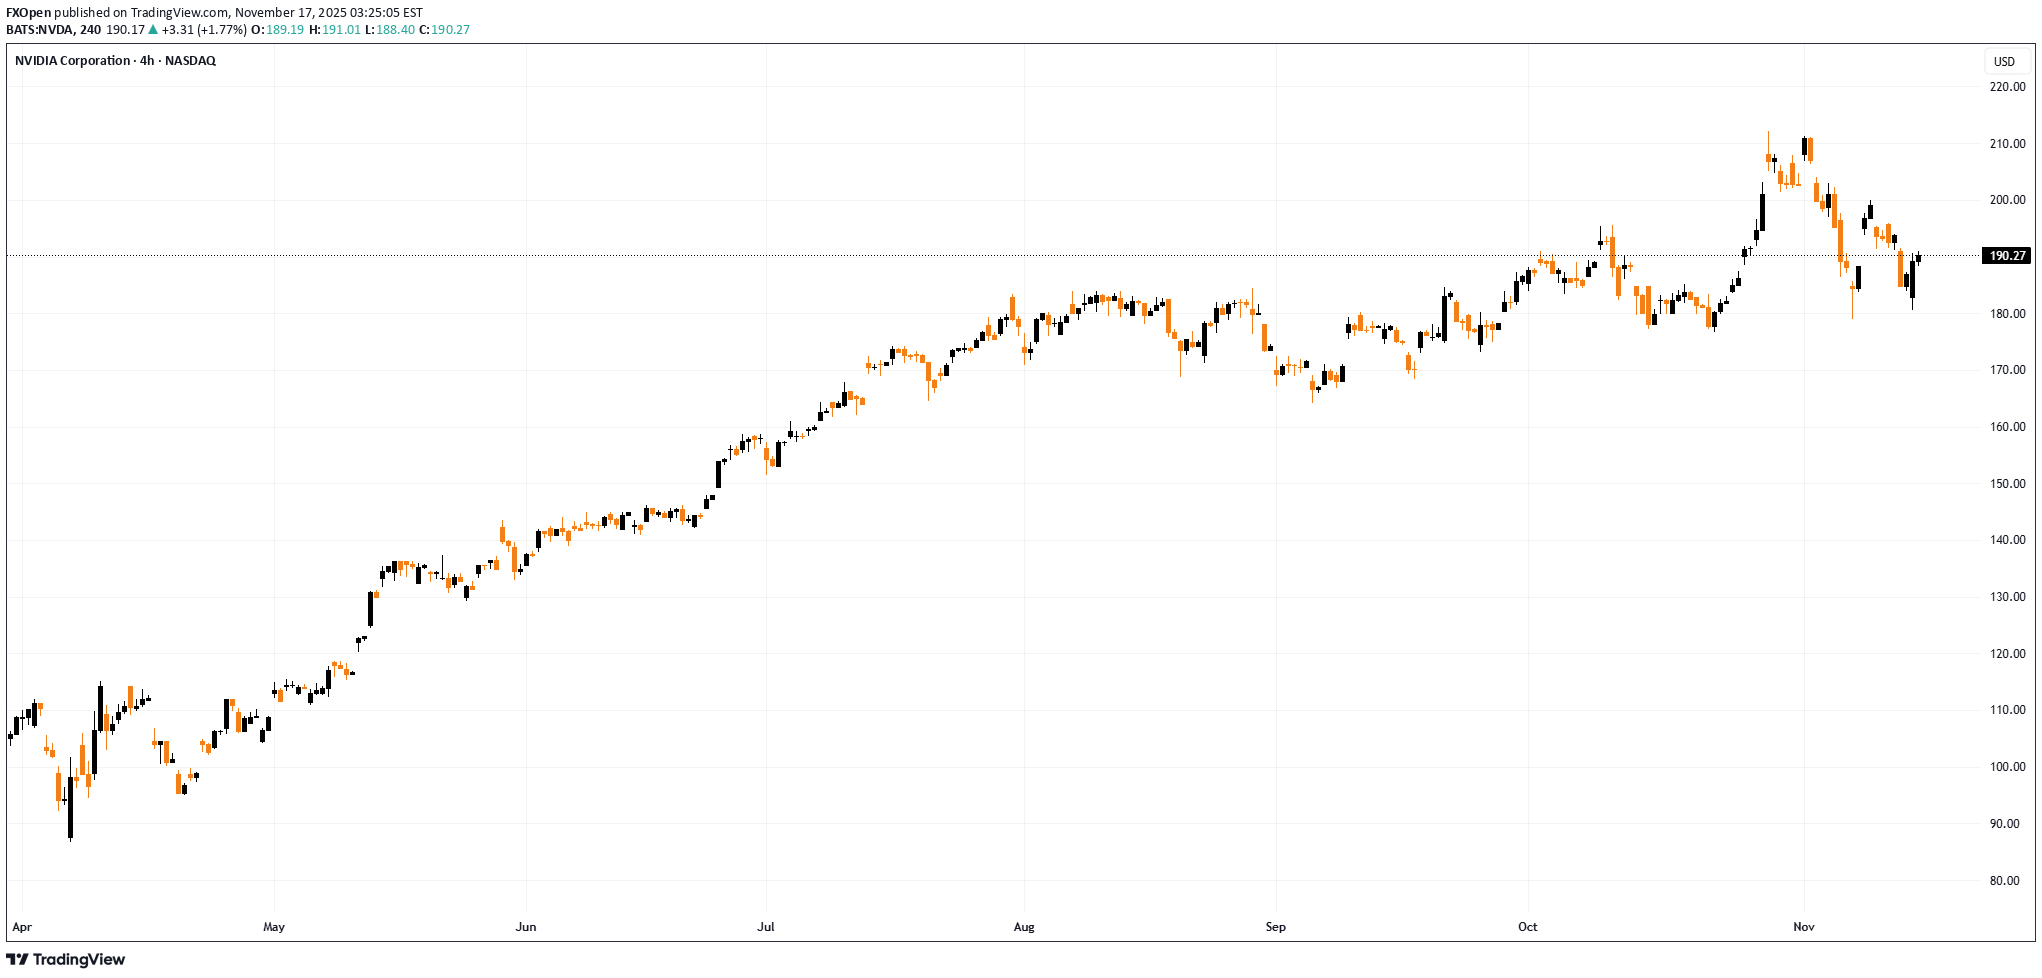
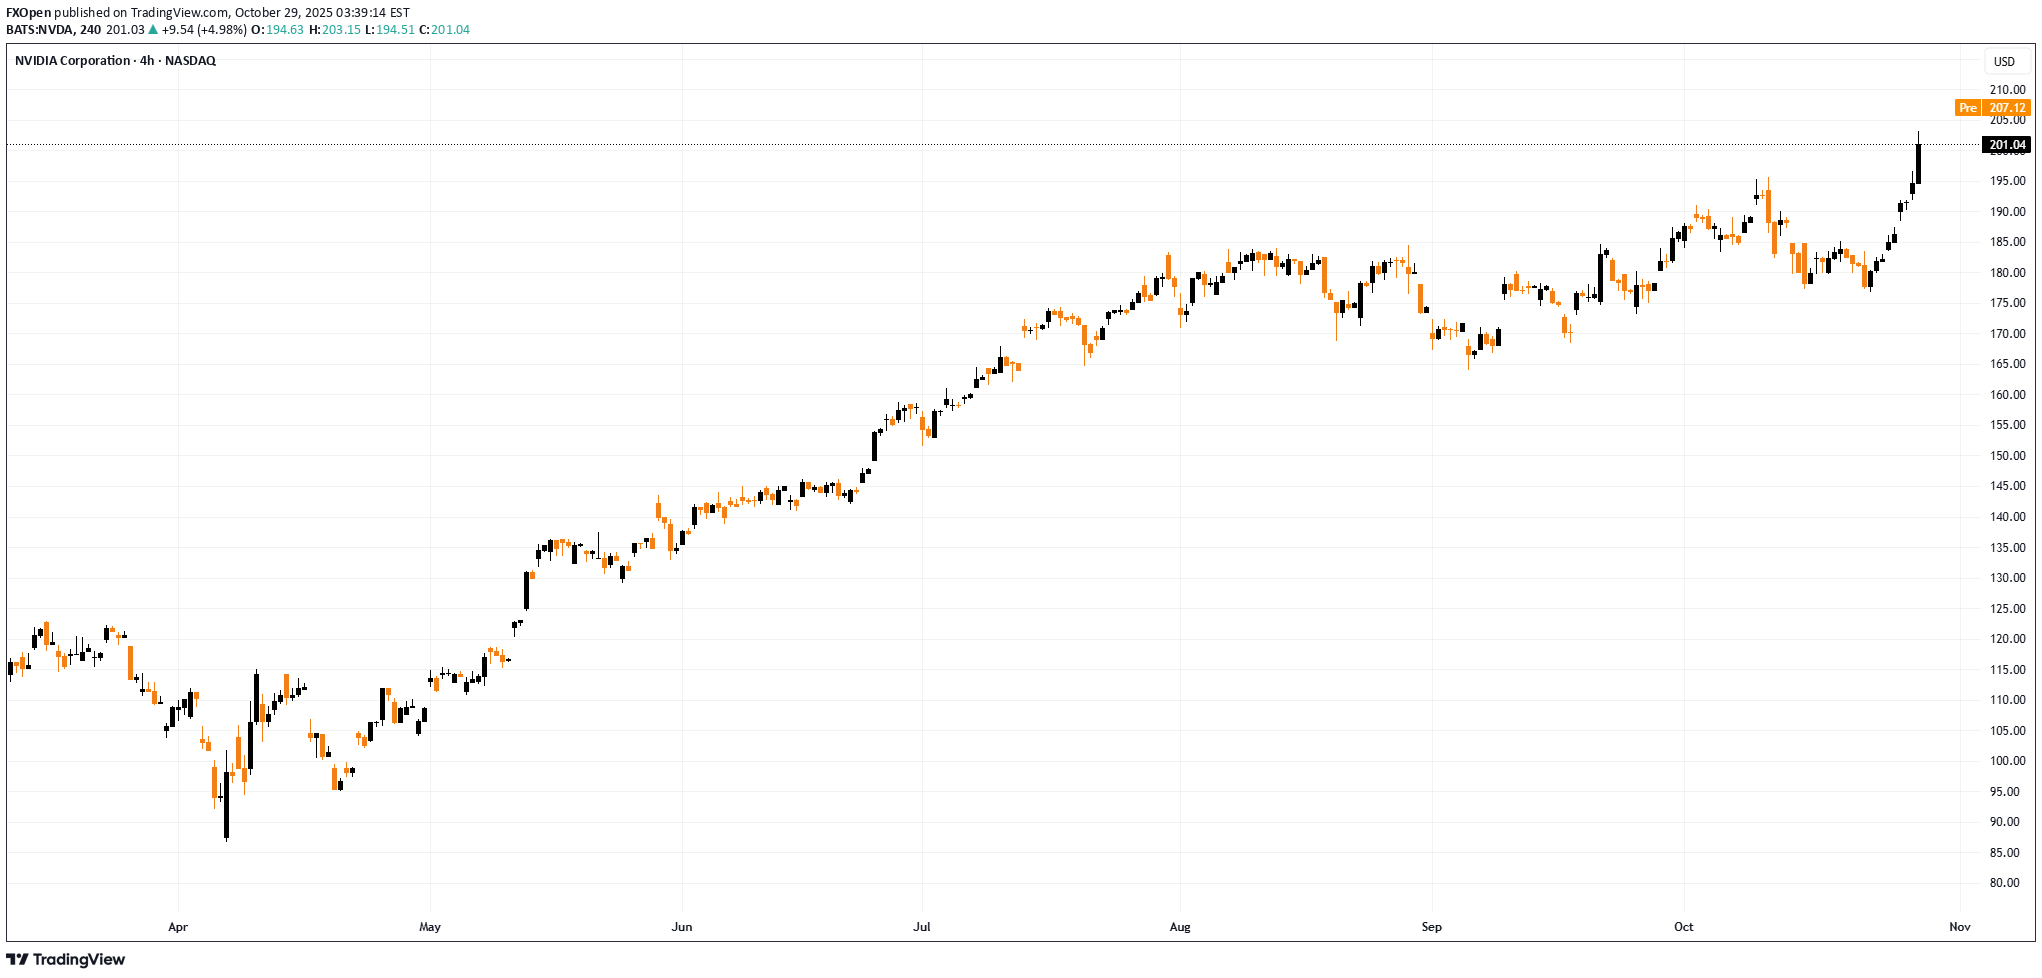
قبل أرباح Nvidia (NVDA): کیف یمکن للسعر Move یوم الأربعاء، بعد اختتام جلسة التداول الرئیسیة فی الولایات المتحدة، ستصدر شرکة Nvidia نتائجها الفصلیة - وهو تقریر لا یُنظر إلیه على أنه مجرد دفعة أخرى من الشرکات data ولکن کاختبار حاسم للمسار الصعودی الذی یقوده الذکاء الاصطناعی بأکمله. ارتفعت أسهم NVDA بأکثر من 40% منذ بدایة العام، ویجب على الشرکة الآن prove أن یکون هذا الارتفاع مبررًا وأن الثورة AI لا تزال تتسارع. وفقًا لتقاریر وسائل الإعلام، لا یزال محللو وول ستریت متفائلین: → الإیرادات: من المتوقع أن تبلغ حوالی 54.9 ملیار دولار، مما یعنی نموًا بنسبة 56٪ تقریبًا على أساس سنوی. → ربحیة السهم (EPS): حوالی 1.25 دولار (الربع السابق: 1.05 دولار). ما الذی یجب أن یرکز علیه المستثمرون؟ ستکون ذات أهمیة خاصة: → data على Data إیرادات المرکز، وهو مؤشر رئیسی لمعرفة ما إذا کانت الطفرة AI لا تزال سلیمة؛ → التوجیه المستقبلی، حیث یبحث السوق عن الطمأنینة بأن شرکات التکنولوجیا الکبرى ستستمر فی الإنفاق بکثافة على AI. التحلیل الفنی لمخطط Nvidia (NVDA). تشیر حرکة السعر الأخیرة فی NVDA إلى تسلسل یمکن تفسیره على أنه هبوطی: ← 28 أکتوبر: ارتفاع قوی فوق المستوى النفسی 200 دولار؛ ← الفشل فی الصمود فوق هذا الحاجز؛ → تراجع فی أحجام التداول المرتفعة (ناسداک data) مع توسع الشموع فی أوائل نوفمبر. فی سیاق السوق الأوسع، من الجدیر بالذکر أن أوائل نوفمبر شهد أداء NVDA أقل من 10> من مؤشرات الأسهم، مما یشیر إلى مقاومة قویة من البائعین حول 200 دولار. من منظور صعودی، فإن الانخفاض من أعلى مستوى على الإطلاق یشبه نمط التصحیح (کما هو موضح فی red) ضمن اتجاه صعودی أکبر. ومع ذلک، هناک خطر ألا یتم تلبیة توقعات السوق العالیة عند نشر تقریر الأرباح. إذا حدث ذلک، فقد یوسع NVDA تراجعه نحو الحد الأدنى للقناة الصاعدة، حیث یقع الدعم بالقرب من 165 دولارًا. یمثل هذا المقال رأی الشرکات العاملة تحت العلامة التجاریة FXOpen فقط. لا ینبغی تفسیره على أنه عرض أو التماس أو توصیة فیما یتعلق بالمنتجات والخدمات التی تقدمها الشرکات العاملة تحت العلامة التجاریة FXOpen، ولا ینبغی اعتباره نصیحة مالیة.
FXOpen
سهام متا (META) به کف حمایتی رسید: آیا خیزش دوباره آغاز میشود؟
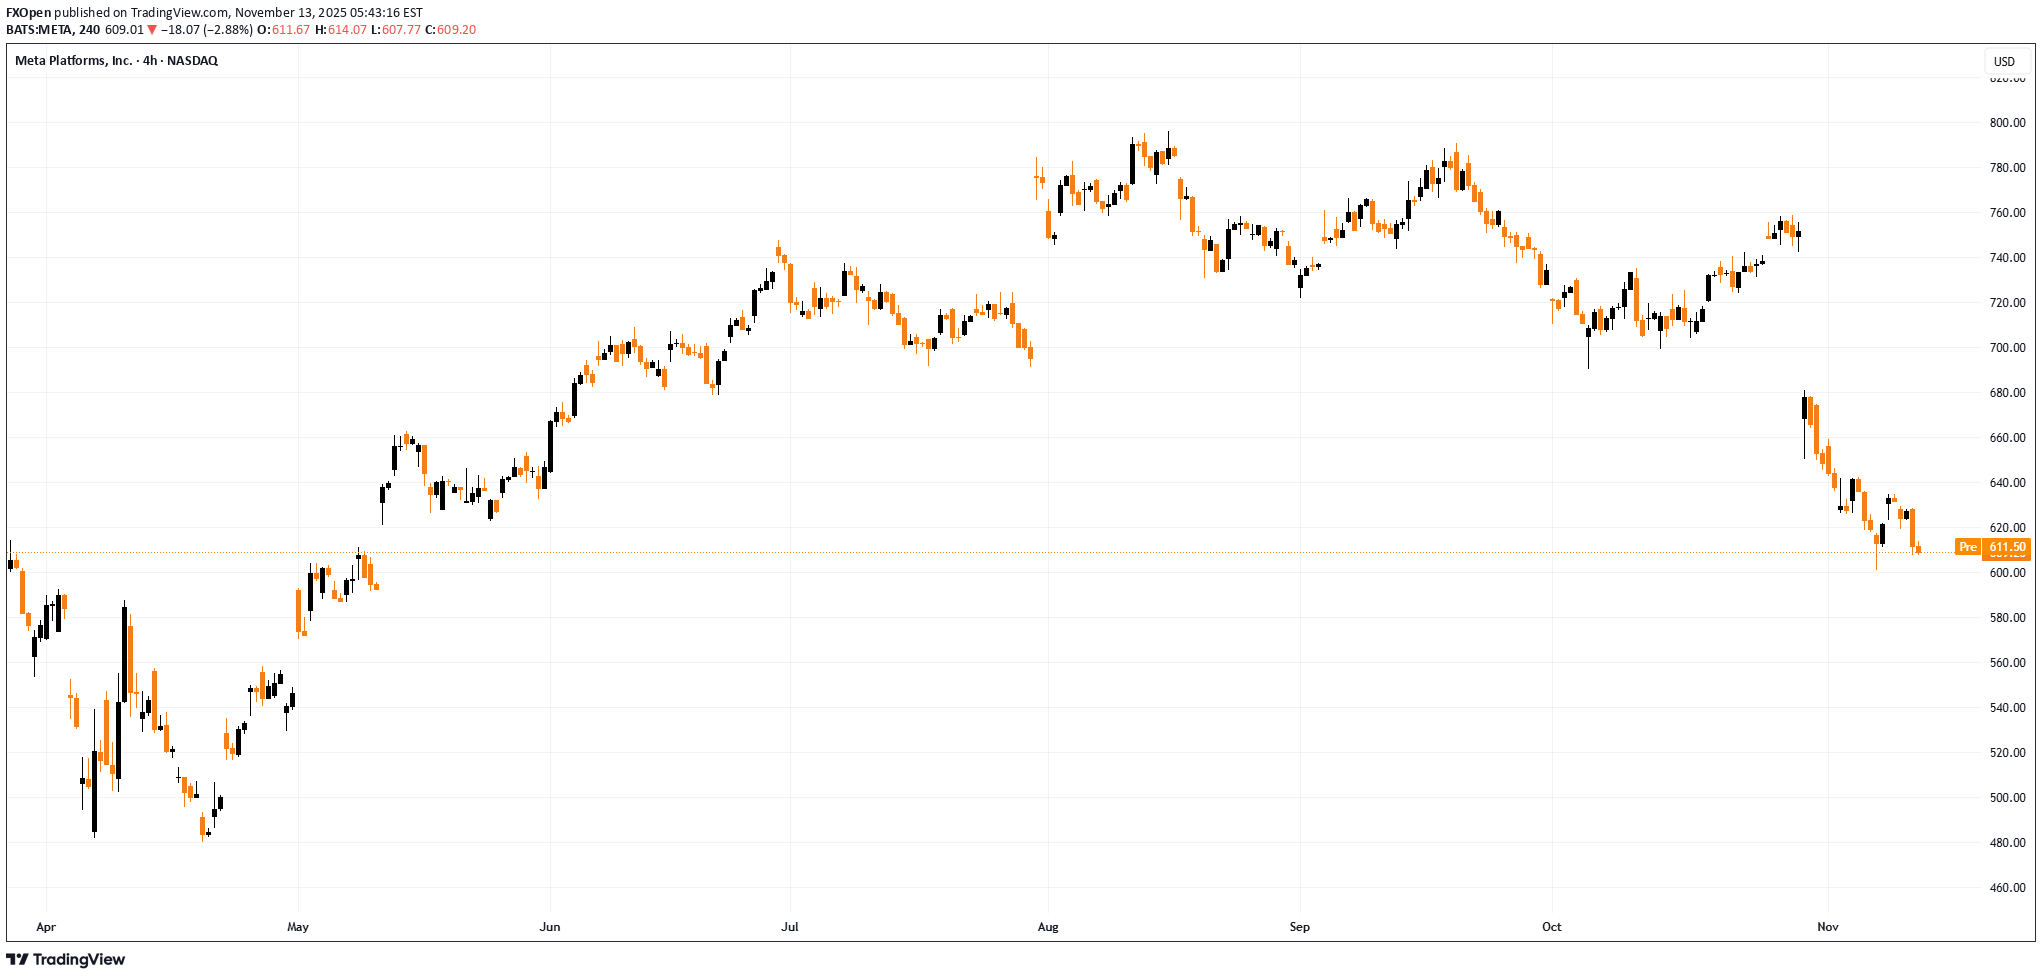
انخفضت أسهم منصات التعریف (META) إلى مستوى الدعم الرئیسی فی نوفمبر، أظهرت أسهم Meta Platforms (META) زخمًا هبوطیًا بعد التقریر ربع السنوی للشرکة، والذی تضمن نفقات ضریبة الدخل لمرة واحدة بقیمة 15.93 ملیار دولار (کما ذکرنا سابقًا). وزادت مخاوف المستثمرین من خطط الشرکة لرفع الإنفاق الرأسمالی إلى 70-72 ملیار دولار فی عام 2025، بهدف توسیع البنیة التحتیة المرکزیة والحصول على رقائق AI. ومع ذلک، بعد انخفاض بأکثر من 20% عن ذروة الخریف، قد یحاول المضاربون على الارتفاع العودة. التحلیل الفنی لـ META عند تحلیل مخطط META فی 31 أکتوبر، تم تحدید قناة هابطة (کما هو موضح فی red). اعتبارًا من الیوم، وصل سعر السهم إلى کتلة دعم مکونة من العناصر الرئیسیة التالیة: → الحد السفلی للقناة الهابطة؛ ← المستوى النفسی 600 دولار للسهم الواحد؛ → ومنطقة الفجوة الصعودیة لشهر مایو. ومن الجدیر بالذکر أیضًا أن مؤشر القوة النسبیة یقترب من منطقة ذروة البیع، وقد یؤدی الاختراق الهبوطی الکاذب دون المستوى النفسی 600 دولار إلى خلق تباین صعودی. لذلک لا یمکن استبعاد ما یلی: ← لقد تم بالفعل احتساب الانخفاض فی شهر نوفمبر ضمن مخاوف ما بعد الأرباح؛ → وأن المضاربین على الارتفاع قد یستخدمون منطقة الدعم هذه کنقطة انطلاق لاستئناف الاتجاه الصعودی الأوسع. یمثل هذا المقال رأی الشرکات العاملة تحت العلامة التجاریة FXOpen فقط. لا ینبغی تفسیره على أنه عرض أو التماس أو توصیة فیما یتعلق بالمنتجات والخدمات التی تقدمها الشرکات العاملة تحت العلامة التجاریة FXOpen، ولا ینبغی اعتباره نصیحة مالیة.
FXOpen
پاداش تریلیون دلاری ایلان ماسک: سهام تسلا (TSLA) در مسیر صعود یا سقوط؟
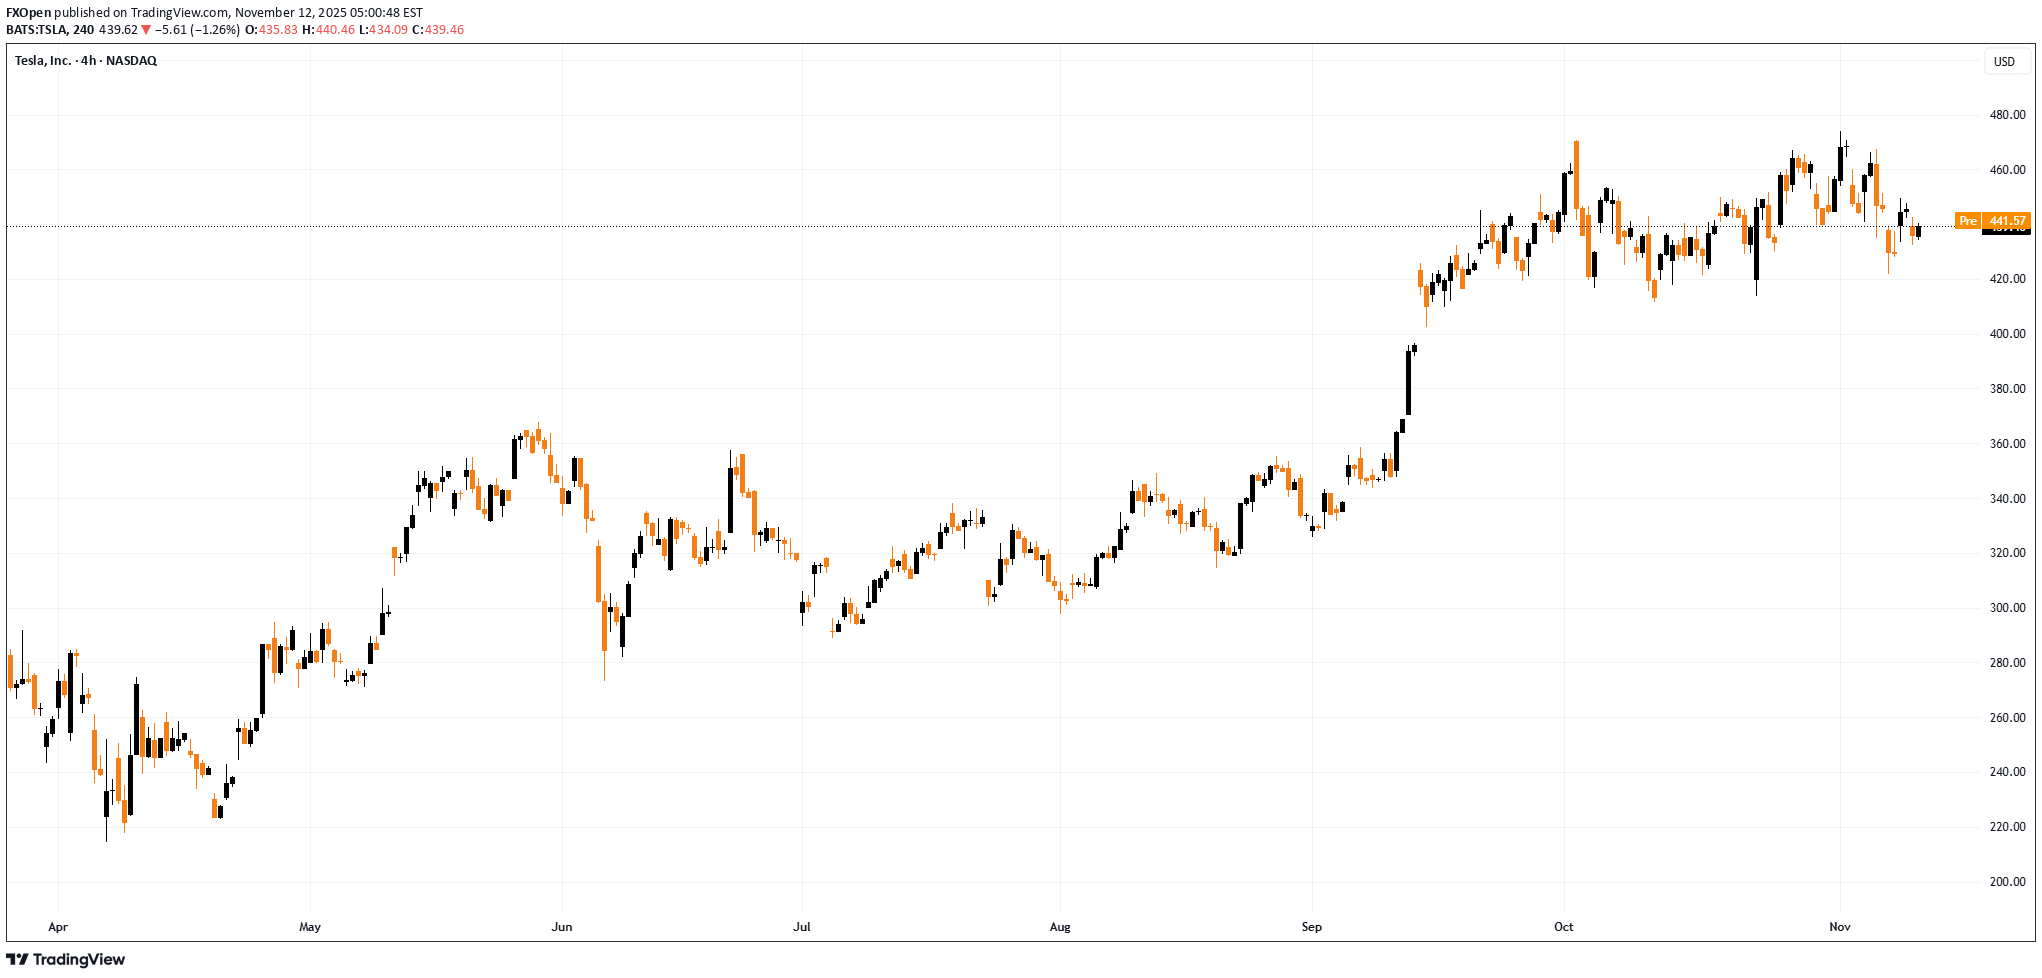
یمکن أن یکسب Musk تریلیونًا: کیف تتفاعل أسهم Tesla (TSLA)؟ وفقًا لتقاریر وسائل الإعلام، وافق مساهمو Tesla فی وقت سابق من هذا الشهر على حزمة تعویضات جدیدة مدتها 10 سنوات لـ Musk بقیمة تصل إلى 1 تریلیون دولار. ولکن هل هذه أخبار جیدة أم سیئة لأسهم TSLA؟ → على الجانب الإیجابی، أصبح ماسک الآن "مرتبطًا" بقوة بالشرکة ولدیه دافع کبیر لتحقیق أهداف غیر عادیة - مثل الوصول إلى قیمة سوقیة تبلغ 8.5 تریلیون دولار وإطلاق الإنتاج الضخم لروبوتات أوبتیموس. ← وعلى الجانب السلبی، قد یکون ثمن هذا القرار مرتفعاً. وتبدو الأهداف أقرب إلى الخیال، وتحقیقها یعنی إضعاف حصص المساهمین الحالیین من خلال إصدار خیارات جدیدة. ونتیجة لذلک، کان سعر سهم تسلا یتقلب، مما یعکس تردد السوق وتوطیده بعد الأخبار. نظرة فاحصة على مخطط TSLA تقدم أدلة حول ما قد یحدث بعد ذلک. التحلیل الفنی لـ TSLA ومن منظور صاعد، یظل سعر سهم Tesla ضمن قناة اتجاه صاعد منحدر، حیث: → یظهر الخط المتوسط علامات على العمل کدعم؛ ← شکل الارتفاع الحاد فی سبتمبر منطقة طلب، حیث أدى عدم التوازن بین المشترین والبائعین إلى ارتفاع قوی move - یمکن أن یکون الحد العلوی لهذه القناة، حول العلامة النفسیة 400 دولار، act کمستوى دعم فی المستقبل. من وجهة نظر هبوطیة، یظل الحاجز الرئیسی هو أعلى مستوى حالی على الإطلاق، والذی یستمر فی الحد من الارتفاع المستمر (حوالی +100٪ من أدنى مستوى لهذا العام). وبالنظر إلى هذه العوامل، فمن المعقول أن نفترض أن TSLA یمر حالیًا بمرحلة التوحید. یمکن أن یتم حل الوضع فی النهایة لصالح المضاربین على الارتفاع إذا احتفظ السعر بالحد الأدنى للقناة - کما رأینا سابقًا، عندما سبقت فترة تماسک مماثلة الاختراق فوق مستوى المقاومة 360 دولارًا. یمثل هذا المقال رأی الشرکات العاملة تحت العلامة التجاریة FXOpen فقط. لا ینبغی تفسیره على أنه عرض أو التماس أو توصیة فیما یتعلق بالمنتجات والخدمات التی تقدمها الشرکات العاملة تحت العلامة التجاریة FXOpen، ولا ینبغی اعتباره نصیحة مالیة.
FXOpen
پایان تعطیلی دولت آمریکا: طلا به کدام سمت میرود؟ (تحلیل قیمت طلای پس از بحران)
انتهاء الإغلاق: کیف سیکون رد فعل أسعار الذهب؟ وبحسب رویترز، فإن الولایات المتحدةS. وافق مجلس الشیوخ یوم الاثنین على اتفاق تسویة لإنهاء أطول إغلاق حکومی فی تاریخ البلاد. أثناء الاغلاق: ← فقد ملایین الأمریکیین القدرة على الوصول إلى برامج المساعدة الغذائیة؛ ← مئات الآلاف من الموظفین الفیدرالیین ظلوا بدون أجر؛ ← تعطل السفر الجوی بشدة. یبدو أن حالة عدم الیقین المحیطة بالاستمرار المحتمل للإغلاق قد ساهمت فی اختراق سعر الذهب (کأصل ملاذ آمن تقلیدی) فوق منطقة الترسیخ الأخیرة، والتی تتمیز بخطوط سوداء على الرسم البیانی. ومع ذلک، یمکن الحد من المزید من المکاسب لیس فقط من خلال تلاشی النفور من المخاطرة ولکن أیضًا من خلال مستوى مقاومة أقل وضوحًا، والذی وصل إلیه سعر XAU/USD الیوم. التحلیل الفنی للرسم البیانی XAU/USD باستخدام النقاط المحوریة الرئیسیة (المظللة بالخط العریض)، یمکننا تتبع قناة هابطة، حیث یختبر سعر الذهب الآن حده العلوی، حیث قد تظهر المقاومة. هناک حجة أخرى تدعم هذا الرأی وهی أن السعر یقع حالیًا حول مستوى تصحیح 50٪ للتأرجح الهبوطی A → B. قد تجتذب هذه المنطقة البائعین الذین یسعون للدفاع عن المسار الهبوطی للذهب. ما إذا کان خط المقاومة هذا سیصمد - أو سیحاول المضاربون على الصعود إعادة إشعال ارتفاع الخریف - سیعتمد إلى حد کبیر على نغمة الإصدارات الاقتصادیة القادمة (التی تأخرت بسبب الإغلاق) وتأثیرها على توقعات السوق لخفض محتمل لسعر الفائدة من قبل الاحتیاطی الفیدرالی. یمثل هذا المقال رأی الشرکات العاملة تحت العلامة التجاریة FXOpen فقط. لا ینبغی تفسیره على أنه عرض أو التماس أو توصیة فیما یتعلق بالمنتجات والخدمات التی تقدمها الشرکات العاملة تحت العلامة التجاریة FXOpen، ولا ینبغی اعتباره نصیحة مالیة.
FXOpen
تحلیل بازار طلا: تثبیت قیمت در محدوده ۴۰۰۰ دلار و نقاط کلیدی پیش رو
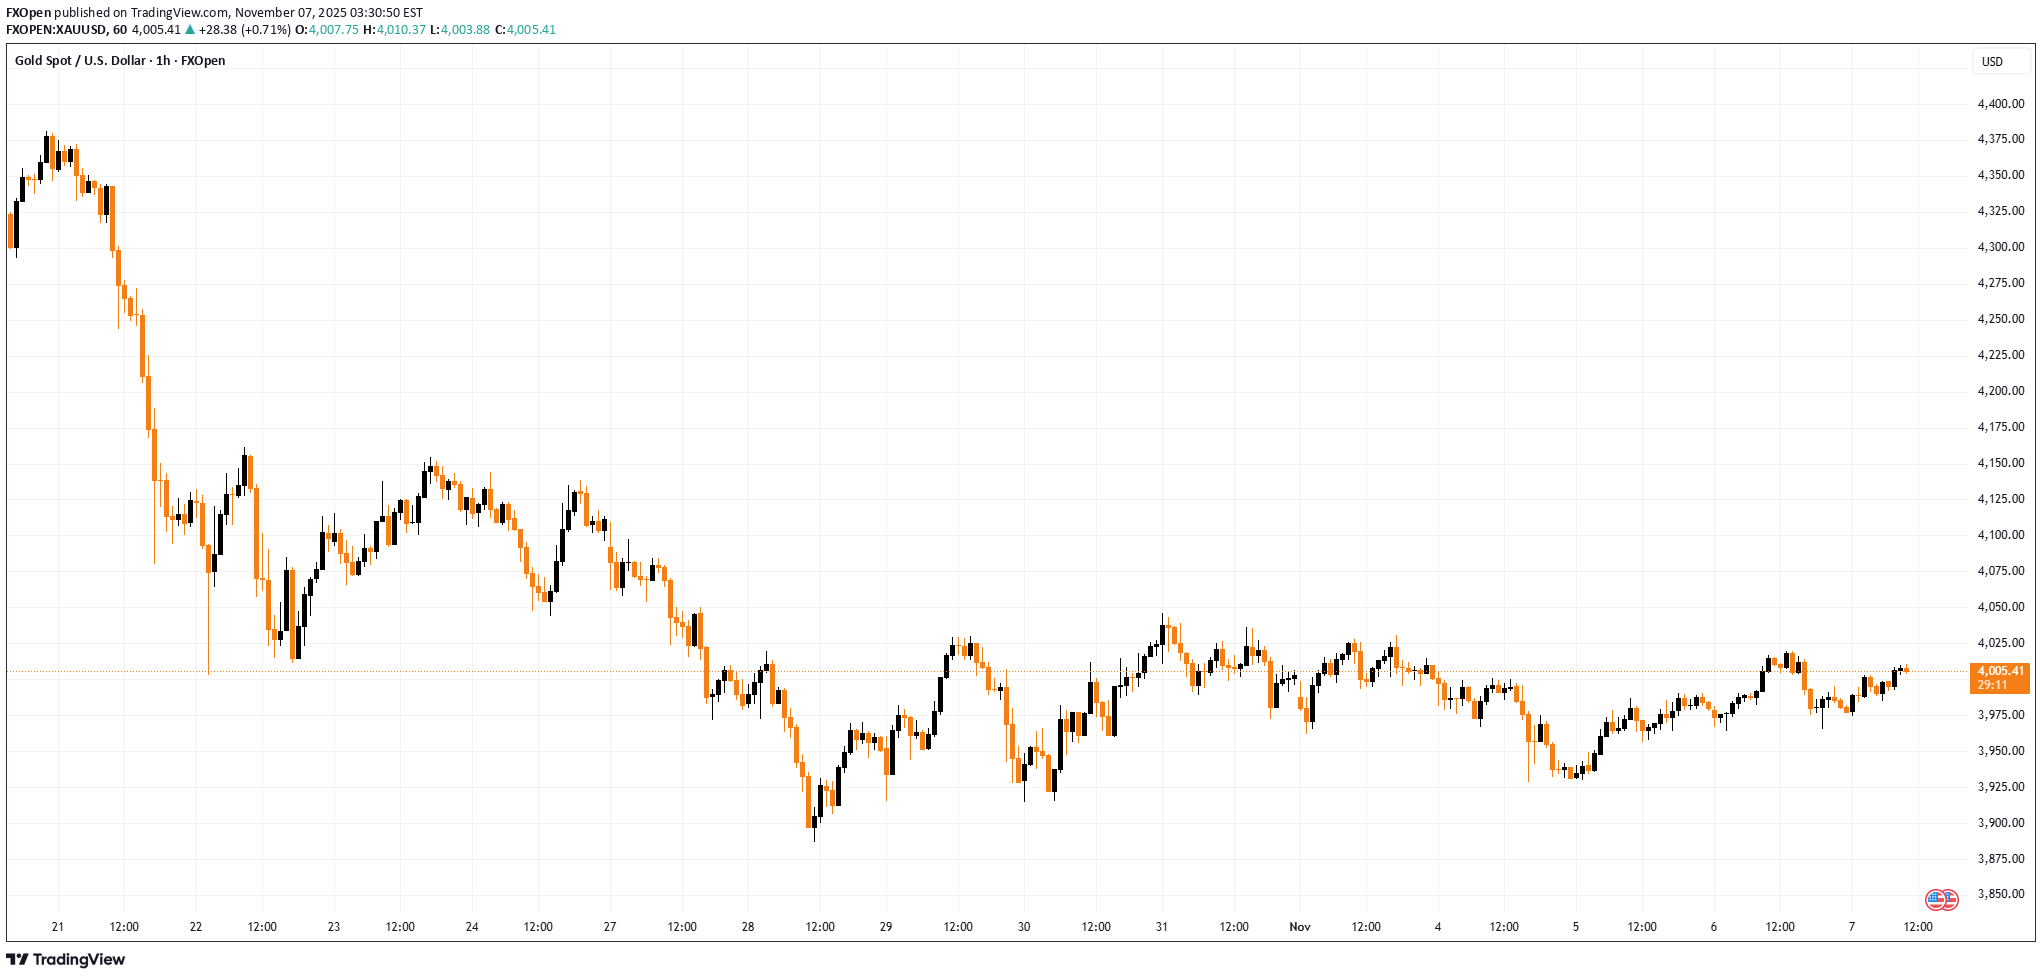
تحلیل السوق: الذهب یبقى ثابتًا صحح سعر الذهب مکاسبه، وتم تداوله بأقل من 4000 دولار، وبدأ التوحید. الوجبات السریعة الهامة لتحلیل أسعار الذهب الیوم - بدأ سعر الذهب فی تصحیح هبوطی دون مستوى 4,100 دولار أمریکی و4,000 دولار أمریکی مقابل الدولار الأمریکی. - یتم تشکیل خط اتجاه صعودی رئیسی بدعم عند 3,985 دولارًا على الرسم البیانی لکل ساعة للذهب. التحلیل الفنی لسعر الذهب على الرسم البیانی لکل ساعة للذهب، شکل السعر قاعدة فوق 3,915 دولارًا. ظل السعر فی المنطقة الصعودیة وبدأ فی الارتفاع move ضمن نطاق أعلى من 3,930 دولارًا. کان هناک مستوى جید move فوق المتوسط المتحرک البسیط لمدة 50 ساعة و3975 دولارًا. دفع المضاربون على الارتفاع السعر فوق مستویات المقاومة 4000 دولار و4010 دولارات. تم تشکیل أعلى مستوى عند 4,019 دولارًا قبل أن یشهد السعر تراجعًا. انخفض السعر إلى ما دون مستوى تصحیح فیبوناتشی 23.6% للارتفاع move من أدنى مستوى تأرجح عند 3928 دولارًا إلى أعلى مستوى عند 4019 دولارًا، وانخفض مؤشر القوة النسبیة إلى ما دون 50. یقع الدعم الأولی على الجانب الهبوطی بالقرب من 3985 دولارًا، وهو خط اتجاه صعودی ومتوسط متحرک بسیط لمدة 50 ساعة. منطقة major الأولى التی تهم المضاربین على الارتفاع تقع بالقرب من مستوى تصحیح فیبوناتشی 50% عند 3,975 دولارًا. إذا حدث اختراق هبوطی أدنى من 3,975 دولارًا، فقد ینخفض السعر أکثر. فی الحالة المذکورة، قد ینخفض السعر نحو 3950 دولارًا. أی خسائر أخرى قد تدفع السعر نحو 3930 دولارًا. المقاومة الفوریة قریبة من 4,020 دولار. العقبة major التالیة أمام المضاربین على الارتفاع هی 4030 دولارًا. قد یؤدی الاختراق الصعودی فوق 4,030 دولارًا إلى إرسال سعر الذهب نحو 4,045 دولارًا. ربما تؤدی أی مکاسب أخرى إلى تحدید وتیرة الزیادة نحو 4090 دولارًا. یمثل هذا المقال رأی الشرکات العاملة تحت العلامة التجاریة FXOpen فقط. لا ینبغی تفسیره على أنه عرض أو التماس أو توصیة فیما یتعلق بالمنتجات والخدمات التی تقدمها الشرکات العاملة تحت العلامة التجاریة FXOpen، ولا ینبغی اعتباره نصیحة مالیة.
FXOpen
جهش تاریخی طلا: قیمت از مرز 4000 دلار عبور کرد!
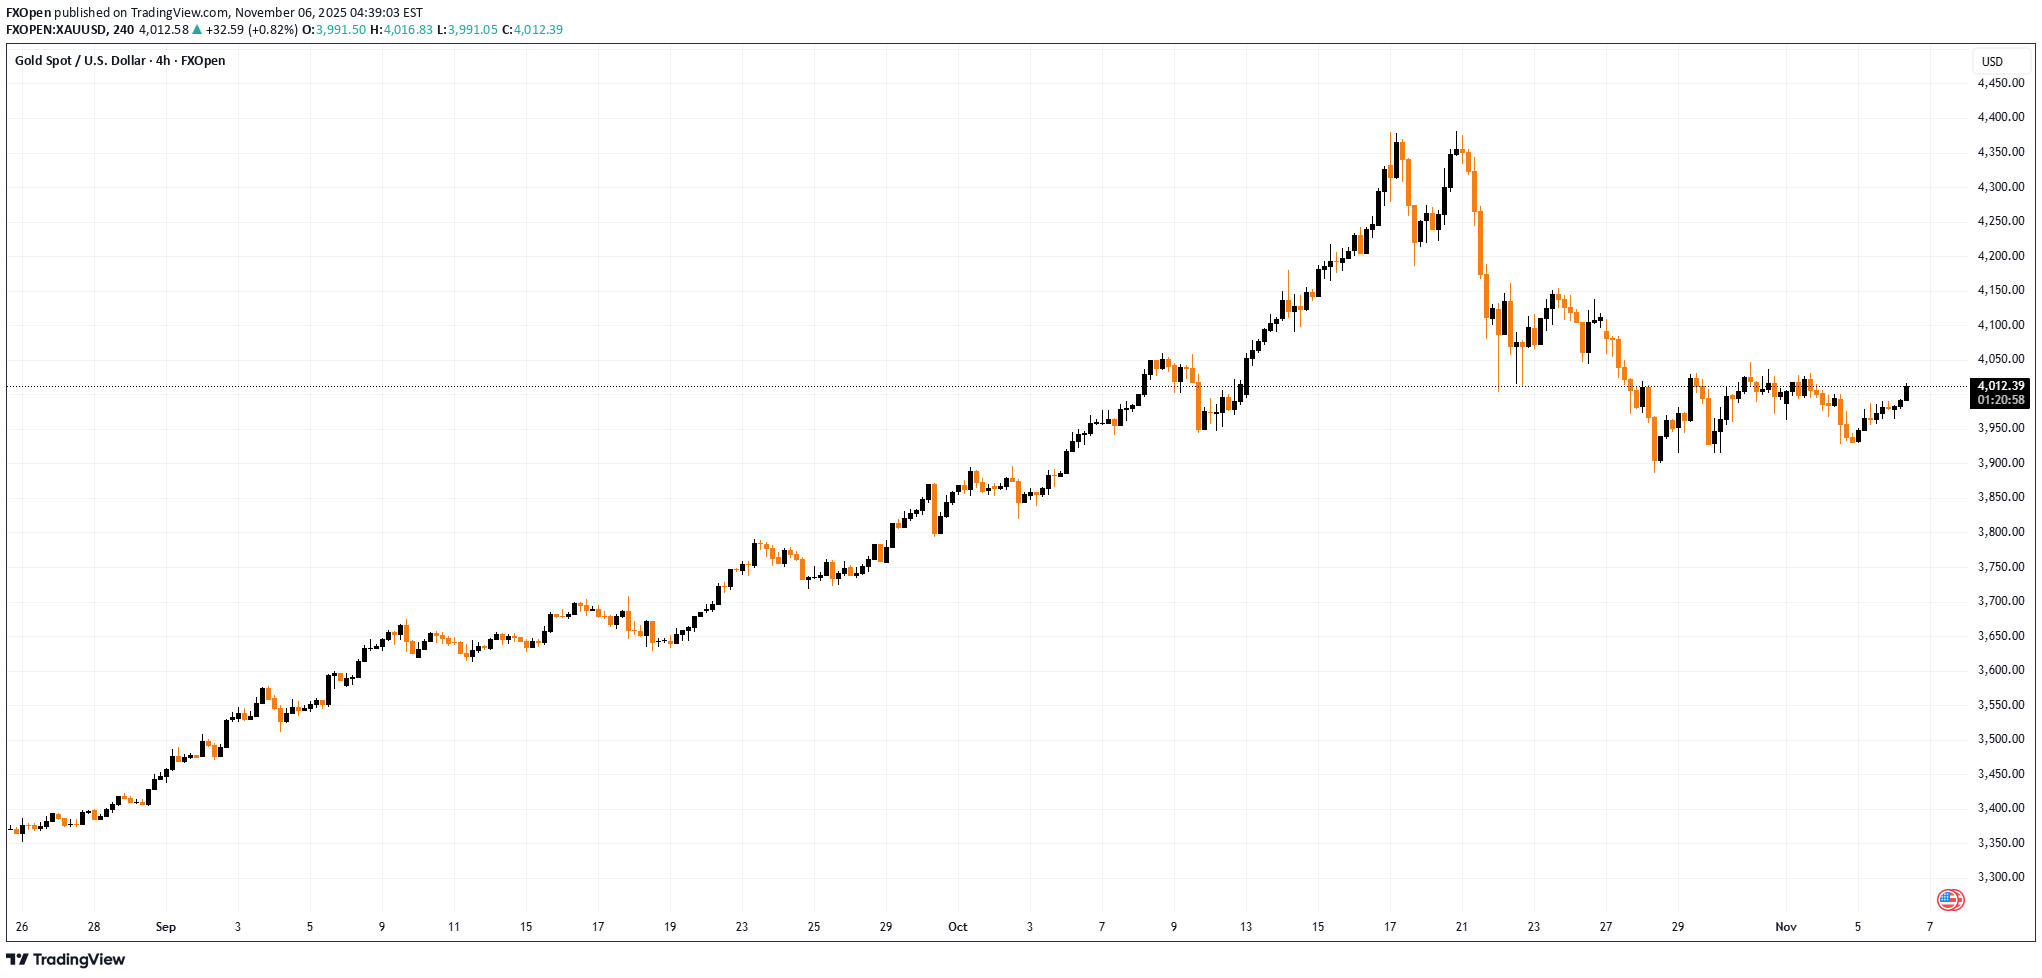
سعر الذهب یرتفع فوق 4000 دولار کما یظهر الرسم البیانی، ارتفع زوج XAU/USD فوق مستوى 4000 دولار الیوم، ومن المحتمل أن یکون move مدفوعًا بما یلی: ← ضعف فی مؤشر الدولار الأمریکی - أو التراجع عن مستوى المقاومة الذی تمت مناقشته فی تحلیل DXY بالأمس. ← مخاوف بشأن الإغلاق المستمر للحکومة الأمریکیة - وفقًا لتقاریر وسائل الإعلام، کانت إحدى العواقب هی أن شرکات الطیران الأمریکیة بدأت فی الحد من مبیعات التذاکر فی نوفمبر. التحلیل الفنی لـ XAU/USD فی 28 أکتوبر، أظهر تحلیلنا لتحرکات أسعار الذهب ما یلی: → قمنا ببناء قناة صاعدة (باللون الأزرق)، توضح الارتفاع الملحوظ للمعدن من أدنى مستوى له فی أغسطس. ← اقترحنا أن التراجع المتطور قد یستهدف خط QL، مدعومًا بدعم الرقم التقریبی عند 3,900 دولار. صمدت منطقة الدعم هذه بنجاح، وشکلت قاعًا محلیًا عند النقطة B، وبعد ذلک دخل السعر فی فترة من التماسک، تشبه نمط المثلث المتماثل. والجدیر بالذکر أن الذهب قد اخترق صعودًا الیوم عبر هذا المثلث (المحدد باللون الأسود). فی السیاق الأوسع، یمثل هذا الاختراق إشارة قویة من المضاربین على الارتفاع، مما یشیر إلى احتمال استئناف الاتجاه الصعودی لعام 2025. إذا استمر زخم الشراء، فقد یتم اختبار قوتهم من خلال: ← المقاومة عند 4,045 دولارًا؛ ← المقاومة بالقرب من 4,150 دولارًا أمریکیًا، والتی تتوافق مع تصحیح 50٪ لانخفاض A → B وقد عملت سابقًا کمنطقة انعکاس لـ XAU/USD. یمثل هذا المقال رأی الشرکات العاملة تحت العلامة التجاریة FXOpen فقط. لا ینبغی تفسیره على أنه عرض أو التماس أو توصیة فیما یتعلق بالمنتجات والخدمات التی تقدمها الشرکات العاملة تحت العلامة التجاریة FXOpen، ولا ینبغی اعتباره نصیحة مالیة.
FXOpen
سهام آمازون رکورد شکست: رسیدن AMZN به مرز 250 دلار برای اولین بار!
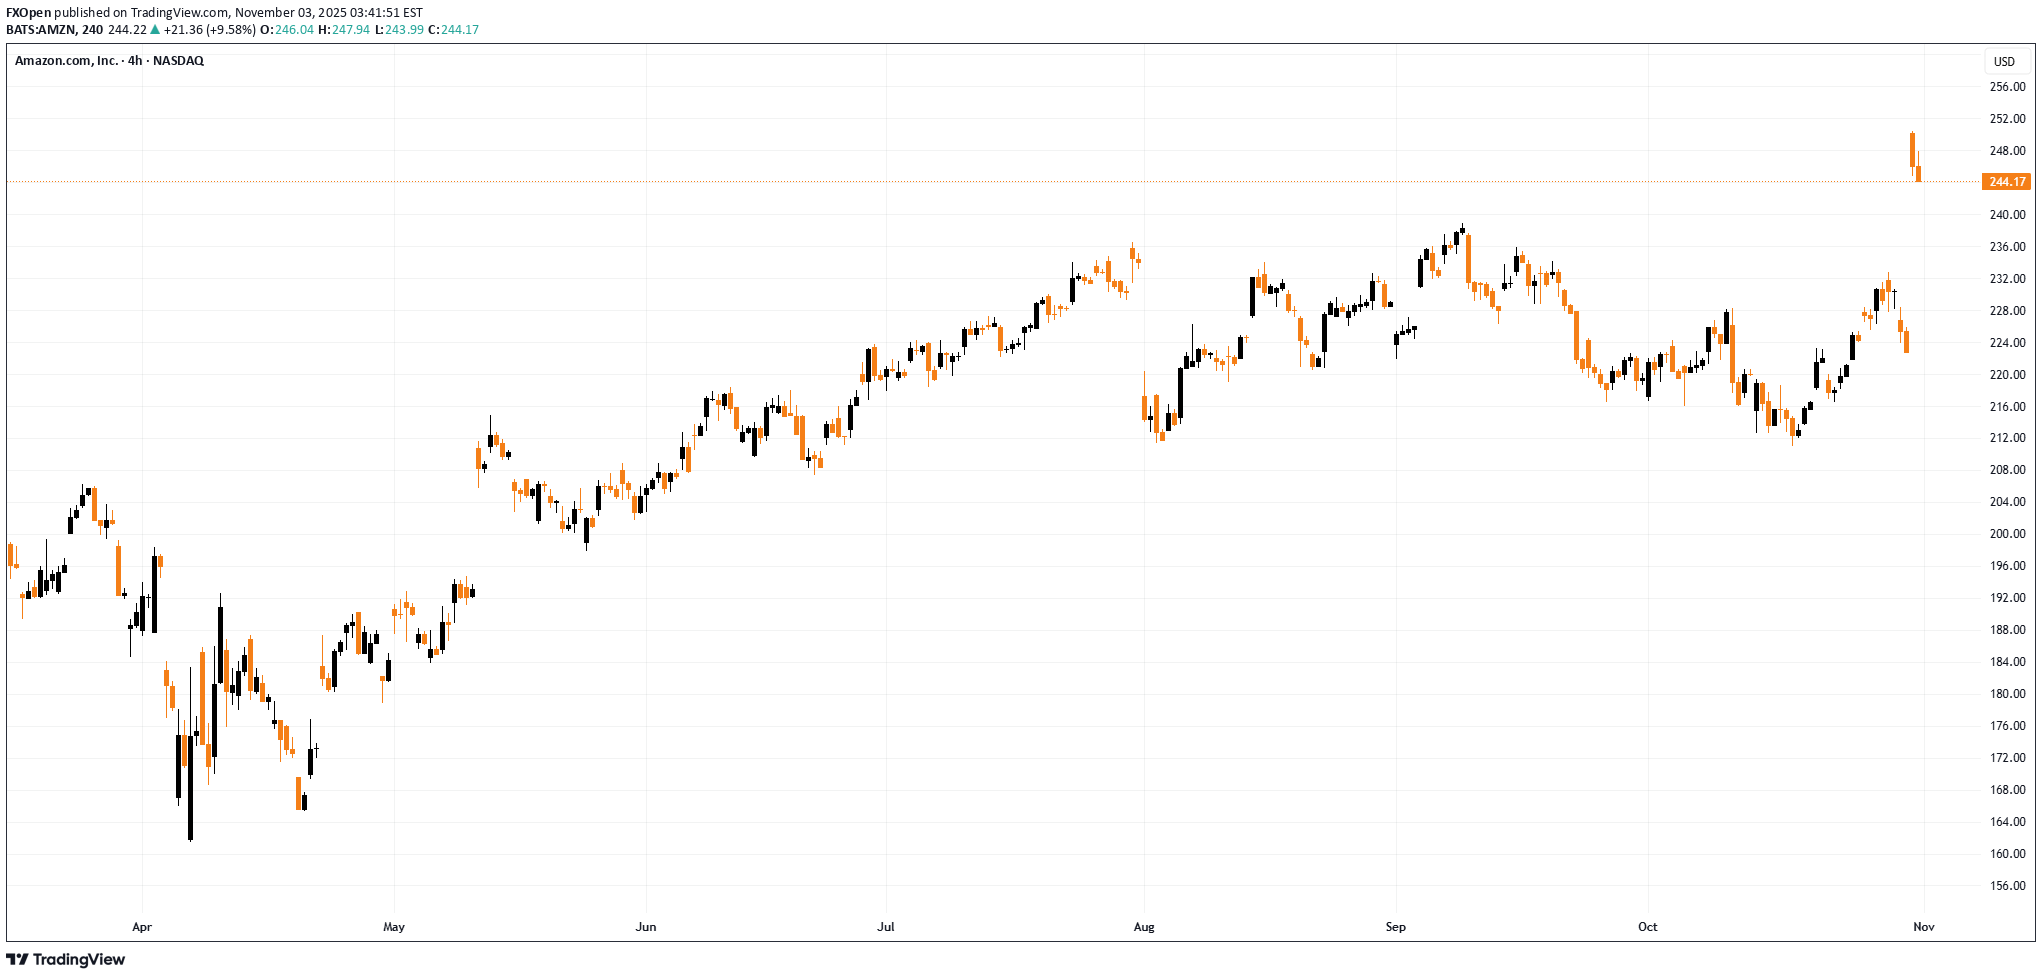
وصلت أسهم أمازون (AMZN) إلى 250 دولارًا لأول مرة کما یظهر الرسم البیانی، ارتفعت أسهم أمازون (AMZN) إلى مستوى قیاسی یوم الجمعة، حیث وصلت إلى مستوى 250 دولارًا للمرة الأولى. جاء ذلک بعد نشر تقریر أرباح قوی: ← الإیرادات: 180.2 ملیار دولار (بزیادة 13% على أساس سنوی). → ربحیة السهم (EPS): الفعلیة = 1.95 دولار، المتوقعة = 1.56 دولار (بنسبة فوز 25%). وقد تعززت معنویات المستثمرین بشکل أکبر من خلال ما یلی: ← ارتفعت إیرادات AWS (Amazon Web Services) بنسبة 20% على أساس سنوی، على الرغم من المنافسة من Microsoft Azure وGoogle Cloud. → أصدرت أمازون توقعات واثقة لربع العطلة (الرابع) الحاسم. التحلیل الفنی لمخطط أمازون (AMZN). عند تحلیل الرسم البیانی فی 24 سبتمبر، قمنا بما یلی: → استخدم تقلبات أسعار أسهم AMZN لبناء قناة صاعدة (کما هو موضح باللون الأزرق)؛ → لاحظت علامات الضعف المبکرة. بعد ذلک، وصل السعر إلى أدنى مستوى عند النقطة A - حیث وجد المضاربون على الارتفاع الدعم من الحد الأدنى للقناة وأدنى مستوى فی أغسطس (فی الواقع، کان هناک اختراق هبوطی کاذب) - وقاموا بمحاولة ناجحة لاستئناف الاتجاه الصعودی. تشیر الشمعتان red یوم الجمعة إلى أن رد الفعل الأولی على التقریر ربما کان مفرطًا فی التفاؤل (کما أکد مؤشر القوة النسبیة). لذلک، من الممکن أن یتبع ذلک تصحیح move - على سبیل المثال، نحو منطقة الدعم التی تشمل: → الخط المتوسط للقناة الحالیة؛ ← أعلى مستوى سابق على الإطلاق عند 242 دولارًا؛ ← أعلى مستوى فی سبتمبر عند 238 دولارًا أمریکیًا؛ → مستوى تصحیح فیبوناتشی 0.382 للموجة الدافعة A → B، حوالی 235 دولارًا. یمثل هذا المقال رأی الشرکات العاملة تحت العلامة التجاریة FXOpen فقط. لا ینبغی تفسیره على أنه عرض أو التماس أو توصیة فیما یتعلق بالمنتجات والخدمات التی تقدمها الشرکات العاملة تحت العلامة التجاریة FXOpen، ولا ینبغی اعتباره نصیحة مالیة.
FXOpen
سقوط ۱۱ درصدی سهام متا: چه چیزی پشت سرمایهگذاری عظیم زاکربرگ برای هوش مصنوعی است؟
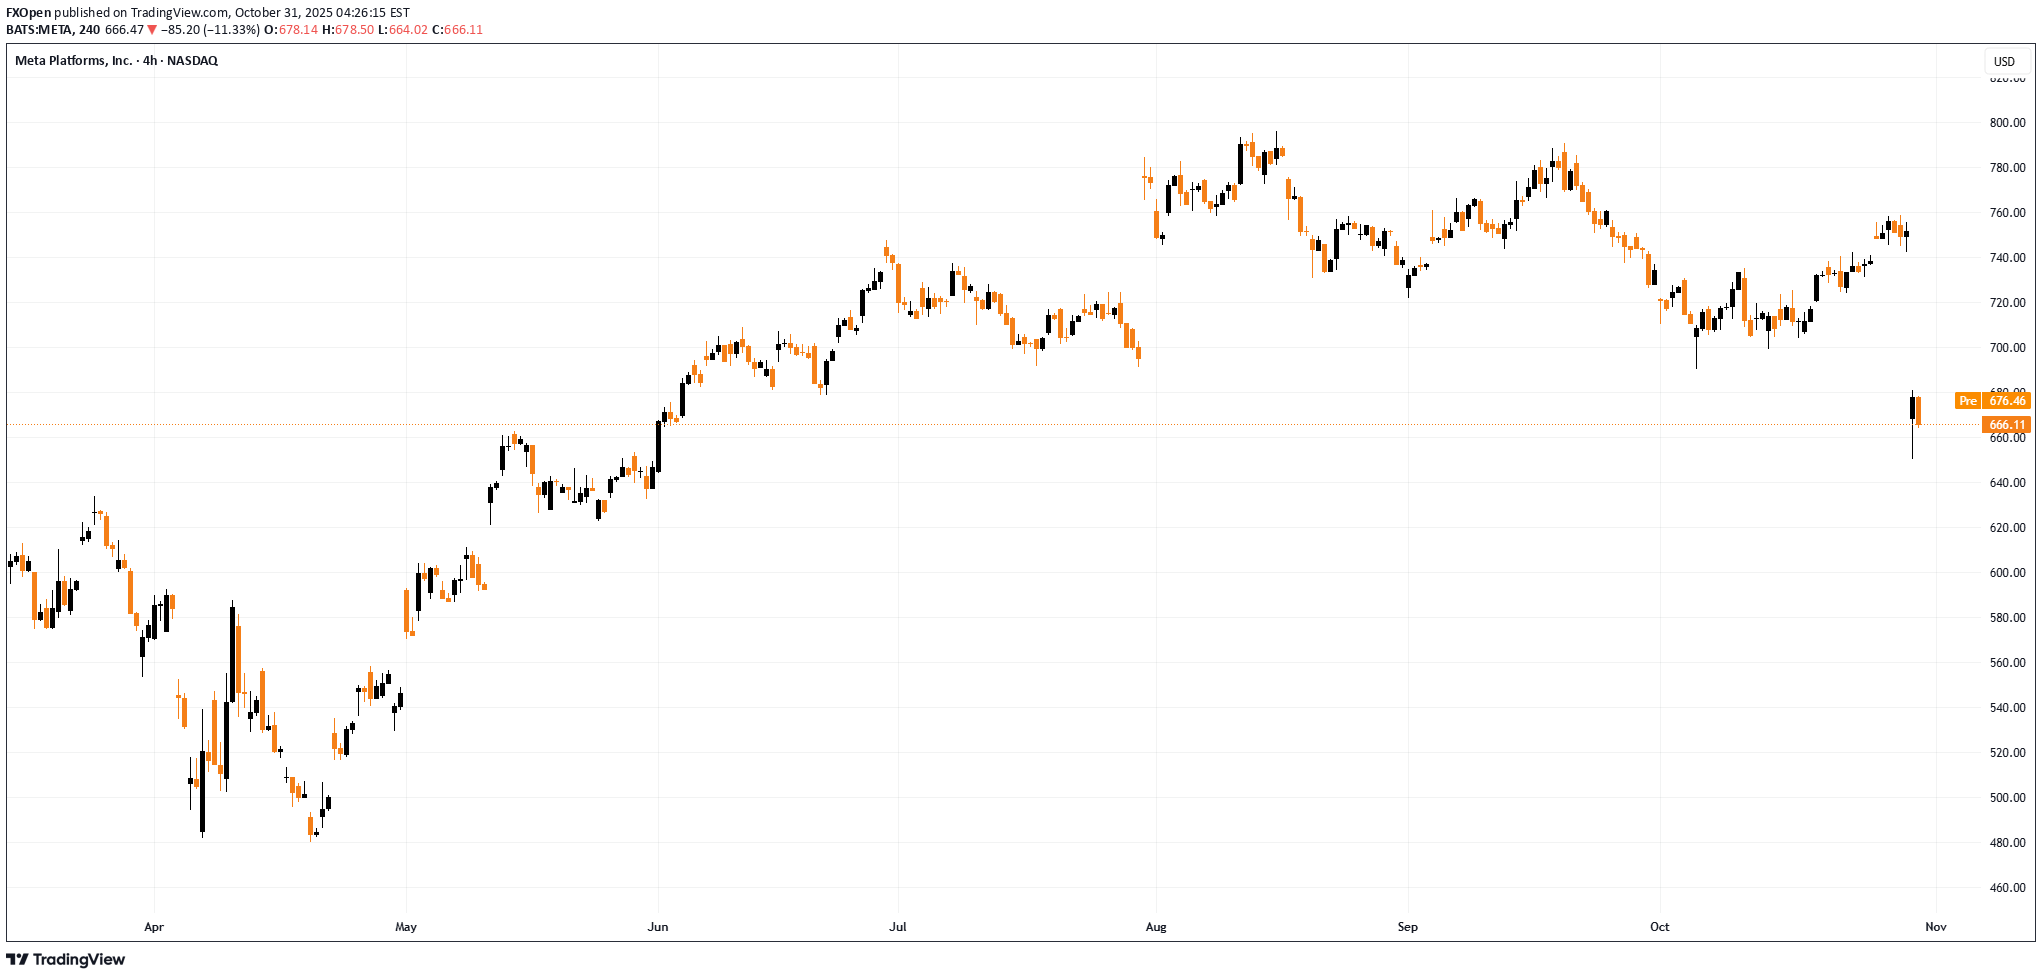
أسهم Meta Platforms (META) تنخفض بنسبة 11% أصدرت Meta Platforms (META) یوم الأربعاء تقریرها ربع السنوی، والذی تضمن العدید من النقاط الإیجابیة: ← ارتفعت الإیرادات إلى 51.2 ملیار دولار (التوقعات: 49.5 ملیار دولار)؛ ← ارتفع حجم الجمهور النشط یومیًا إلى 3.54 ملیار شخص. ومع ذلک، انخفض سعر سهم META إلى ما دون المستوى النفسی threshold البالغ 700 دولار، لیصل إلى أدنى مستوى له منذ خمسة أشهر تقریبًا. وقد نتج هذا الانخفاض عن مفاجأتین غیر سارة تم الکشف عنهما فی التقریر. الشطب الضریبی وفقًا لتقاریر وسائل الإعلام، بسبب التشریع الضریبی الأمریکی الجدید (المشار إلیه باسم "قانون الفاتورة الکبیرة الجمیلة")، سجلت الشرکة نفقات ضریبة الدخل لمرة واحدة بقیمة 15.93 ملیار دولار. وبسبب هذا الشطب، وصلت ربحیة السهم (EPS) إلى 1.05 دولار (کان المحللون یتوقعون 6.72 دولار). ومع ذلک، أوضحت الشرکة أنه باستثناء هذا البند لمرة واحدة، EPS کان من الممکن أن یکون 7.25 دولار، وهو ما کان سیمثل نتیجة قویة جدًا. النفقات المتعلقة بالذکاء الاصطناعی هناک عامل آخر ربما أثار قلق المساهمین وهو أن شرکة مارک زوکربیرج رفعت توقعاتها للإنفاق الرأسمالی لعام 2025 إلى 70-72 ملیار دولار. ستذهب هذه الأموال لبناء data مراکز وشراء شرائح AI. فی جوهر الأمر، تسعى Meta Platforms جاهدة إلى احتلال مکانة رائدة فی مجال AI وهی مستعدة لإنفاق عشرات الملیارات لتحقیق هذا الهدف. بالنسبة للمساهمین، هذا یعنی أنه حتى مع نمو الإیرادات، فإن صافی الربح یتآکل بسبب الإنفاق الضخم - ویظل من غیر الواضح متى ستؤتی هذه التکالیف ثمارها. التحلیل الفنی لمخطط META عند تحلیل مخطط META فی منتصف أغسطس، قمنا بما یلی: → رسم قناة صاعدة (کما هو موضح باللون الأزرق)؛ → علامات الضعف المشار إلیها (بما فی ذلک الفجوة الهبوطیة¹، الموضحة باللون البرتقالی)؛ ← أشارت إلى أن المیزان قد یتحول لصالح المضاربین على الانخفاض، مما قد یؤدی إلى تصحیح ملحوظ فی سعر سهم META. تم تنفیذ هذا السیناریو على شکل انخفاض من A → B. بعد الارتداد من الخط الرئیسی للقناة الزرقاء، ارتفع السعر نحو الفجوة الهبوطیة¹، مشکلاً قمة منخفضة C. ثم استمر الانخفاض movement، وتم تمدید القناة بقاع أدنى D. الفجوة الهبوطیة الکبیرة² التی تشکلت هذا الأسبوع یمکن أن تکون أیضًا أقل من 7> کمقاومة (کما فی الحالة السابقة)، ومن المرجح أن یکون هذا التأثیر أکثر وضوحًا بالقرب من المستوى النفسی 700 دولار. بشکل عام، تبدو الصورة سلبیة للغایة: → تسلسل الارتفاعات والانخفاضات المنخفضة A → D من المرجح أن یستمر مع قاع أدنى جدید F؛ → یبقى السعر فی النصف السفلی من القناة red، المرسومة على طول هذا التسلسل. من وجهة نظر صعودیة: ← 650 دولارًا بمثابة مستوى دعم نفسی؛ → إذا تم النظر إلى الارتفاع من أدنى مستوى فی أبریل إلى القمة A على أنه اندفاع، فإن الانخفاض A → F یقترب من 640 دولارًا، وهو ما یتوافق مع مستوى تصحیح فیبوناتشی 50٪. وبالنظر إلى ما سبق، فمن المعقول أن نفترض أن السوق سوف یعید الآن تقییم العوامل الجدیدة التی کشف عنها التقریر. من وجهة نظر الرسم البیانی، قد یعنی هذا فترة من التماسک، حیث یتقلب سعر سهم META بین خط المتوسط red ومستوى الدعم الحالی البالغ 650 دولارًا. یمثل هذا المقال رأی الشرکات العاملة تحت العلامة التجاریة FXOpen فقط. لا ینبغی تفسیره على أنه عرض أو التماس أو توصیة فیما یتعلق بالمنتجات والخدمات التی تقدمها الشرکات العاملة تحت العلامة التجاریة FXOpen، ولا ینبغی اعتباره نصیحة مالیة.
FXOpen
سهام انویدیا (NVDA) رکورد شکست: عبور تاریخی از مرز 200 دلار و راز جهش 500 میلیاردی!
أسهم Nvidia (NVDA) تتجاوز 200 دولار لأول مرة بالأمس، ارتفع سعر سهم Nvidia (NVDA) فوق المستوى النفسی threshold البالغ 200 دولار للمرة الأولى، مما دفع القیمة السوقیة للشرکة إلى ما یقرب من 5 تریلیون دولار. لماذا ارتفعت أسهم NVDA الیوم؟ هناک العدید من العوامل الصعودیة التی تدفع سعر سهم Nvidia إلى الارتفاع: ← تراکم کبیر للطلبات: أبلغت الشرکة عن طلبات مسبقة لمعالجاتها AI بقیمة إجمالیة مذهلة بلغت 500 ملیار دولار. → شراکة استراتیجیة مع الحکومة الأمریکیة: أعلن الرئیس التنفیذی جنسن هوانغ عن خطط لبناء سبعة أجهزة کمبیوتر عملاقة AI لوزارة الطاقة الأمریکیة. ← التوسع فی مجال الاتصالات: استثمرت Nvidia ملیار دولار فی شرکة Nokia، واستحوذت على حصة 2.9% فی الشرکة الفنلندیة لتطویر تقنیات AI-RAN و6G بشکل مشترک. التحلیل الفنی لإنفیدیا (NVDA) بالعودة إلى یوم 23 سبتمبر، حدد تحلیلنا لمخطط NVDA ما یلی: ← قناة صاعدة تحدد تحرکات أسعار السهم هذا الخریف؛ → اختراق من نمط العلم الصاعد (کما هو موضح فی red)؛ ← توقع أن الأساسیات القویة، والتقدم السریع للتکنولوجیا AI، والتوقعات بخفض سعر الفائدة الفیدرالی یمکن أن تمکن الثیران من التغلب على مستوى المقاومة البالغ 183 دولارًا واستهداف العلامة النفسیة البالغة 200 دولار. وقد تحقق هذا التوقع منذ: → کان مستوى اختراق العلم الصعودی بمثابة دعم (ممیز بخط أزرق غامق)؛ → وفرت تقلبات الأسعار فی NVDA نقاط ربط لتحسین القناة الحالیة. ما هو التالی لأسهم نفیدیا؟ لاحظ الفجوات الصعودیة (الممیزة بالأسهم) والتی تشیر إلى خلل فی توازن الطلب. قد یؤدی الزخم الصعودی المتزاید بسرعة إلى دفع سعر سهم NVDA نحو الحد العلوی للقناة، خاصة مع اقتراب العدید من الأحداث major الیوم: ← قرار سعر الفائدة الذی اتخذه بنک الاحتیاطی الفیدرالی والمؤتمر الصحفی اللاحق؛ → إصدارات الأرباح ربع السنویة من Microsoft (MSFT)، وAlphabet (GOOGL)، ومنصات Meta (META)، والتی من المتوقع أن تؤکد جمیعها التزامها بتطویر AI. یمثل هذا المقال رأی الشرکات العاملة تحت العلامة التجاریة FXOpen فقط. لا ینبغی تفسیره على أنه عرض أو التماس أو توصیة فیما یتعلق بالمنتجات والخدمات التی تقدمها الشرکات العاملة تحت العلامة التجاریة FXOpen، ولا ینبغی اعتباره نصیحة مالیة.
إخلاء المسؤولية
أي محتوى ومواد مدرجة في موقع Sahmeto وقنوات الاتصال الرسمية هي عبارة عن تجميع للآراء والتحليلات الشخصية وغير ملزمة. لا تشكل أي توصية للشراء أو البيع أو الدخول أو الخروج من سوق الأوراق المالية وسوق العملات المشفرة. كما أن جميع الأخبار والتحليلات المدرجة في الموقع والقنوات هي مجرد معلومات منشورة من مصادر رسمية وغير رسمية محلية وأجنبية، ومن الواضح أن مستخدمي المحتوى المذكور مسؤولون عن متابعة وضمان أصالة ودقة المواد. لذلك، مع إخلاء المسؤولية، يُعلن أن المسؤولية عن أي اتخاذ قرار وإجراء وأي ربح وخسارة محتملة في سوق رأس المال وسوق العملات المشفرة تقع على عاتق المتداول.