التحليل الفني WavePoint_FX تحليل حول رمز PAXG: شراء (17/12/2025) مُقتَرَح

WavePoint_FX
Elliott Wave Analysis XAUUSD – 17/12/2025
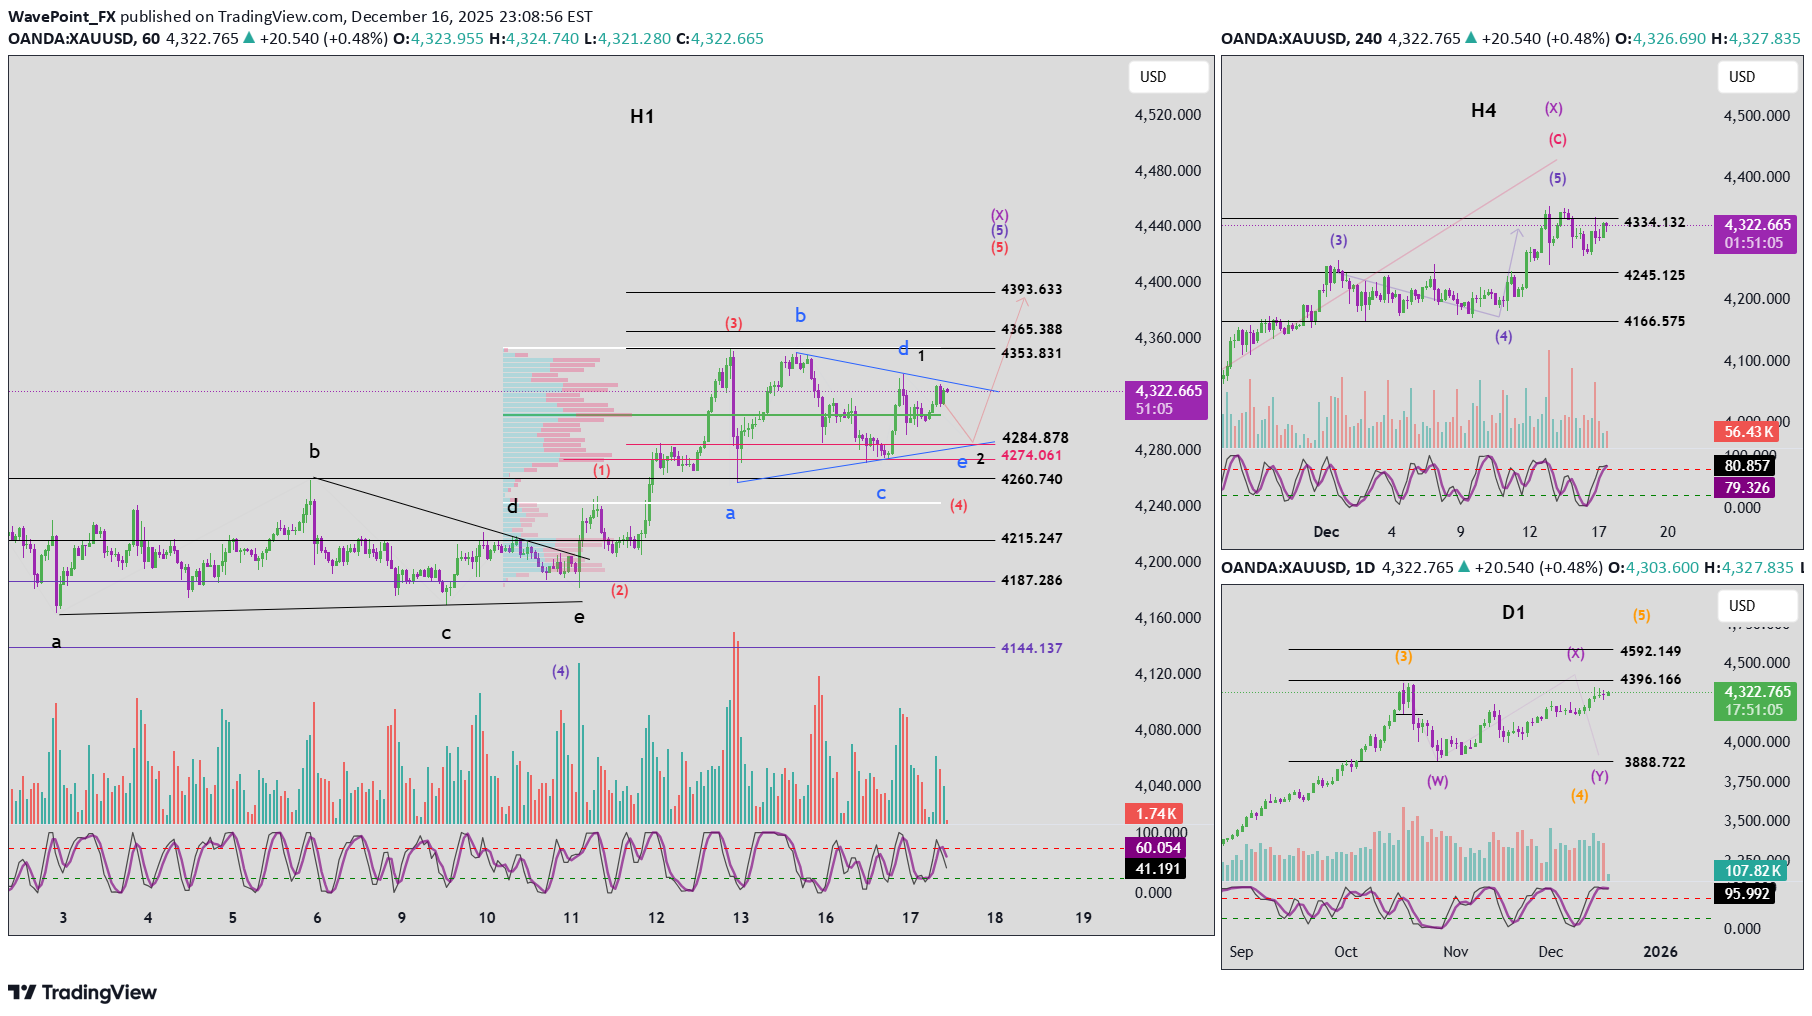
1. Momentum D1 (Daily) After the D1 candle closed, the daily momentum is currently compressed. This condition does not invalidate the ongoing bullish move, but it also does not confirm a reversal yet. We still need to wait for a clear momentum confirmation on D1. H4 H4 momentum is also compressing and showing early signs of a potential reversal. At this stage, there is no confirmed bearish H4 candle, so the correct approach is to remain patient and observe. H1 H1 momentum is weakening, suggesting that a short-term pullback or sideways movement may be developing on the H1 timeframe. 2. Elliott Wave Structure D1 Wave Structure The D1 wave count remains largely unchanged. With daily momentum still compressed, it is possible that price may produce one to two more bullish D1 candles. The upside target near 4396 is still valid to complete wave X. H4 Wave Structure Although H4 momentum has reached the overbought zone, price failed to break the previous high at 4354. This is an early warning signal that bullish momentum is weakening. While the signal is not yet strong enough to confirm a reversal, it supports the potential development of a bearish wave Y, as discussed in previous plans. H1 Wave Structure The failure of price to break the H4 high while momentum reached overbought creates two main scenarios on H1: Scenario 1 – Corrective triangle (abcde – blue): + Price may be in the final phase of a triangle correction. + If price drops below the lower boundary to complete wave e, the expected termination zone is around 4284. +Currently, price is still trading above the POC (green area), so it is possible that wave e has already completed. + In that case, a break above the b–d trendline would confirm a breakout entry. Scenario 2 – Impulsive 5-wave structure (1–2–3–4–5 – black): +Price is currently forming wave 2 (black). +The projected target for wave 2 is also near 4284. 👉 Key Confluence Zone: Both scenarios converge around 4284, making this area a high-probability Buy zone. ⚠️ Risk Note: If price closes below 4274, we must be prepared for a deeper downside scenario, and the current Buy plan should be reconsidered. 3. Trading Plan Buy Zone: 4285 – 4283 Stop Loss: 4273 Take Profit 1: 4329 Take Profit 2: 4353 Take Profit 3: 4365