التحليل الفني WavePoint_FX تحليل حول رمز PAXG: شراء (16/12/2025) مُقتَرَح

WavePoint_FX
Elliott Wave Analysis XAUUSD – December 16, 2025
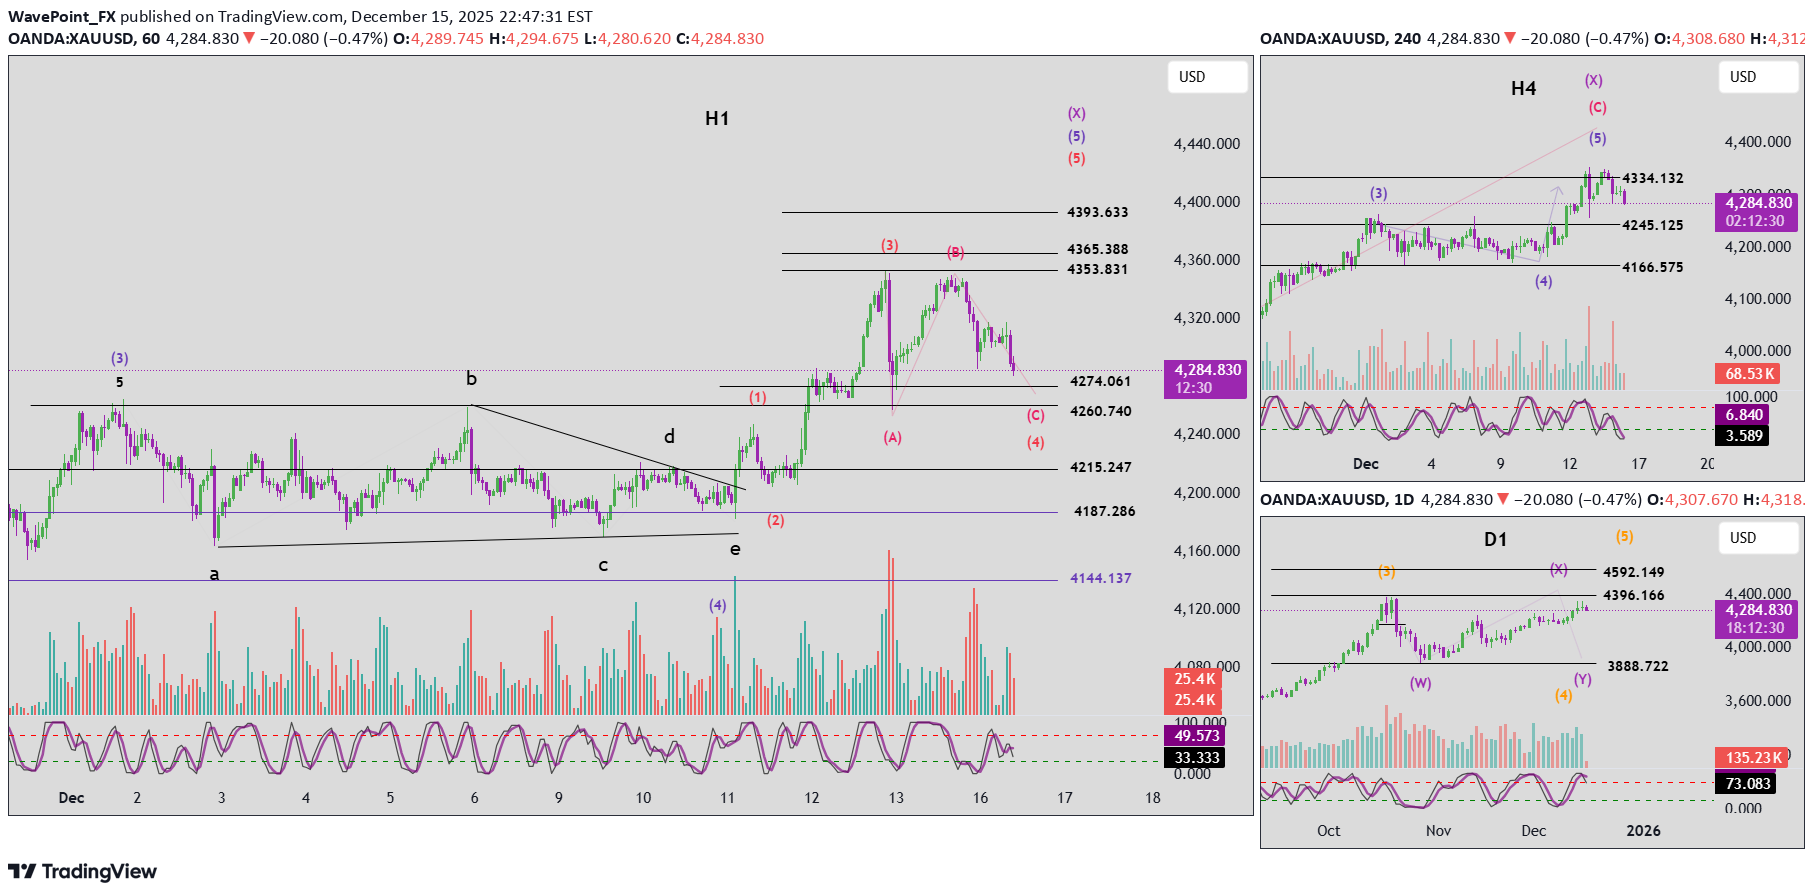
1. Momentum D1 (Daily): Daily momentum is showing signs of a bearish reversal. However, we must wait for today’s D1 candle to close to confirm this signal. This is a critical confirmation, as it will determine whether the market has formed a medium-term top. H4: H4 momentum is currently in the oversold zone and is preparing for a bullish reversal. Once confirmed, we can expect a technical rebound lasting approximately 4–5 H4 candles. H1: H1 momentum remains bearish and is moving toward the oversold area. We will wait for price to reach oversold conditions and for momentum to confirm a bullish reversal, which would signal a short-term H1 corrective rally. --- 2. Elliott Wave Structure D1: With D1 momentum turning down, if today’s daily candle confirms the reversal, price is likely forming the top of the purple wave X. After wave X completes, the market may enter purple wave Y, which is most likely developing as a Flat correction. → The projected target for wave Y is near the 3888 zone. H4: Price is currently trading within green wave 5. Once this wave 5 completes, it will also mark the completion of wave C and wave X on the higher timeframe. Given that H4 momentum is oversold, a short-term upward move is expected before the broader structure completes. H1: The current decline is likely forming a red 1–2–3–4–5 structure within green wave 5. At this stage, price is developing red wave 4. This red wave 4 is unfolding as a Flat corrective structure, consistent with the scenario outlined in yesterday’s plan. Target for red wave C: around 4260 Above this level, 4274 represents a high-liquidity / low-liquidity boundary Therefore, when price reaches the 4260–4274 zone, we will combine this area with H1 momentum bullish confirmation to look for long entries. Expected targets for red wave 5: Target 1: 4365 Target 2: 4393 3. Key Notes As discussed in previous plans, the recent rebound did not reach the 4353 level. This does not invalidate the scenario in which green wave 5 completes near this area (refer to the weekly plan). Therefore, if: D1 momentum confirms a bearish reversal at today’s close, and The upcoming H4 rebound fails to break above 4353, → We must be prepared for the scenario in which purple wave Y on the D1 timeframe has already begun. 4. Trading Plan Buy Zone: 4261 – 4259 Stop Loss: 4240 Take Profit 1: 4286 Take Profit 2: 4319 Take Profit 3: 4365