التحليل الفني WavePoint_FX تحليل حول رمز PAXG: بيع (14/12/2025) مُقتَرَح

WavePoint_FX
تحلیل موج الیوت طلا (XAUUSD): سیگنال ریزش در راه است؟ (هفته سوم دسامبر ۲۰۲۵)
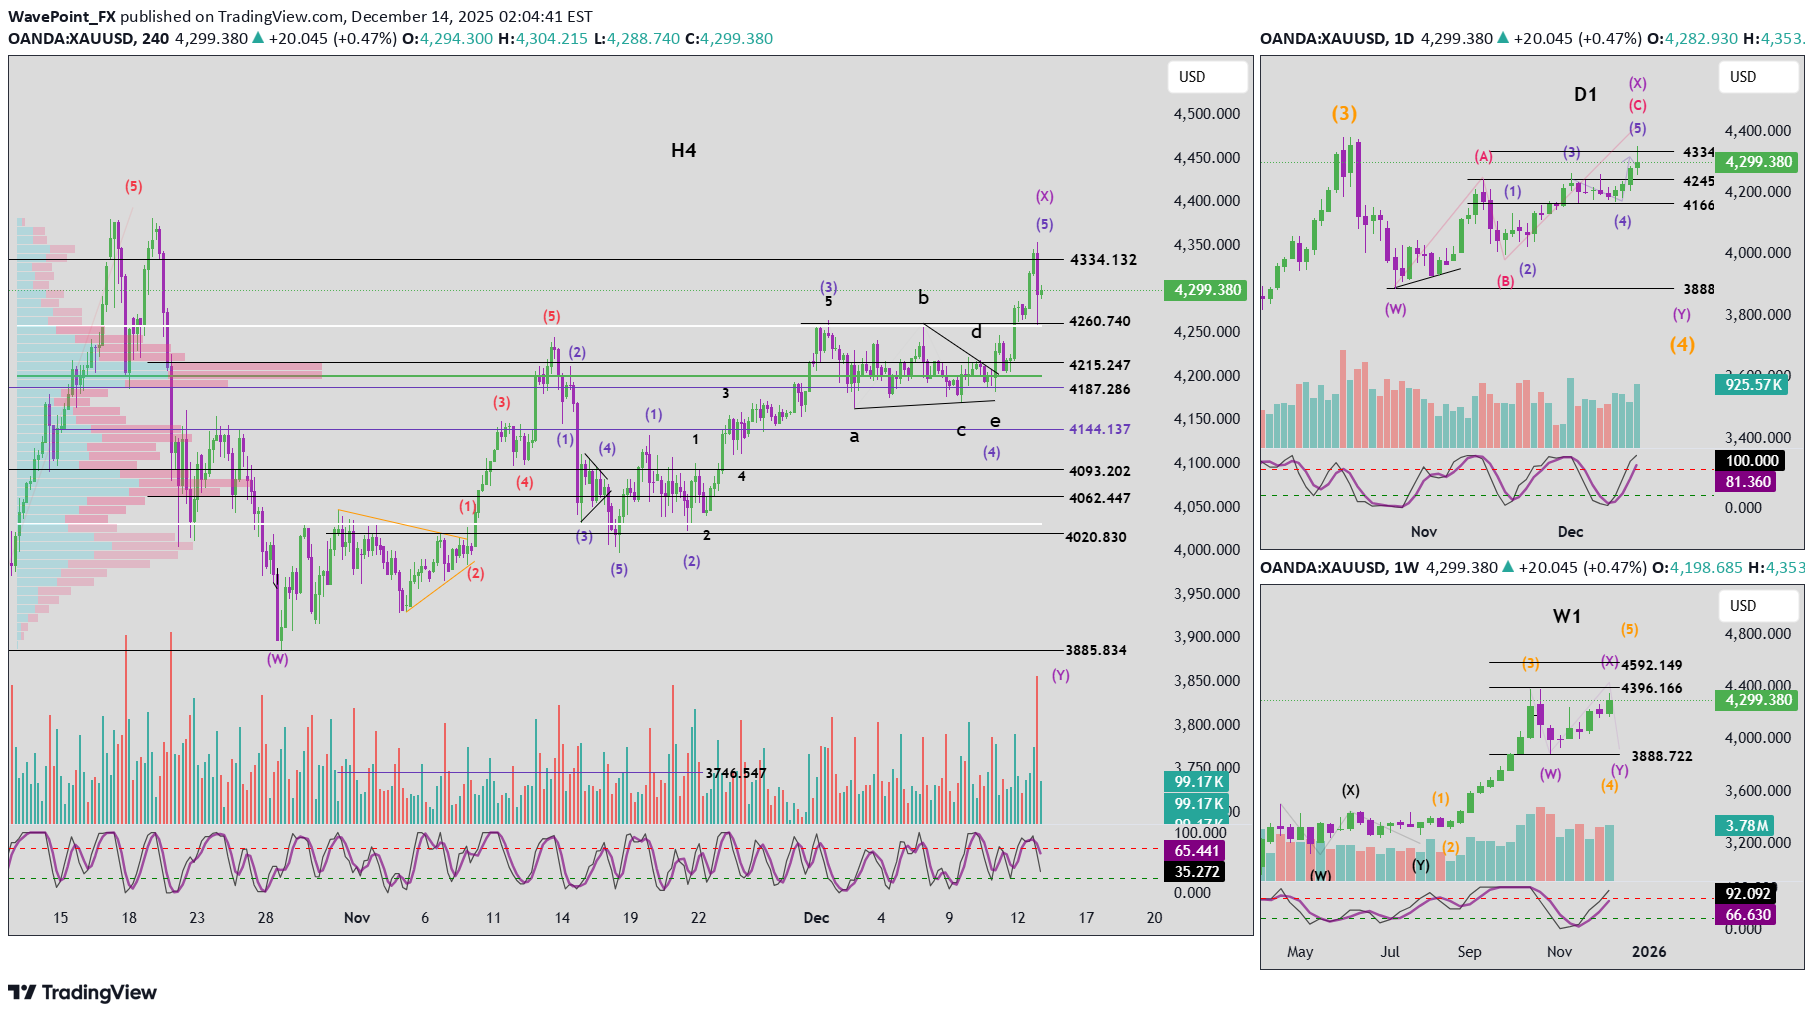
1. Momentum Weekly (W1): Weekly momentum is approaching the overbought zone. There is a high probability that in the coming week, W1 momentum will enter the overbought area and start showing signs of a bearish reversal. Daily (D1): D1 momentum is currently in the overbought zone and preparing to turn down. We need confirmation from a clear bearish D1 candle. Once confirmed, the market is likely to enter a corrective move lasting approximately 4–5 days. H4: H4 momentum has already turned bearish. However, it still needs around 2–3 more H4 candles to reach the oversold zone, indicating that short-term downside momentum remains intact. 2. Elliott Wave Structure Weekly Timeframe (W1) On the weekly chart, wave X (purple) appears to be in its final phase. Price is currently trading near the base of wave W, suggesting a high probability that this structure is forming a flat correction. Key characteristics of a flat pattern: - Price can retrace back to the origin of wave W. - It may even exceed the W low/high and create a marginal new extreme. - However, this breakout is typically limited before price reverses to complete wave Y. In the current context, weekly momentum has not yet confirmed a bearish reversal. Therefore, the possibility of one final upward push in wave X cannot be ruled out before a larger decline begins. Daily Timeframe (D1) On the daily chart, wave X (purple) is developing as an ABC structure. At present: - The red wave C has already completed a 5-wave internal structure. - Price is now trading within the green wave 5 of wave C. With D1 momentum already in the overbought zone, there is a high probability that green wave 5 is nearing completion. Once this wave ends, price is expected to decline to form wave Y. However, an important caution remains: - D1 momentum has not yet confirmed a bearish reversal. - Therefore, attempting to catch the exact top of wave X carries risk. - As discussed on the weekly timeframe, flat corrections can allow price to equal or slightly exceed the wave W level before reversing. H4 Timeframe Looking more closely at the H4 structure: - The 5-wave sequence (1–2–3–4–5 in green) within the red wave C has completed. - Wave 5 reached its projected target near 4334, after which price started to decline sharply. H4 momentum still requires 2–3 candles to reach oversold conditions, suggesting: - The current bearish leg still has room to extend. - The most probable scenario is a continuation lower toward the POC zone (green line) around 4215 – 4187, followed by a corrective bounce. If this scenario unfolds: - The current decline is likely forming wave 1 down of a new 5-wave structure for wave Y. - The subsequent recovery would be wave 2, typically unfolding as an ABC corrective move. - This wave 2 rally would provide a high-probability sell opportunity, especially if H4 momentum rebounds into the overbought zone again. 3. Key Notes & Risk Awareness One critical point to emphasize: - Weekly momentum is preparing to enter the overbought zone and potentially reverse. - Daily momentum is already overbought. - This momentum confluence suggests that the coming decline could be more extended, aiming to push weekly momentum back toward oversold conditions. In practice, weekly momentum often requires multiple oscillations (commonly around three reversals) to complete a full corrective cycle. Therefore: - Patience is essential during this phase. - Avoid prematurely adopting a long-term bullish bias. - Always wait for price action confirmation. This analysis represents a directional warning and scenario planning only. All expectations must be confirmed by real-time price behavior. 4. Conclusion For the upcoming week, the primary bias favors a bearish corrective phase. Detailed trading plans (entries, stop loss, and targets) will be updated daily as new price data becomes available.