تحليل التحليل الفني WavePoint_FX حول PAXG في رمز في 30/7/2025

WavePoint_FX
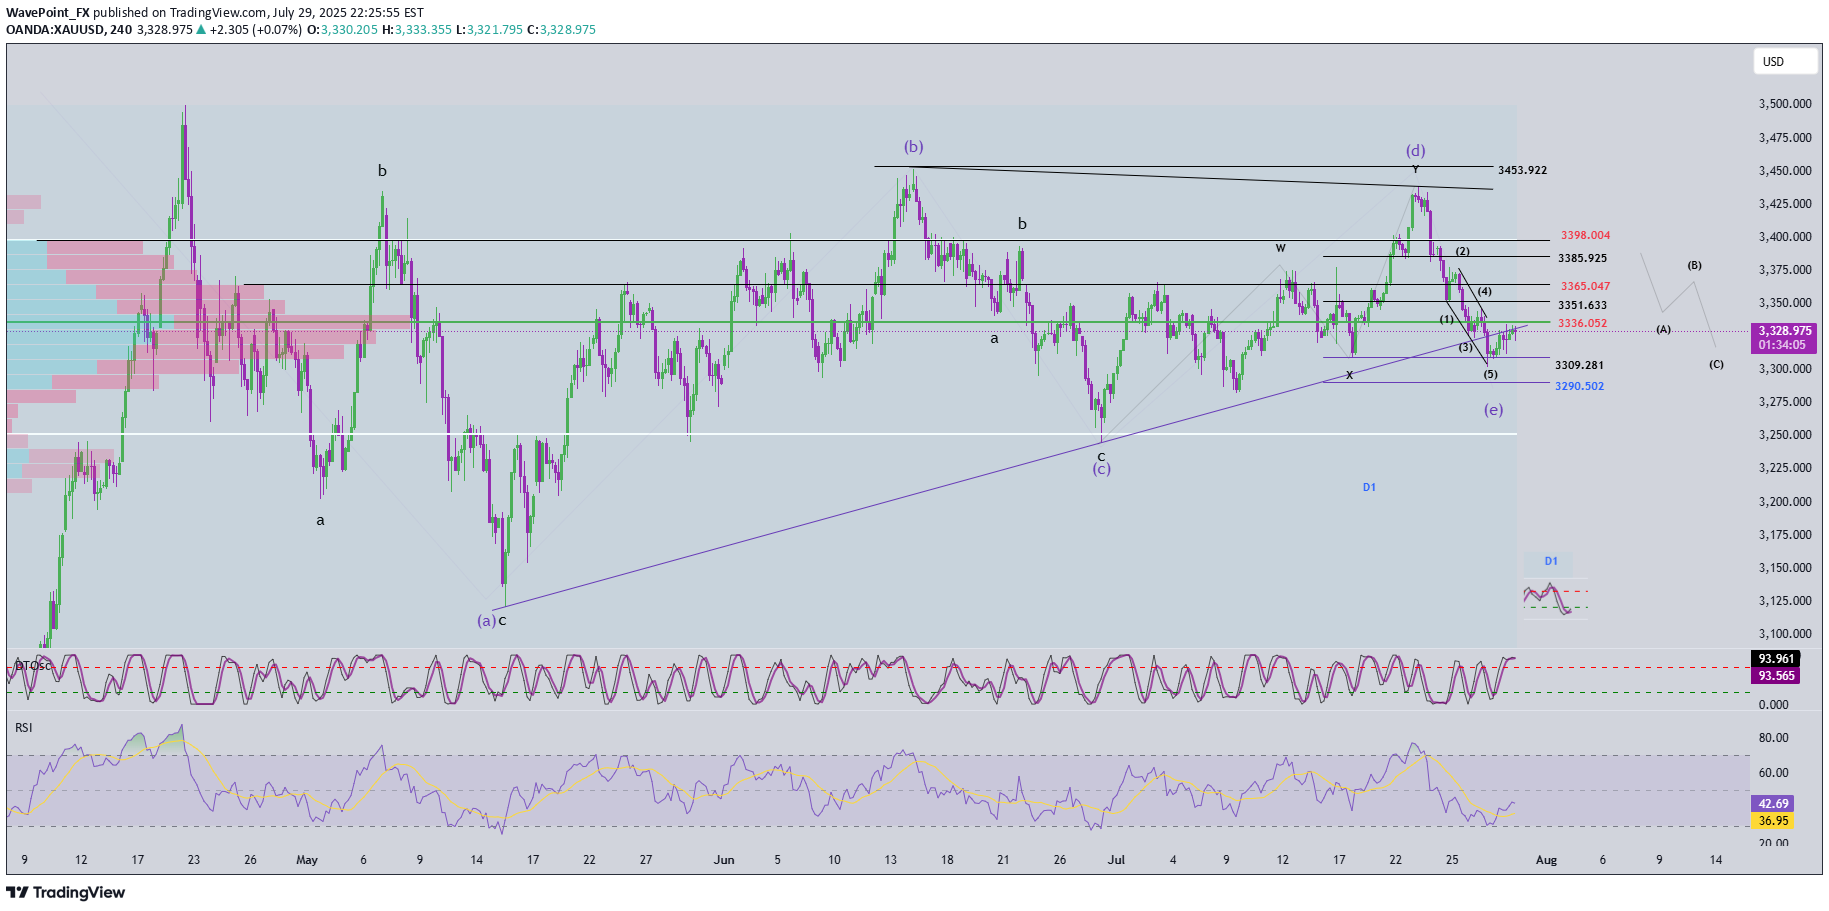
📊 🔍 Momentum Analysis • D1 Timeframe: Momentum has started to reverse upward, but we need to wait for today’s daily candle to close for confirmation. Until then, there is still a risk of another short-term decline. • H4 Timeframe: Momentum lines are clustering in the overbought zone, signaling a possible weakening of the current upward move. However, this signal alone is not enough to confirm that the uptrend has ended. ________________________________________ 🌀 Wave Structure • Price has reached the projected target for wave e, but there has been no strong bullish reaction. The recent candles are short-bodied and overlapping – typical of corrective structures. Also, this wave has lasted longer than previous corrective upswings, suggesting that the decline may not be over yet and the wave count needs to be reviewed. Currently, we are facing two equally probable scenarios (50/50), but they suggest opposite outcomes: ➤ Scenario 1: Zigzag (5-3-5) Structure • The current structure may represent only wave A of a larger zigzag. • We are now in wave B, which tends to be complex and unpredictable, making it not ideal for wave-based trading. • The red zones marked on the chart indicate potential target areas for wave B. ➤ Scenario 2: Completed 5-Wave Correction • The downtrend may have completed at wave (e). • The current upward movement could be wave 1 forming as a triangle – a potential start of a new bullish cycle. • However, to confirm this scenario, price must hold above 3309. If it fails to do so and H4 momentum reverses downward, a new low is very likely. ________________________________________ 📝 Trading Plan Given the current market conditions, I only recommend short-term scalp trading based on the predefined support and resistance zones. Avoid wave-based trading until the structure becomes clearer. Once clarity returns, I will provide an updated trading plan.
