التحليل الفني WavePoint_FX تحليل حول رمز PAXG: شراء (28/7/2025) مُقتَرَح

WavePoint_FX
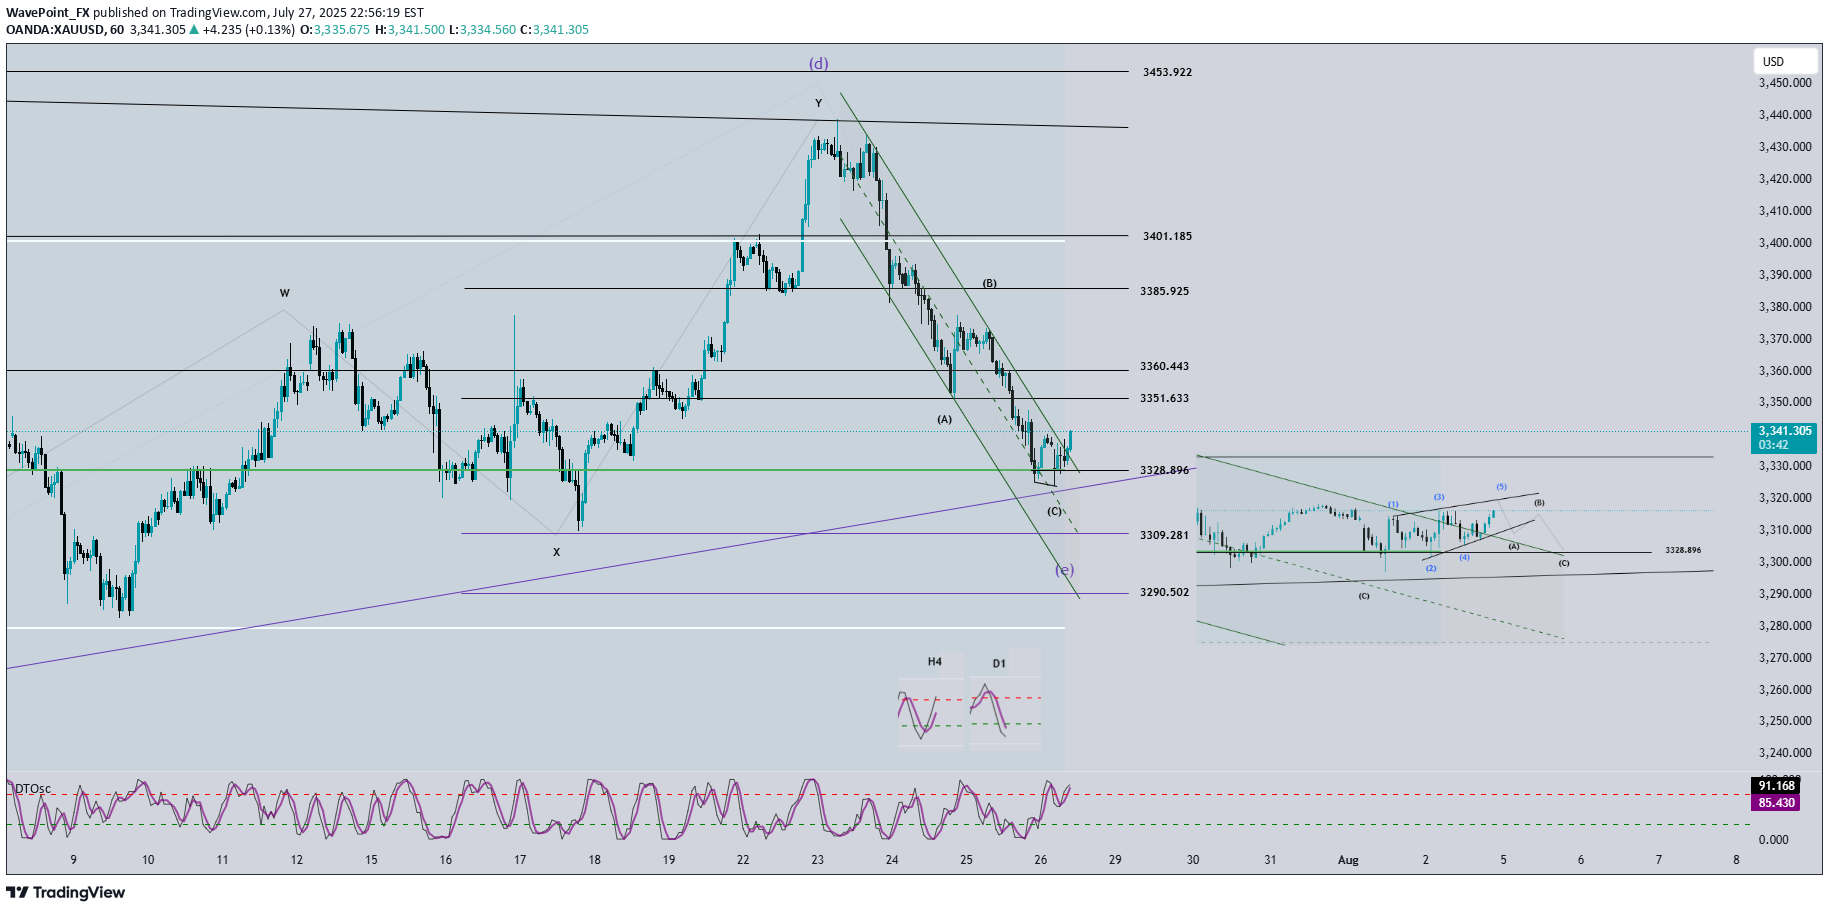
📊 ________________________________________ 🔍 Momentum Analysis: • D1 Timeframe: Momentum has entered the oversold zone. This strongly suggests a potential bullish reversal today, which could lead to a rally or sideways movement lasting around 4–5 days. • H4 Timeframe: Momentum is reversing upward. This indicates a likely bullish or sideways move in the short term, at least until momentum reaches the overbought zone (estimated within the next 2 H4 candles). • H1 Timeframe: Momentum is currently overbought, so we may first see a pullback or sideways movement until a clearer reversal signal appears. ________________________________________ 🌀 Wave Structure Analysis: • On the H4 chart, as noted in previous plans, the assumption that price is forming a contracting triangle (abcde) is still valid. Price is currently in the final leg (wave e) of this triangle. • On the H1 chart, we can observe a channel structure, within which an abc corrective pattern is unfolding. • The lower boundary of the triangle (marked by the green trendline) combined with support zones will be critical areas to monitor for the end of wave e. 🔺 Note: Wave e does not necessarily end precisely at the triangle boundary – it can slightly overshoot. Hence, we’ll rely on smaller wave structures to identify potential reversal zones. ________________________________________ 🎯 Key Price Zones to Watch: • Target 1: 3329 • Target 2: 3309 • Target 3: 3290 ________________________________________ 🔎 Lower Timeframe Structure (M10): From the current price action (as shown in the chart), we can see a leading diagonal triangle structure forming. This is a pattern commonly seen in wave 1. If this pattern is confirmed, a sharp and steep decline toward the 3329 zone is likely. ________________________________________ ⚖️ Combining Momentum & Wave Structure: • D1: Signals a potential reversal → favors Buy setups. • H4: Momentum is rising, but price hasn’t confirmed a new bullish trend → need to stay alert and tighten Stop Loss. • H1: Overbought + possible leading diagonal → Expecting a pullback for wave 2 toward 3329 → this would be the optimal Buy zone. ________________________________________ 🧭 Trade Plan: • For experienced traders: → Wait for price to reach key levels and watch for reversal signals before entering. • For beginners: → Use the following Limit Buy setup: ✅ Setup 1: • Buy zone: 3330 – 3328 • Stop Loss: 3320 • TP1: 3351 • TP2: 3370 • TP3: 3385 ✅ Setup 2: • Buy zone: 3310 – 3308 • Stop Loss: 3300 • TP1: 3328 • TP2: 3351 • TP3: 3370
