التحليل الفني ydnldn تحليل حول رمز PENDLE: شراء (22/7/2025) مُقتَرَح

ydnldn
PENDLEUSDT
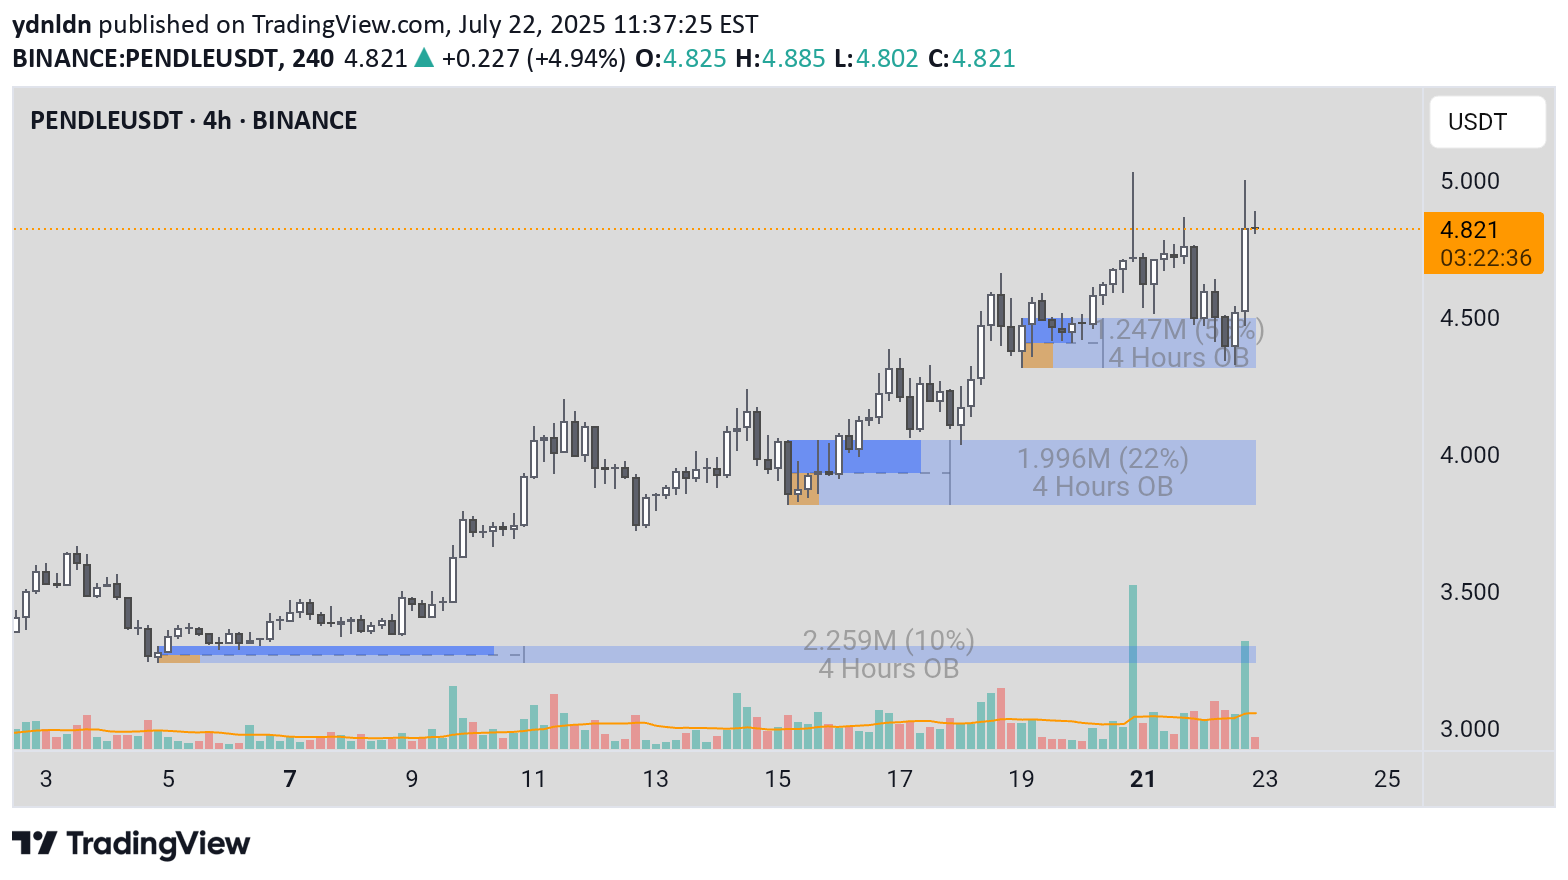
Detailed Analysis of PENDLE/USDT 4-Hour (4h) Chart Here is a structured insight and interpretation of the PENDLE/USDT chart as of July 22, 2025, to support trading decisions. 1. Chart Type and Instrument * Chart Type: The presented chart is a Candlestick Chart. * Instrument: The traded asset is PENDLEUSDT on the Binance exchange. * Timeframe: The analysis is conducted on the 4-Hour (4h) timeframe, which is ideal for identifying short to medium-term trading opportunities (swing trading). 2. Identification of General Trend This chart clearly displays two contrasting trend phases: * Downtrend and Accumulation (Late June - Early July): In the first half of the chart, PENDLE was in a downtrend, which then slowed down and transitioned into a consolidation or accumulation phase around the $3.100 - $3.400 price level. The price failed to make a new low, signaling a weakening of selling pressure. * Strong Uptrend (Starting July 9 - Present): Around July 9, a significant trend reversal occurred. The price successfully broke out of the accumulation zone and initiated a very strong and structured uptrend. This is confirmed by a consistent series of higher highs and higher lows. 3. Support and Resistance Levels (based on Order Blocks) The chart analyst has marked key levels using the Order Block (OB) concept, which indicates zones of high liquidity. * Support (Demand Zone): * $4.500 - $4.700 (Blue OB): This is the nearest and most relevant support zone at the moment. The price is currently consolidating just above this area after an impulsive upward move. * $3.900 - $4.100 (Blue OB): This was a crucial previous support zone. The price bounced strongly from this area around July 18-19, which became the launchpad for the move to the current level. * $3.100 - $3.250 (Blue OB): The foundation of the entire uptrend. This is the origin demand zone where buying pressure first took dominant control. * Resistance (Supply Zone): * $5.300 - $5.600 (Orange OB): This is the major resistance zone above the current price. This area is likely the primary target for buyers and represents a significant hurdle where selling pressure is expected to increase. 4. Price Patterns and Key Events * Market Structure Shift (July 9): The strong upward price movement on July 9 definitively broke the previous downtrend structure. This was the first and most important signal that market sentiment had shifted from bearish to bullish. * Bullish Consolidation: The current price action (July 21-22), which is moving sideways above the $4.500 support zone, is forming a bullish consolidation pattern. This pattern is often a pause phase where the market "takes a breath" before continuing its primary trend. * Respecting Demand Zones: The chart shows that the price highly respects the marked demand zones. Each time the price corrected back to one of the blue zones (Order Block), buyers stepped in and pushed the price higher, confirming the strength of these zones. 5. Use of Technical Indicators * Volume: A noticeable increase in volume occurred during the initial breakout (around July 9) and on each subsequent impulsive upward leg. This indicates strong participation and commitment from buyers, which validates the strength of the uptrend. * Order Blocks (OB): The primary indicator on this chart is the visualization of the Order Block zones. The blue zones (Demand) act as support floors, while the orange zone (Supply) acts as a resistance ceiling. The success of this strategy relies on the price reaction upon entering these zones. Rationale for Entry Decision (Case Study) Based on the current market conditions on the chart, a logical entry opportunity (buy position) can be considered based on the consolidation pattern above the support. An entry could be made around the $4.700 - $4.850 level for the following reasons: * Following the Dominant Trend: A buy position aligns with the primary trend, which is strongly bullish, thereby increasing the probability of a successful trade. * Confirmation of Strong Support: The price is currently holding firm above the demand zone (Demand OB) at $4.500 - $4.700. This indicates that buyers are successfully absorbing selling pressure and defending a new, higher support level. * Continued Accumulation Pattern: The current price consolidation can be interpreted as a re-accumulation phase before the next leg up. Entering during this phase allows a trader to get in before the next potential impulsive move. * Defined Risk Management: A buy position at this level allows for a clear and logical placement of a stop loss, for instance, just below the blue support zone (e.g., at $4.450). If the price breaks this level, the short-term bullish scenario would be invalidated. * Favorable Risk/Reward Ratio: With a defined risk, the primary profit target is the overhead resistance zone at $5.300 - $5.600. This offers a potential reward that is significantly greater than the risk. Risks and Factors to Watch For * Consolidation Failure: There is a risk that this consolidation pattern fails and the price breaks down below the $4.500 support zone instead. If this happens, the price will likely seek lower support around the $4.000 level. * Exhaustion (Market Fatigue): Although the trend is strong, a rapid ascent can lead to buyer exhaustion. Watch for signs of weakening momentum as the price approaches its previous high around $5.100. * Major Resistance Ahead: The supply zone at $5.300 - $5.600 is a very significant obstacle. Traders should be wary of a potential sharp reversal or large-scale profit-taking in that area.