التحليل الفني WavePoint_FX تحليل حول رمز PAXG: شراء (16/7/2025) مُقتَرَح

WavePoint_FX
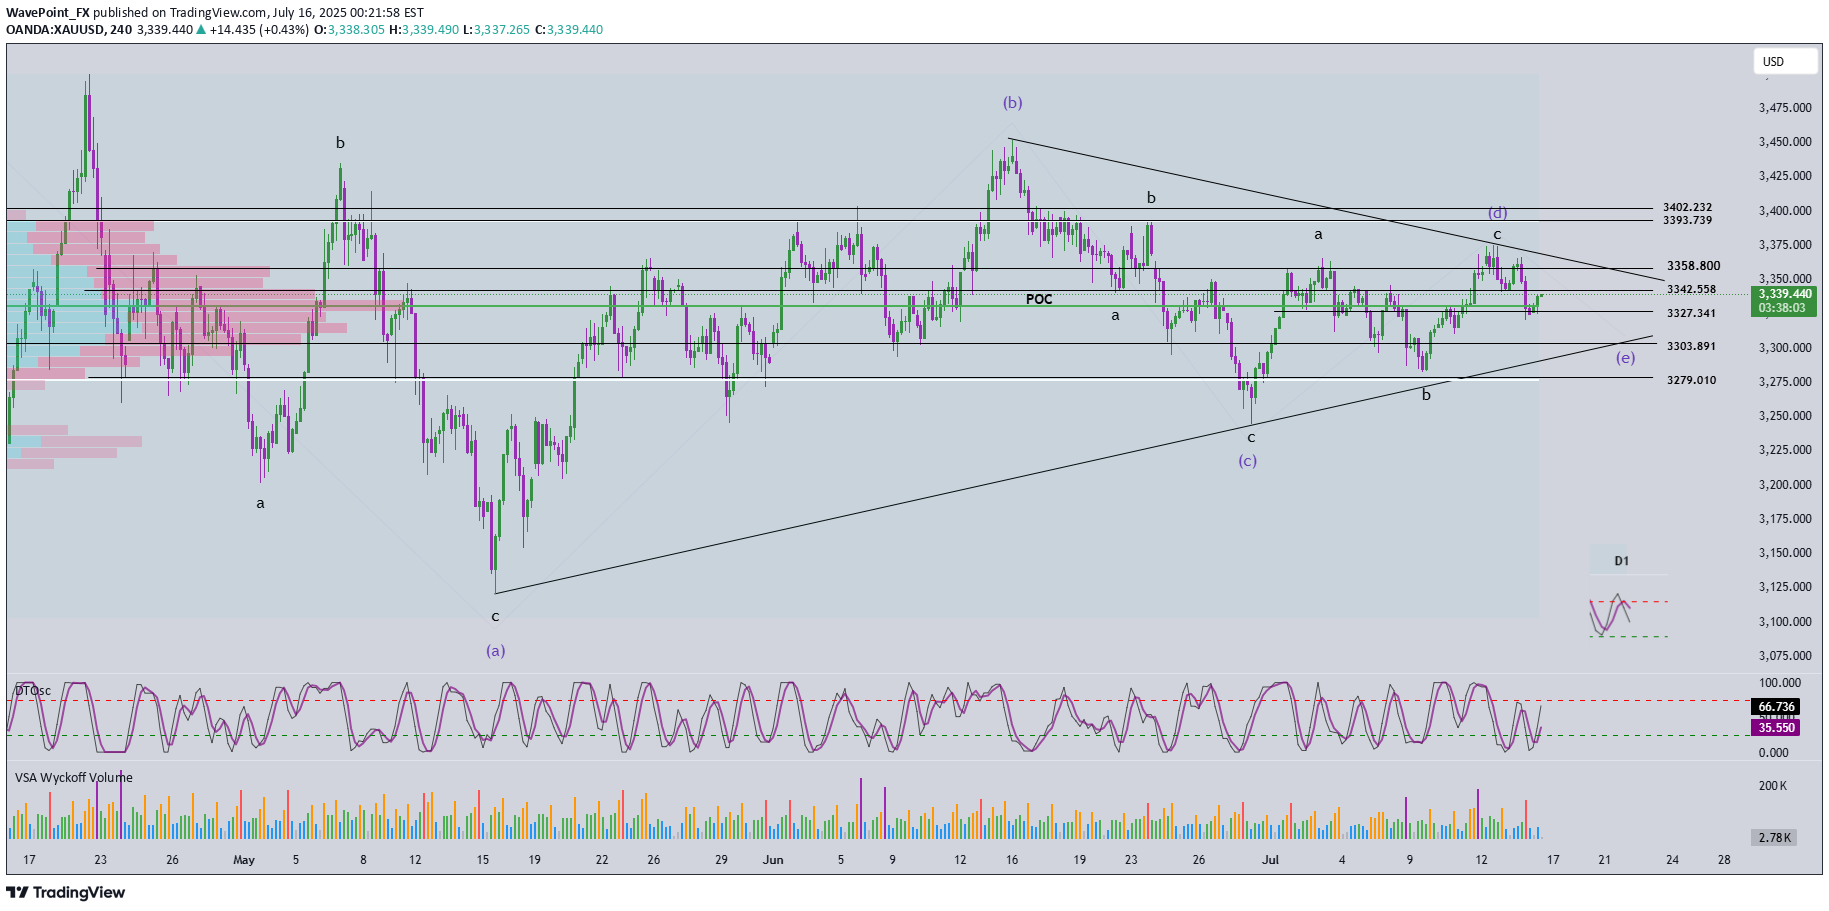
🔄 Momentum Analysis D1 timeframe: Momentum is currently reversing to the downside, suggesting that the price may continue to decline or move sideways in the short term. H4 timeframe: Momentum is rising, indicating that the current recovery may continue. The next resistance zones to watch are 3342 and 3358. 🌀 Elliott Wave Structure At present, price action is being compressed within a contracting triangle corrective pattern, with its range narrowing further—signaling market consolidation. We should closely monitor for signs of a breakout that could end this correction. Based on the current wave structure, it is expected that wave d (green) has completed, and the current downward move is likely part of wave e (green). The trading strategy focuses on waiting for the price to approach the lower boundary of the triangle—drawn from the low of wave a to the low of wave c—looking for confluent support areas near this trendline to identify a potential BUY opportunity. 🎯 Target & Trade Plan BUY ZONE: 3303 – 3300 Stop Loss (SL): 3290 Take Profits (TP): - TP1: 3327 - TP2: 3358 - TP3: 3402
