التحليل الفني WavePoint_FX تحليل حول رمز PAXG: شراء (10/7/2025) مُقتَرَح

WavePoint_FX
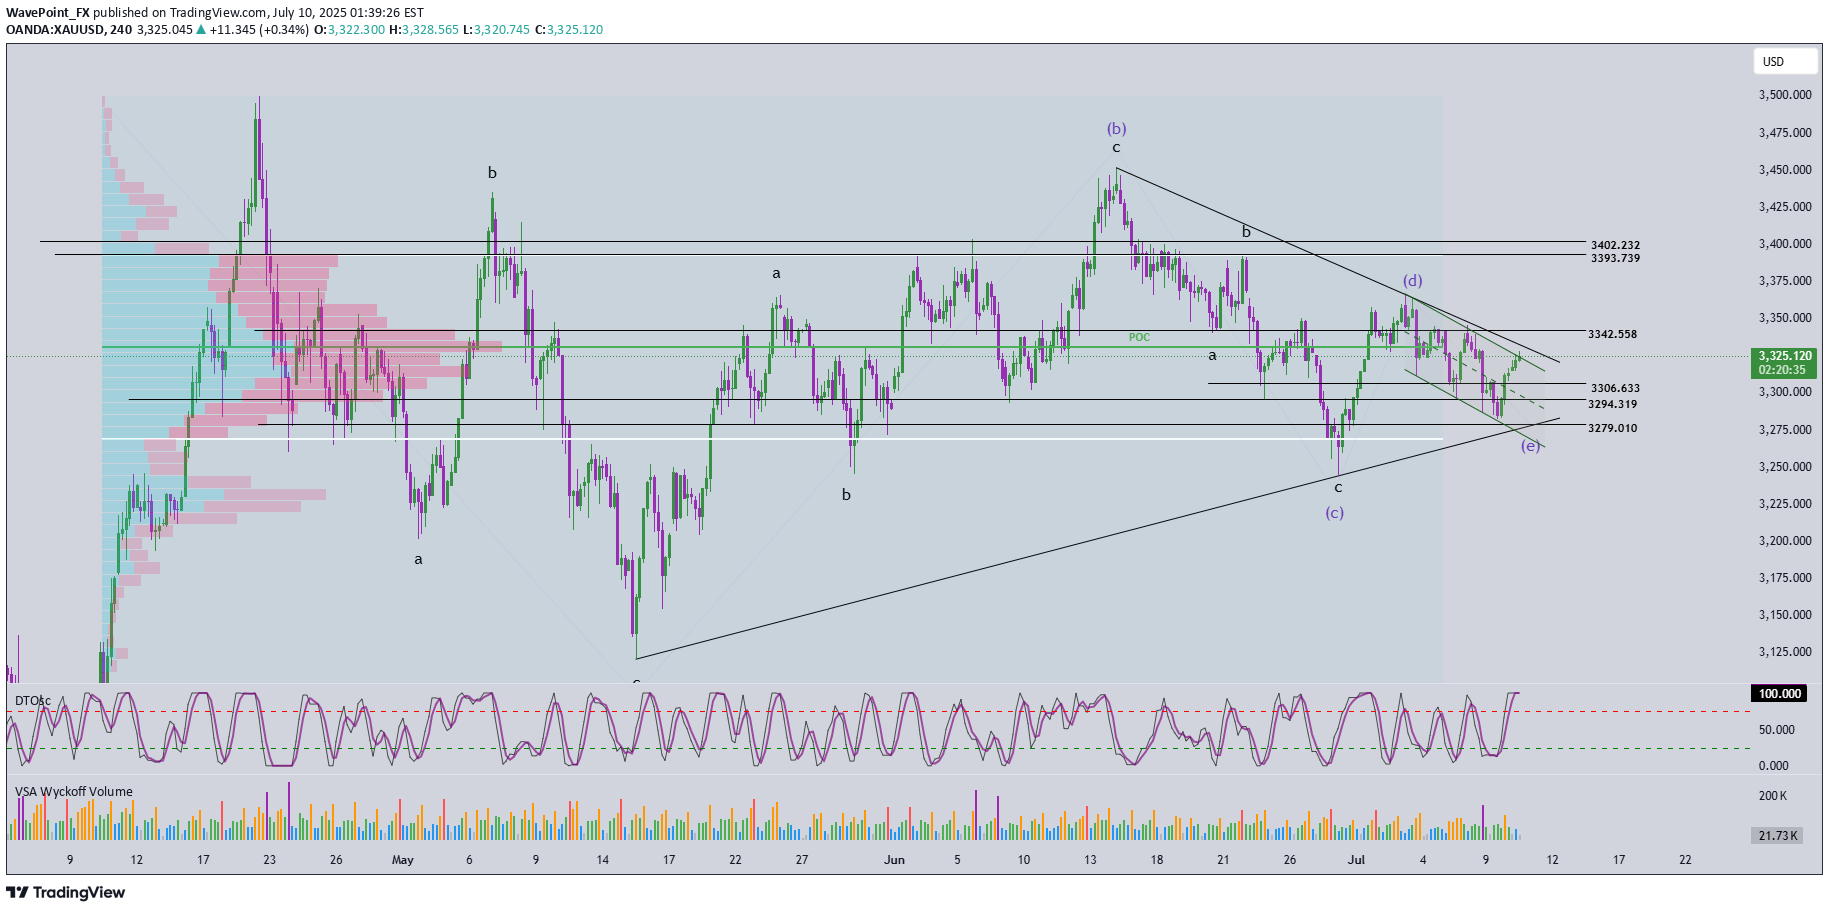
🌀 Elliott Wave StructureOn the H4 timeframe, price has returned to test the upper boundary of the converging triangle – currently acting as dynamic resistance. Based on the current wave count, wave e (purple) may have completed at the 3279 low, and price is potentially starting a breakout move.👉 A confirmed breakout above the triangle would validate the end of the abcde correction and mark the beginning of a new upward trend.🔋 Momentum AnalysisD1 timeframe: As forecasted yesterday, momentum is entering oversold territory and showing early signs of a reversal. This suggests that an upward trend could dominate over the next 5 days.H4 timeframe: The two momentum lines are sticking together, indicating a weakening upward drive. A minor pullback may be needed before the next leg up. Key nearby resistance levels to watch are 3330 and 3342.🎯 Key Price Levels & Validation ZonesThe following support zones are crucial for identifying potential entries:Support Zone 1: 3306 – 3308Support Zone 2: 3294 – 3297‼️ Important: A break below 3294 would invalidate the current wave structure, and a new count would be required.📌 Trade PlanScenario 1 – Buy at higher support:Buy Zone: 3308 – 3306SL: 3303TP1: 3342TP2: 3366TP3: 3390Scenario 2 – Buy at deeper support (if stronger correction occurs):Buy Zone: 3297 – 3294SL: 3287TP1: 3342TP2: 3366TP3: 3390Scenario 3 – Safer option (breakout confirmation):Wait for a breakout above the triangle, then enter on the retest (around 3325–3330)SL: Based on structure formed during the retestTP range: 3366 – 3390📌 Preferred strategy: Wait for H4 to reach oversold or wait for a confirmed breakout and retest to enter safely in alignment with the new uptrend.
