
PENDLE
Pendle
| تریدر | نوع سیگنال | حد سود/ضرر | زمان انتشار | مشاهده پیام |
|---|---|---|---|---|
 TheSignalystالرتبة: 14922 | خرید | حد سود: تعیین نشده حد ضرر: تعیین نشده | 26/11/2025 | |
 Crypto-by-PRIMEالرتبة: 35114 | خرید | حد سود: تعیین نشده حد ضرر: تعیین نشده | 27/11/2025 |
مخطط سعر Pendle
سود ثلاثة أشهر :
سیگنالهای Pendle
مرشح
فرز الرسالة بناءً على
نوع التاجر
الإطار الزمني
Crypto-by-PRIME
پندل (PENDLE) در آستانه جهش صعودی جدید؛ منتظر کدام منطقه قیمتی هستیم؟

Pendle / یبدو USDT قویًا، لکننی أتوقع أن یصل السعر أولاً إلى منطقة 4H FVG قبل مواصلة اتجاهه نحو 3 دولارات - 3.5 دولارات… یمکن أن یؤدی رد الفعل النظیف من تلک المنطقة إلى إطلاق الموجة الصعودیة التالیة، لذا فإن انتظار التأکید مهم هنا. لا یزال الزخم فی صالح المشترین، ولکن یجب دائمًا التخطیط للدخول بالصبر. قم بإدارة المخاطر بحکمة ولا تدخل إلا بعد تأکید واضح.

CryptoNuclear
نقطه عطف پندل (PENDLE): آیا منتظر صعود تاریخی هستیم یا سقوط بزرگ؟
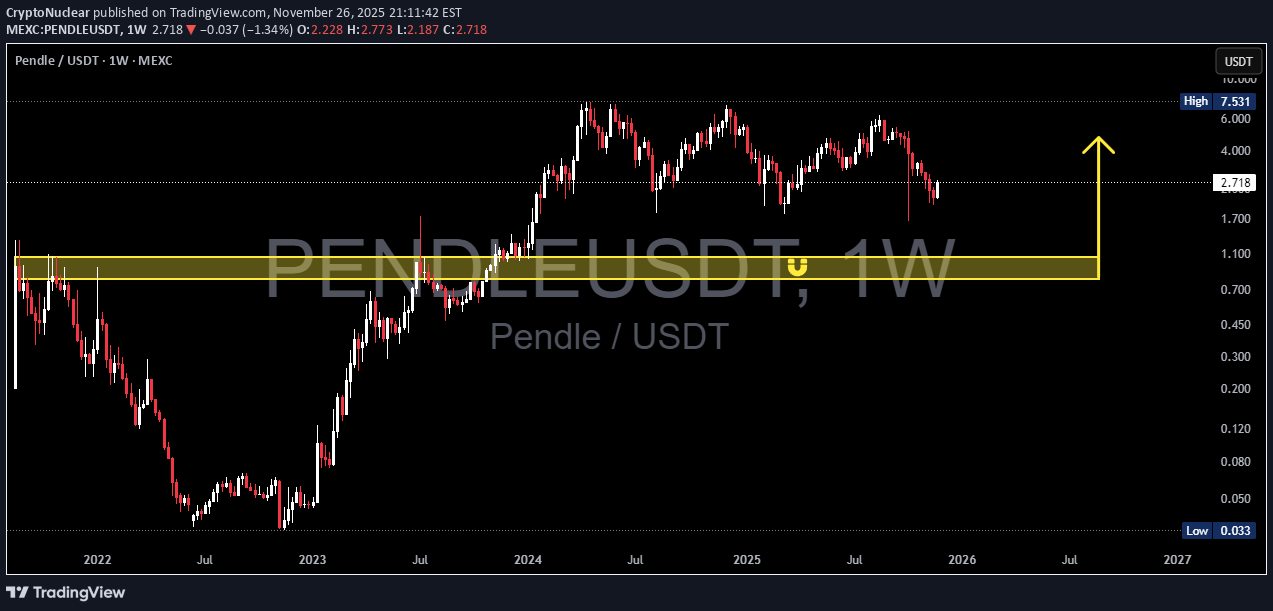
یقترب الزوج Pendle الآن من إحدى المناطق الأکثر أهمیة على الرسم البیانی الأسبوعی بأکمله. After topping near 7.5 and forming a long distribution phase, price is sliding back toward the historical origin of its previous bull cycle — the 1.05–0.80 demand zone. هذه المنطقة الصفراء لیست مجرد دعم آخر. إنه المستوى الذی غیر مسار بندل مرة واحدة من قبل. --- 🧩 البنیة الکلیة: ما الذی یحدث بالفعل؟ 2022 ← أوائل 2023: قاعدة تراکمیة طویلة. 2023 → 2024: الاختراق المتفجر ومرحلة الصعود المتجه. 2024 → 2025: التوزیع، إضعاف الهیکل، تشکیل قمم منخفضة. الآن: یتراجع السعر نحو منطقة الطلب الأسبوعیة الأکثر أهمیة. لماذا یعتبر 1.05-0.80 أمرًا کبیرًا؟ لأن هذا هو المکان: بدأت الثورات السابقة Major تم استیعاب الحجم والسیولة تم وضع الأموال الذکیة قبل الاختراق إذا استمرت المنطقة → یمکن أن یتکرر التاریخ. إذا تم کسره → ینهار الهیکل الصعودی طویل المدى. --- 🟢 السیناریو الصعودی - هل یمکن أن یصبح هذا قاعًا أعلى جدیدًا للاقتصاد الکلی؟ یتم تنشیط الحالة الصعودیة إذا: 1. یصل السعر إلى 1.05-0.80 ویرفض بقوة – الشمعة الأسبوعیة ذات الفتیل السفلی الطویل ستکون إشارة مبکرة قویة. 2. الإغلاق الأسبوعی یبقى فوق المنطقة - یؤکد أن الطلب لا یزال هو السائد هنا. 3. أهداف الاسترداد هی کما یلی: الاسترداد الأول: 2.7 المقاومة الهیکلیة: 4.0 منطقة التعافی الکامل: 6.0-7.5 إذا حدث هذا، فإن الرسم البیانی سیشکل قاعًا أعلى جدیدًا على الرسم البیانی، مما قد یؤدی إلى انعکاس صعودی طویل المدى. هذا هو بالضبط المکان الذی یمکن للمؤسسات والمشترین فی الدورة المبکرة أن یتدخلوا فیه مرة أخرى. --- 🔴 السیناریو الهبوطی – الانهیار نحو مناطق سیولة أعمق؟ یتم تأکید الاستمرار الهبوطی إذا: 1. الإغلاق الأسبوعی یکسر مستوى 0.80 عن قناعة - یشیر هذا إلى تحول الزخم الکامل للبائعین. 2. فشل إعادة الاختبار فی استعادة المنطقة – التحقق من صحة قلب العرض النظیف. 3. الأهداف السلبیة تصبح: 0.45 → الدعم الهیکلی متوسط المدى 0.20–0.12 → major الطلب التاریخی أسفل هذا تقع deep منطقة الاستسلام إن خسارة 0.80 من شأنه أن یمثل الانهیار الرسمی للهیکل الصعودی لعدة سنوات لـ Pendle. --- 🎯 لماذا تعد منطقة 1.05-0.80 مهمة جدًا لأنه: نقطة القرار الکلی لاتجاه السوق منطقة معرکة بین الأموال الذکیة وسیولة التجزئة أصل السوق الصاعدة السابقة أوضح مستوى أسبوعی على الرسم البیانی بأکمله هذا هو نوع المنطقة التی تحدد اتجاه الأشهر القلیلة القادمة. --- 📌الخلاصة Pendle یدخل فی واحدة من أهم مراحله. المنطقة 1.05-0.80 لیست مجرد "دعم" - بل هی المحور major الذی سیقرر ما إذا کان: Pendle یستعد لانعکاس أسبوعی واسع النطاق، أو Pendle ینزلق إلى مرحلة تصحیحیة أعمق نحو 0.45 → 0.20. على الإطار الزمنی الأسبوعی، یتم تضخیم کل رد فعل ویکون ذا مغزى کبیر. --- #Pendle #PENDLEUSDT #CryptoAnalogy #MarketStructure #PriceAction #WeeklyChart #CryptoOutlook #SupportAndResistance #CryptoBreakdown #CryptoReversal
TheSignalyst
پندل (PENDLE) در نقطه عطف: آیا حمایت قوی، گاوها را به بازار باز میگرداند؟
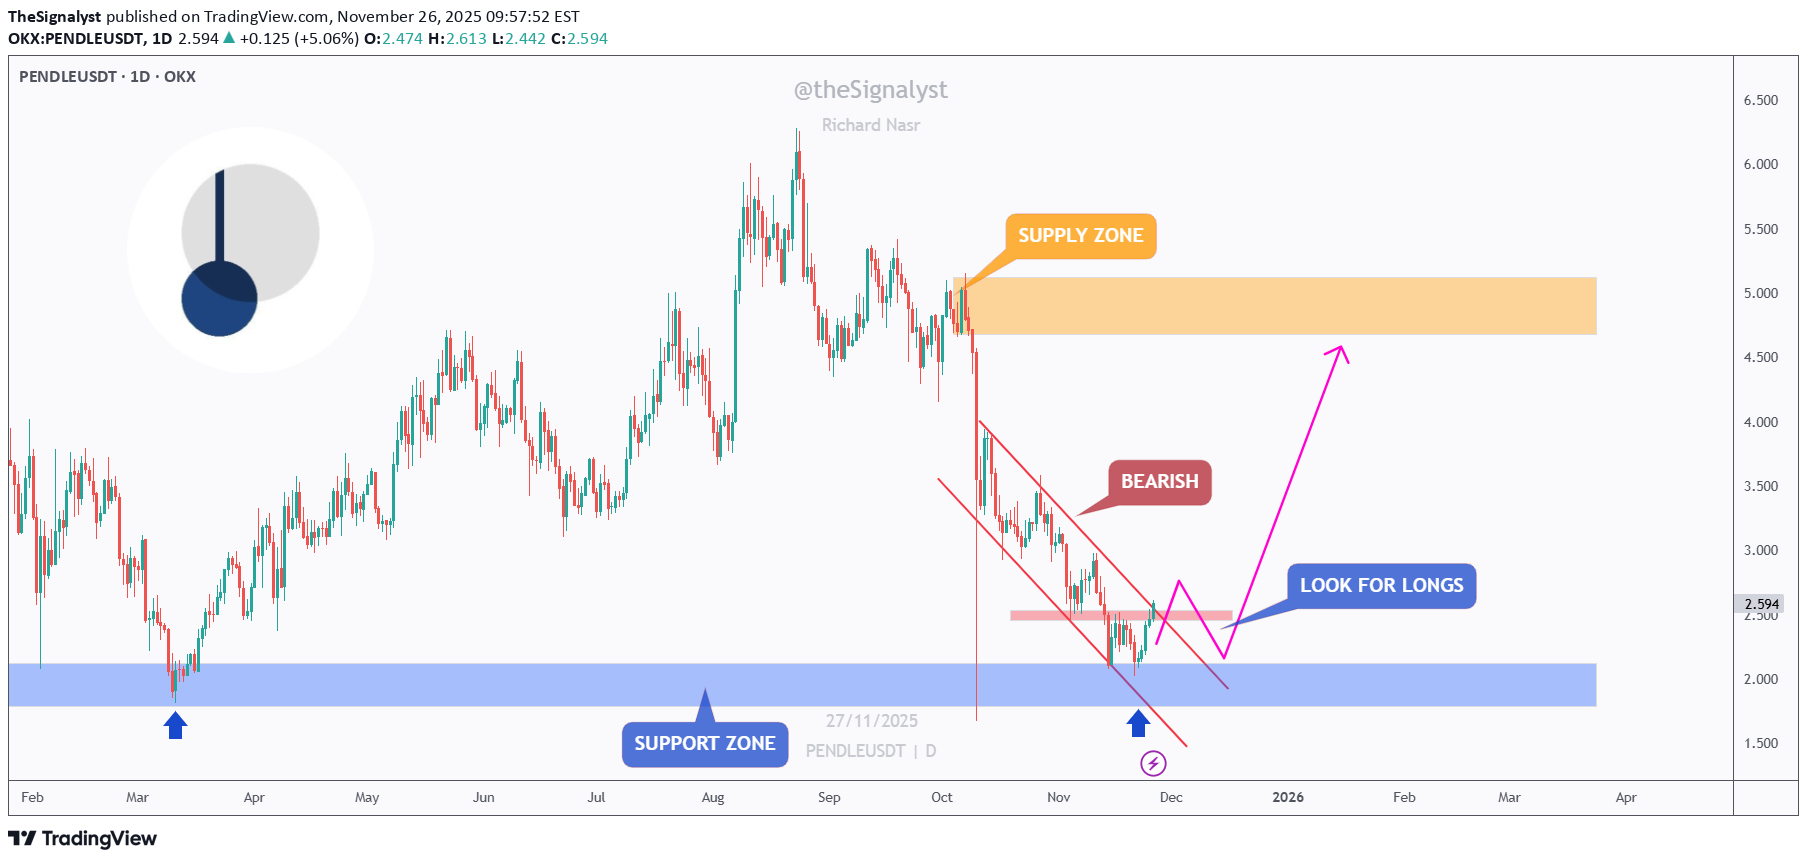
📉PENDLE کان هبوطیًا منذ أسابیع، الانزلاق داخل قناة هبوطیة نظیفة. لکن السعر یتفاعل الآن من منطقة الدعم major، وهی نفس المنطقة التی بدأت ارتفاعات قویة سابقة فی وقت سابق من هذا العام. ⚔️طالما أن منطقة الدعم الزرقاء صامدة، سنبحث عن مستویات شراء، ونتوقع تصحیحاً move نحو الحد الأعلى للقناة الهابطة. سیأتی التأکید الأول من المضاربین على الارتفاع بعد الاختراق فوق منطقة الهیکل الوردی - وهو الارتفاع الأدنى الأخیر داخل التصحیح. وبمجرد استعادة هذا المستوى، یمکن أن یتحول الزخم إلى الأعلى، مما یفتح الطریق أمام مستوى أکبر move نحو منطقة العرض حول 5.00. فی الوقت الحالی، یقع PENDLE عند نقطة تحول محتملة... فهل ستشعل منطقة الدعم التصحیح الصعودی التالی؟ 🤔 ⚠️ إخلاء المسؤولیة: هذه لیست نصیحة مالیة. قم دائمًا بإجراء الأبحاث الخاصة بک وإدارة المخاطر بشکل صحیح. 📚 التزم بخطة التداول الخاصة بک فیما یتعلق بالإدخالات والمخاطر والإدارة. حظ سعید! 🍀 جمیع الاستراتیجیات جیدة. إذا تمت إدارتها بشکل صحیح! ~ ریتشارد نصر

Bithereum_io
پندل (PENDLE) از الگوی گُوِه شکست؟ نقاط ورود و اهداف هیجانانگیز برای خرید!

کسر #PENDLE فوق نموذج الوتد الهابط على الرسم البیانی الیومی. الشمعة الیومیة لم تغلق بعد، لذلک لم یتم تأکید الاختراق بشکل کامل. إبقاء العین على ذلک. إذا انخفض السعر مرة أخرى إلى الوتد، یمکنک التفکیر فی شراء إضافی فی منطقة الدعم. إذا تم تأکید الاختراق فوق الوتد، فإن الأهداف المحتملة هی: 🎯 2.729 دولار 🎯 3.166 دولار 🎯 3.519 دولار 🎯 3.872 دولار 🎯 4.375 دولار 🎯 5.016 دولار ⚠️ تذکر دائمًا استخدام نقاط إیقاف الخسارة المشددة والحفاظ على الإدارة السلیمة للمخاطر.

AlvinDeo96
تحلیل تکنیکال پندل (PENDLE): آیا برگشت قیمت قطعی است یا در دام خرسها خواهیم افتاد؟
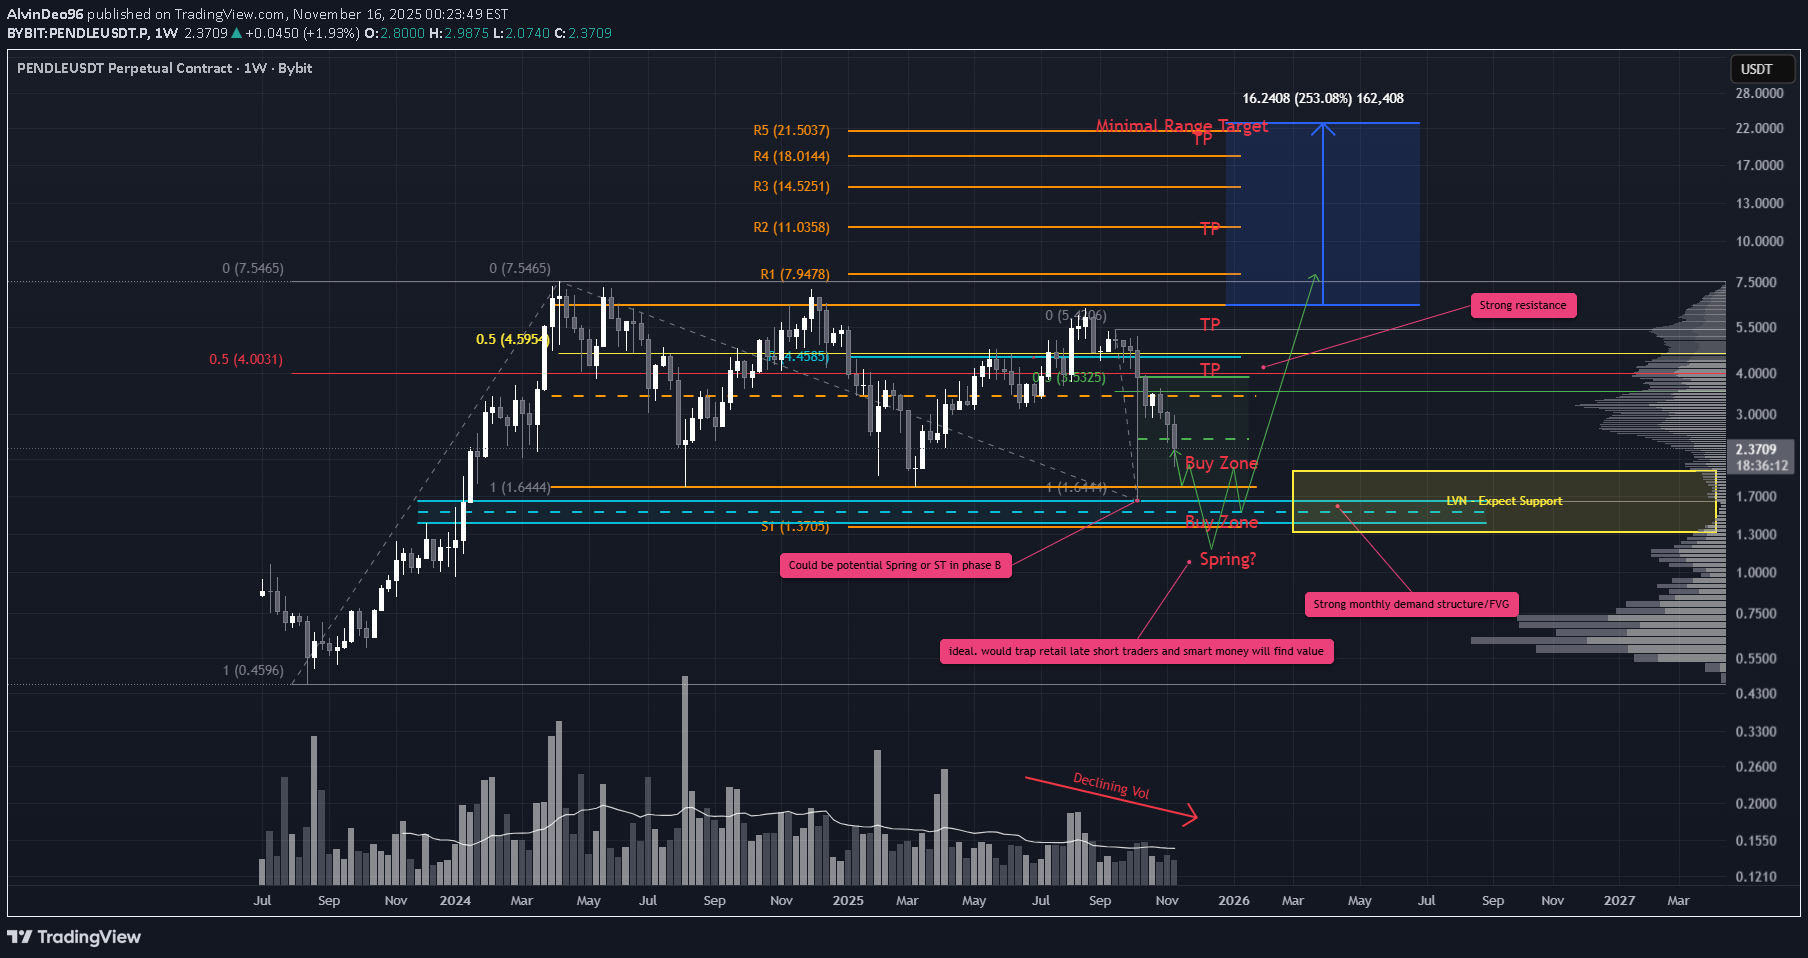
یتم تحمیل مخطط PENDLE بفارق بسیط فی الوقت الحالی. هناک الکثیر مما یحدث، ویمکن أن تتکشف مسارات متعددة من هنا، لذا یعد الحفاظ على الذکاء وإدارة المخاطر أمرًا أساسیًا. ترک الانهیار الخاطف فی 10 أکتوبر فتیلًا deep فی الجزء السفلی من النطاق. ارتد السعر فی البدایة إلى 3.87 دولارًا أمریکیًا تقریبًا، ولکنه تراجع منذ ذلک الحین بشکل کبیر إلى هذا الفتیل. تتسع فروق أسعار الشموع، مما یشیر إلى أن ضغط البیع لا یزال موجودا، ولکن الحجم لم یرتفع. وهذا یدفعنی نحو التراکم بدلاً من التوزیع. نحن نحوم حالیًا حول معادل الصوت لهذا الفتیل. إذا اندفع السعر بقوة من هنا، فقد یکون التراجع کاملاً ویمکننا التعامل مع قاع 10 أکتوبر باعتباره ربیعًا منخفض الحجم. إذا استمر السعر فی التراجع، فقد نکتسح أدنى مستویات شهر أکتوبر وform الربیع الفعلی. التأکید المثالی سیکون أسبوعیًا move أسفل النطاق من حیث الحجم، متبوعًا بإغلاق خلفی داخل النطاق ویفضل أن یکون ذلک باستخدام دوجی أو مطرقة. من الناحیة النفسیة، سیکون هذا هو الإعداد الأنظف، حیث یضخ السیولة ویمهد الطریق للانعکاس. یقع أسفل النطاق مباشرة المحور S1 السنوی وmajor FVG الشهری، وکلاهما یستحق المشاهدة. سیناریو التجارة 1 – الدخول المبکر مع إضافة الربیع دخول • البدء فی وضع الطبقات الآن (کما هو موضح أعلاه) • أضف مرة أخرى إذا حصلنا على تأکید الربیع وقف الخسارة • لا یوجد hard SL حتى الآن. یمیل هذا الإعداد إلى التقدم. • إذا رأینا شموع هابطة کبیرة بحجم صاعد، تبطل الفرضیة ونخرج. سیناریو التجارة 2 - انتظر تأکید الربیع دخول • انتظر السعر لاکتساح أدنى مستویاته وطباعة شمعة الربیع • أدخل عند التأکید (الإغلاق الأسبوعی یعود إلى نطاق الحجم) الأهداف لکلا السیناریوهین اجعل الأمر بسیطًا: • معادل النطاق • أعلى مستویاتها • الحد الأدنى من تمدید النطاق فی حالة اختراق السعر للأعلى هذه وجهة نظر متناقضة. یتوقع الکثیرون أن تنتقل العملات المشفرة إلى مرحلة هبوطیة أوسع. ولکن إذا انتهى هذا الربیع، فیمکن أن یقدم PENDLE إعدادًا نظیفًا للارتداد مع بنیة نفسیة قویة مع تخلف معظم تجار التجزئة عن الرکب.

ydnldn
پیشبینی سقوط PENDLE: ورود به موقعیت فروش (Short) با اهداف دقیق
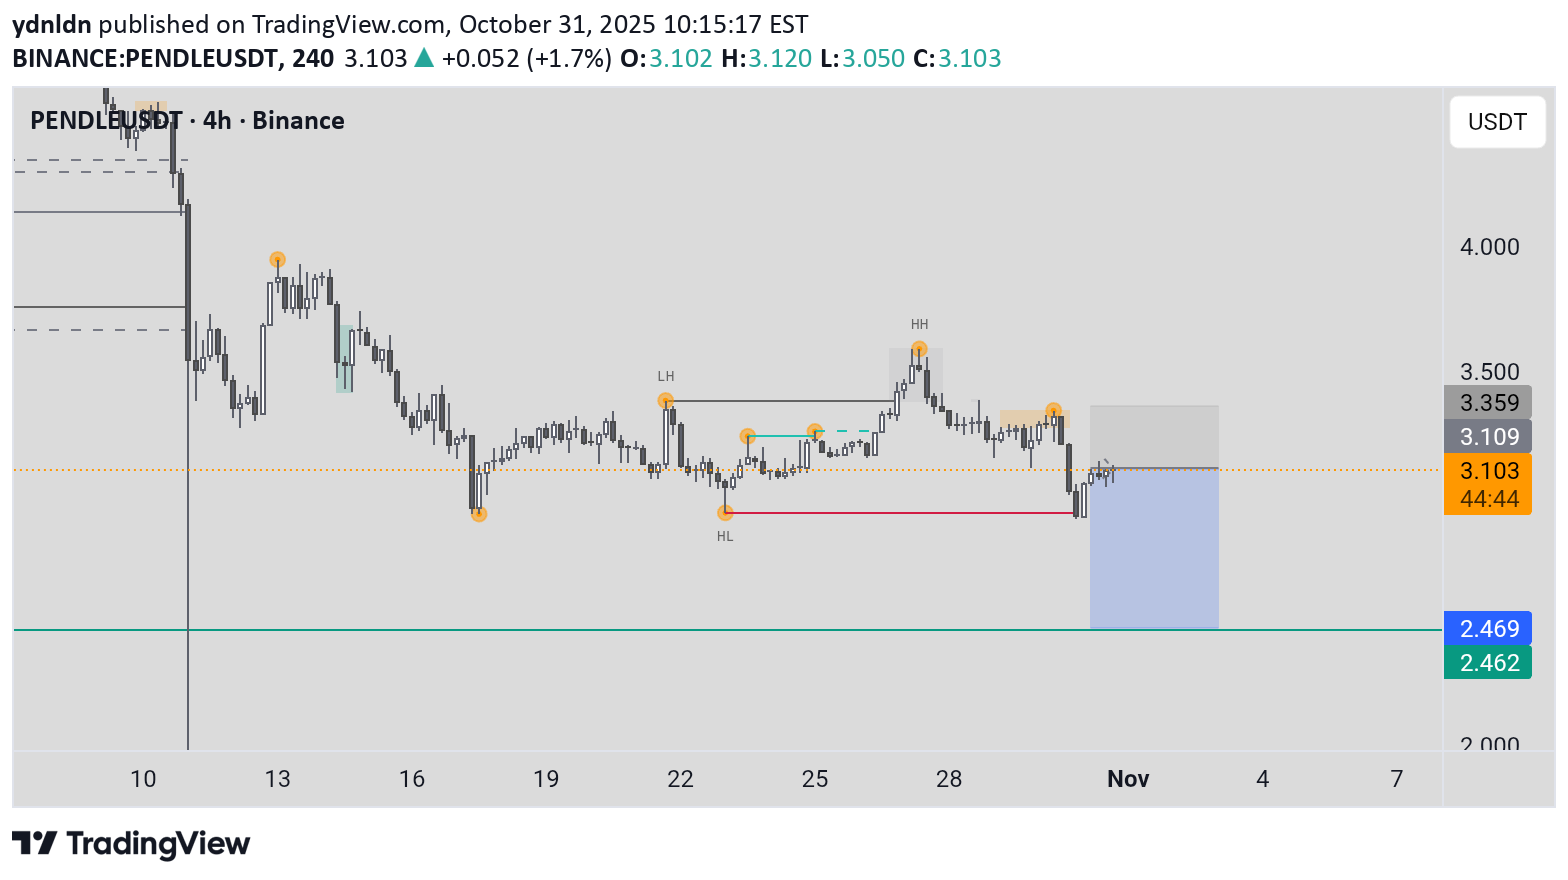
السیناریو الهبوطی (استمرار الاتجاه الهبوطی): الأساس المنطقی: یشیر الانخفاض الحاد فی نهایة الرسم البیانی إلى ضعف المشترین؛ إذا انخفض للأسفل، فسوف یستمر الزخم الهبوطی. الدخول: بیع أقل من 2,469 دولارًا أمریکیًا تقریبًا (انهیار مع إغلاق شمعة هبوطیة وحجم مرتفع). البدیل: بیع عند التراجع إلى ~ 3,105 USDT (کمقاومة جدیدة) إذا کان هناک رفض. إیقاف الخسارة (SL): أعلى من أعلى مستوى للتراجع الأخیر، ~3,200 دولار أمریکی (المخزن المؤقت 1-2%). جنی الربح (TP): TP1: ~2,000 دولار أمریکی (50% من المرکز، R:R 1:1.5). TP2: امتداد سفلی (استخدم مستوى فیبوناتشی 1.618 من أعلى سعر للتأرجحات، والهدف ~ 1,800 دولار أمریکی). الوقف المتحرک: اتبع مع المتوسط المتحرک الأسی 50 إذا کان الاتجاه قویًا. الإبطال: إذا استعاد السعر ما یقرب من 3,105 دولارًا أمریکیًا أو أعلى، قم بإلغاء الخطة الهبوطیة.

UnculturedTrade007
خیز بلند پندل (PENDLE): فرصت خرید با اهداف قیمتی جذاب!
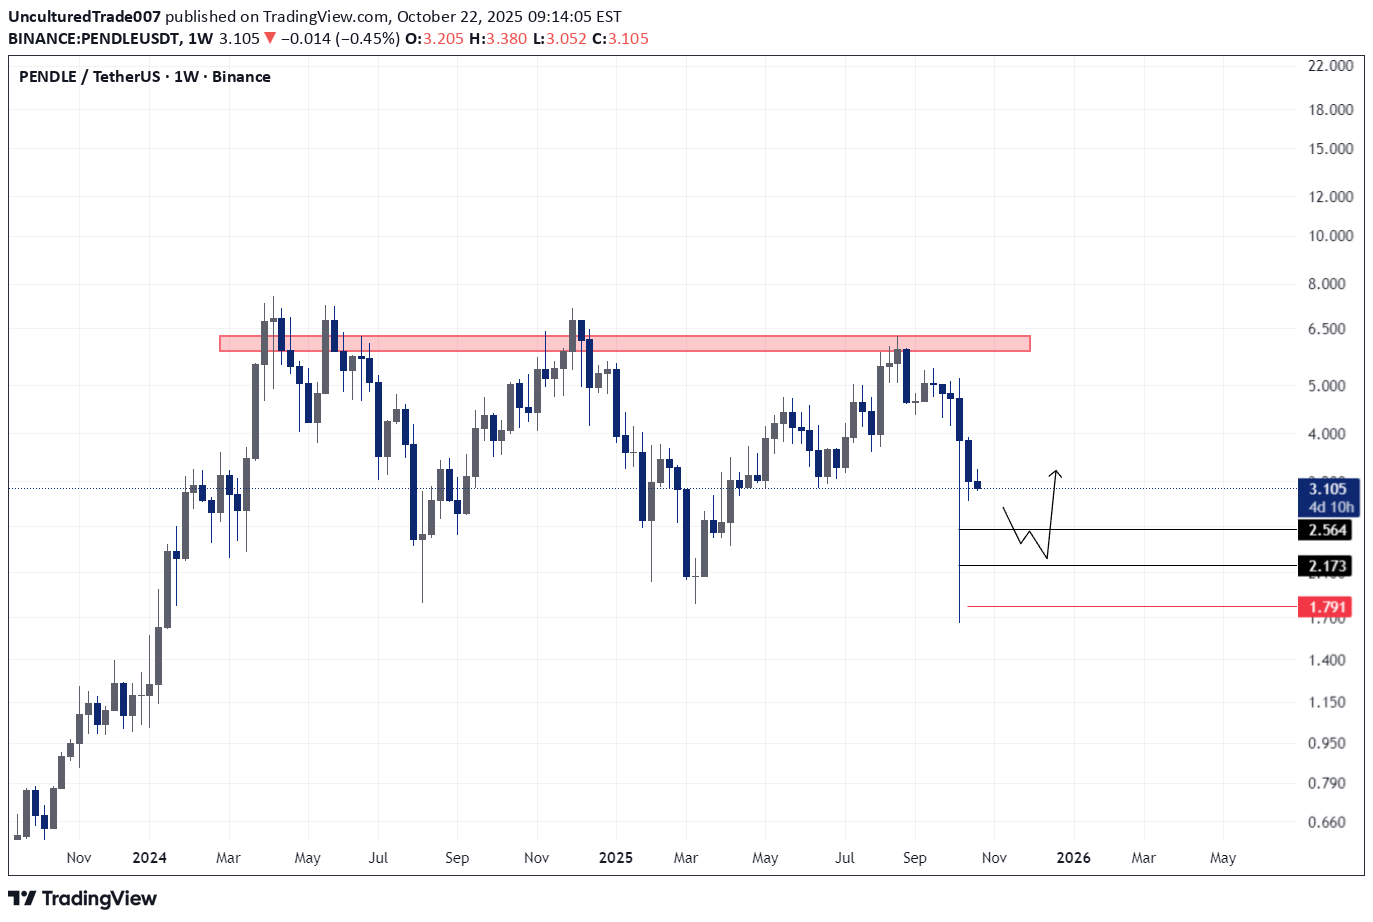
بندلUSDT تبدو جیدة لطویل الدخول بین 2.150 - 2.560 SL أقل من 1.791 الهدف فوق 3.5 دولار لیف والهامش حسب قدرة المخاطر الخاصة بک

TwinklingWM
شکست خط روند ترند، راز ورود طلا برای سود انفجاری!

لا ینبغی النظر فی الدخول إلا بعد أن یکسر السعر خط الاتجاه ویؤکد الاختراق

tradecitypro
پندل (PENDLE) در آستانه شکست مهم: آیا روند صعودی ادامه مییابد؟

👋 مرحبًا بک فی TradeCity Pro! فی هذا التحلیل، أرید مراجعة العملة PENDLE لک - وهی أحد المشاریع فی النظام البیئی Ethereum، والتی تحتل حالیًا المرتبة 93 على CoinMarketCap بقیمة سوقیة تبلغ 858.76 ملیون دولار. 📅 الإطار الزمنی الیومی على الإطار الزمنی الیومی، شکلت هذه العملة خطی اتجاه. خط الاتجاه الرئیسی هو خط الاتجاه الصعودی طویل المدى الذی احترمه السعر لفترة طویلة، فی حین أن الثانی هو خط الاتجاه التنازلی المستمر - إذا تم کسره، یمکن استئناف الاتجاه الصعودی السابق move. ✨ بما أن الاتجاه العام صاعد، فإن استمرار خط الاتجاه حالیاً هو الأهم بالنسبة لنا، لأن کسره سیؤکد استمرار الاتجاه الصاعد. 🔍 تشکل خط الاتجاه هذا بعد أن وصل السعر إلى مستوى 5.732 وقام باختراق وهمی. 📊 یقع مؤشر الاختراق لخط الاتجاه حالیًا عند 5.344. کسر هذا المستوى یمکن أن یوفر فرصة لفتح صفقة شراء على PENDLE. 🛒 بالنسبة لعملیات الشراء الفوریة، یمکن استخدام نفس المحفز 5.344، لکن المستوى 5.732 سیکون تأکیدًا أکثر أمانًا للدخول الفوری. ✅ التأکید الرئیسی لاستمرار الصعود فی دورات أعلى سیأتی بعد کسر 6.857. 🎲 من المهم ملاحظة أن أی اختراق صعودی یجب أن یکون مصحوبًا بزیادة فی الحجم، وإلا فقد یتبین بسهولة أن move مزیف. ⚡️ فی حالة کسر خط الترند الصاعد فإن سبب هذا الاختراق سیکون عند 4.431. إن کسر هذا المستوى لیس محفزًا مثالیًا للبیع، ولکن إذا استقر السعر تحته، فیمکنک التفکیر فی تفعیل وقف الخسارة الخاص بک فی حالة قیامک بالفعل بشراء العملة فی مکانها الصحیح. 🧩 مستویات الدعم التالیة فی حالة المزید من الانخفاض هی 3.741 و3.017. یقع الزخم على مؤشر القوة النسبیة عند 39.16. 📝 الخواطر النهائیة حافظ على هدوئک، وتداول بحکمة، ودعنا نغتنم أفضل الفرص المتاحة فی السوق! یعکس هذا التحلیل آرائنا ولیس نصیحة مالیة. شارک أفکارک فی التعلیقات، ولا تنس مشارکة هذا التحلیل مع أصدقائک! ❤️

ibrahimakkaya
PENDLE
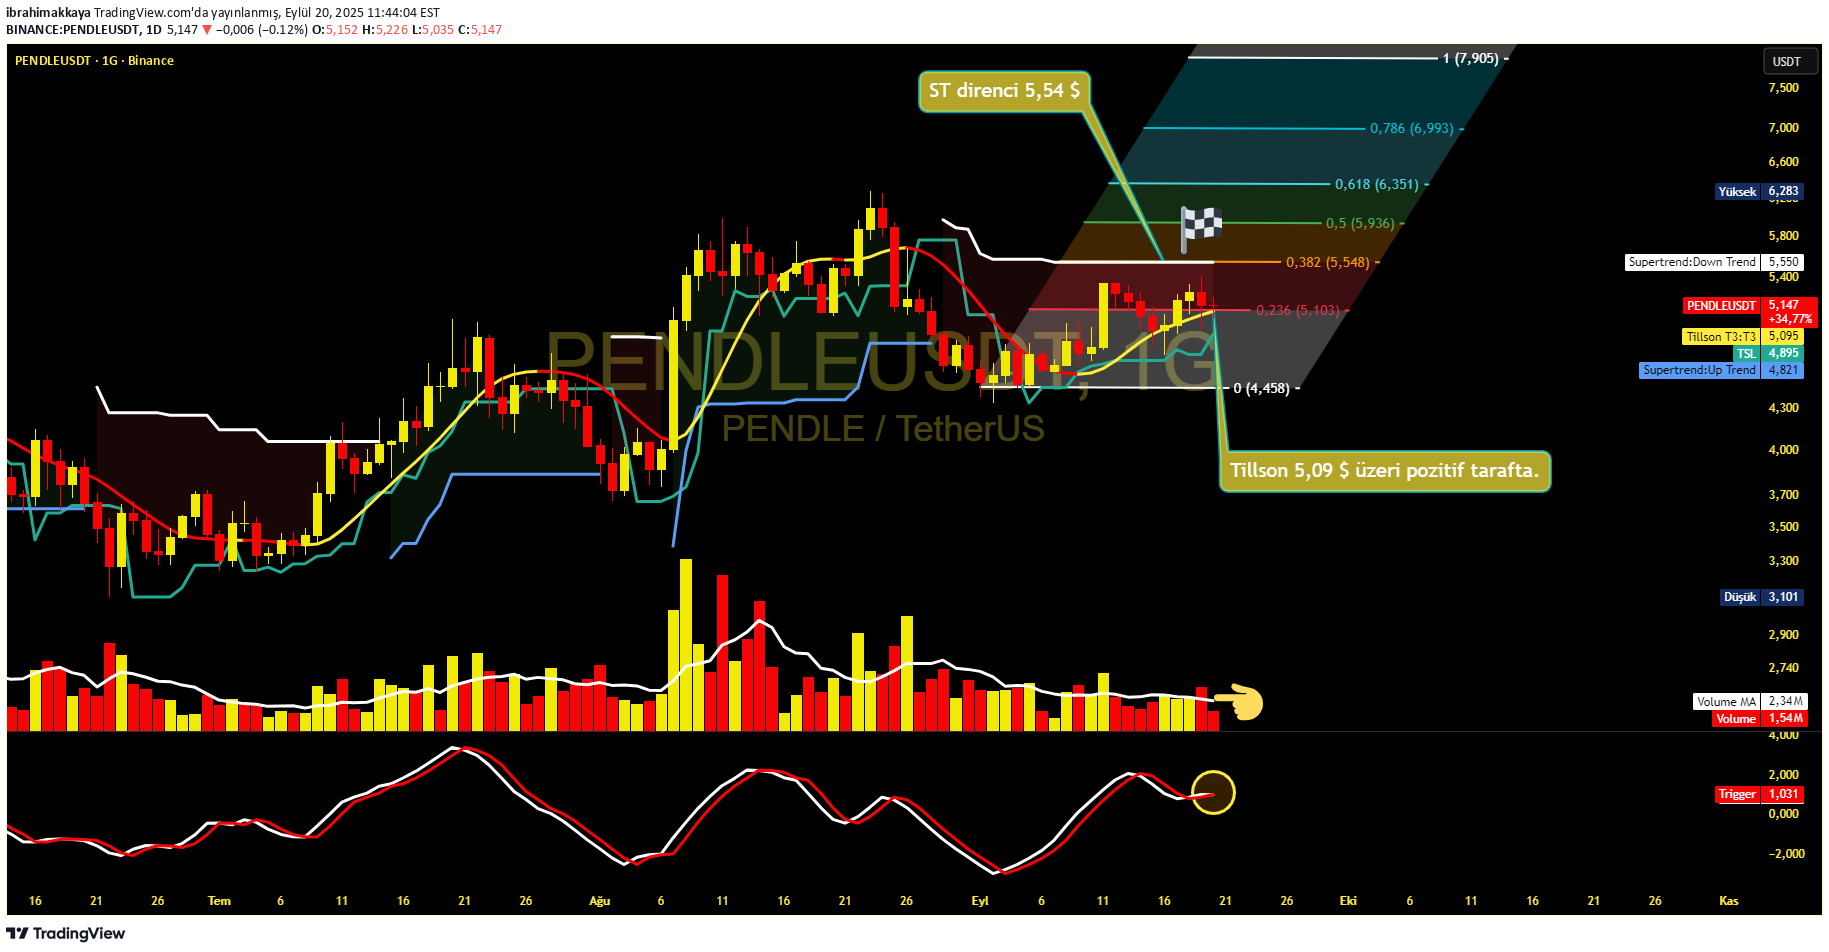
📊 دعونا نلقی نظرة على التحلیل الفنی: #Pendle/USDT الرسم البیانی فی منطقة حرجة. 📈 الرؤیة العامة Tillson T3 المستوى: 5.09 دولار 👉 👉 هو الآن أعلى من السعر. حقیقة أنه یبقى فوق هذا المستوى یعنی إشارة إیجابیة. Supertrend Resistance: 5،54 $ → إذا تم تجاوز هذا المستوى ، یکون تأکید الارتفاع أقوى. هدف العلم المسور 🏁: 7،90 دولار (مستوى 1.00 FIBO). 🔎 المؤشرات حجم (حجم): هناک إشارة أفقیة ولکن الاسترداد فی الأیام الأخیرة. مطلوب زیادة الحجم للحرکة التصاعدیة 📌. العرض: بدأت حرکة التقاطع من القاع 🚀. هذا یدل على تنشیط المشترین. SuperTrend: سیکون إغلاق أکثر من 5،54 دولارًا علامة على وجود اتجاه جدید. ✅ ملخص توقف Izsüren (🛡): 4،89 دولار (مستوى TSL). عرض إیجابی: سوف یستمر فی إغلاق أکثر من 5.09 دولار. الأهداف الأولى: 5،54 → 6،35 → 7،90 دولار 🏁 🔔 باختصار: عندما یتم تجاوز مقاومات Tillson و Supertrend ، سیتم تأکید عائد اتجاه قوی. إذا کانت الزیادة فی الحجم تدعم هذه الحرکة ، فإن الهدف من 7،90 دولار یأتی.
إخلاء المسؤولية
أي محتوى ومواد مدرجة في موقع Sahmeto وقنوات الاتصال الرسمية هي عبارة عن تجميع للآراء والتحليلات الشخصية وغير ملزمة. لا تشكل أي توصية للشراء أو البيع أو الدخول أو الخروج من سوق الأوراق المالية وسوق العملات المشفرة. كما أن جميع الأخبار والتحليلات المدرجة في الموقع والقنوات هي مجرد معلومات منشورة من مصادر رسمية وغير رسمية محلية وأجنبية، ومن الواضح أن مستخدمي المحتوى المذكور مسؤولون عن متابعة وضمان أصالة ودقة المواد. لذلك، مع إخلاء المسؤولية، يُعلن أن المسؤولية عن أي اتخاذ قرار وإجراء وأي ربح وخسارة محتملة في سوق رأس المال وسوق العملات المشفرة تقع على عاتق المتداول.