
ONE
Harmony
| تریدر | نوع سیگنال | حد سود/ضرر | زمان انتشار | مشاهده پیام |
|---|---|---|---|---|
لم يتم العثور على نتائج. | ||||
مخطط سعر Harmony
سود ثلاثة أشهر :
سیگنالهای Harmony
مرشح
فرز الرسالة بناءً على
نوع التاجر
الإطار الزمني
SIGNOLL
تحلیل جدید Harmony (ONE) با الگو: آیا این ارز به یک دلار میرسد؟
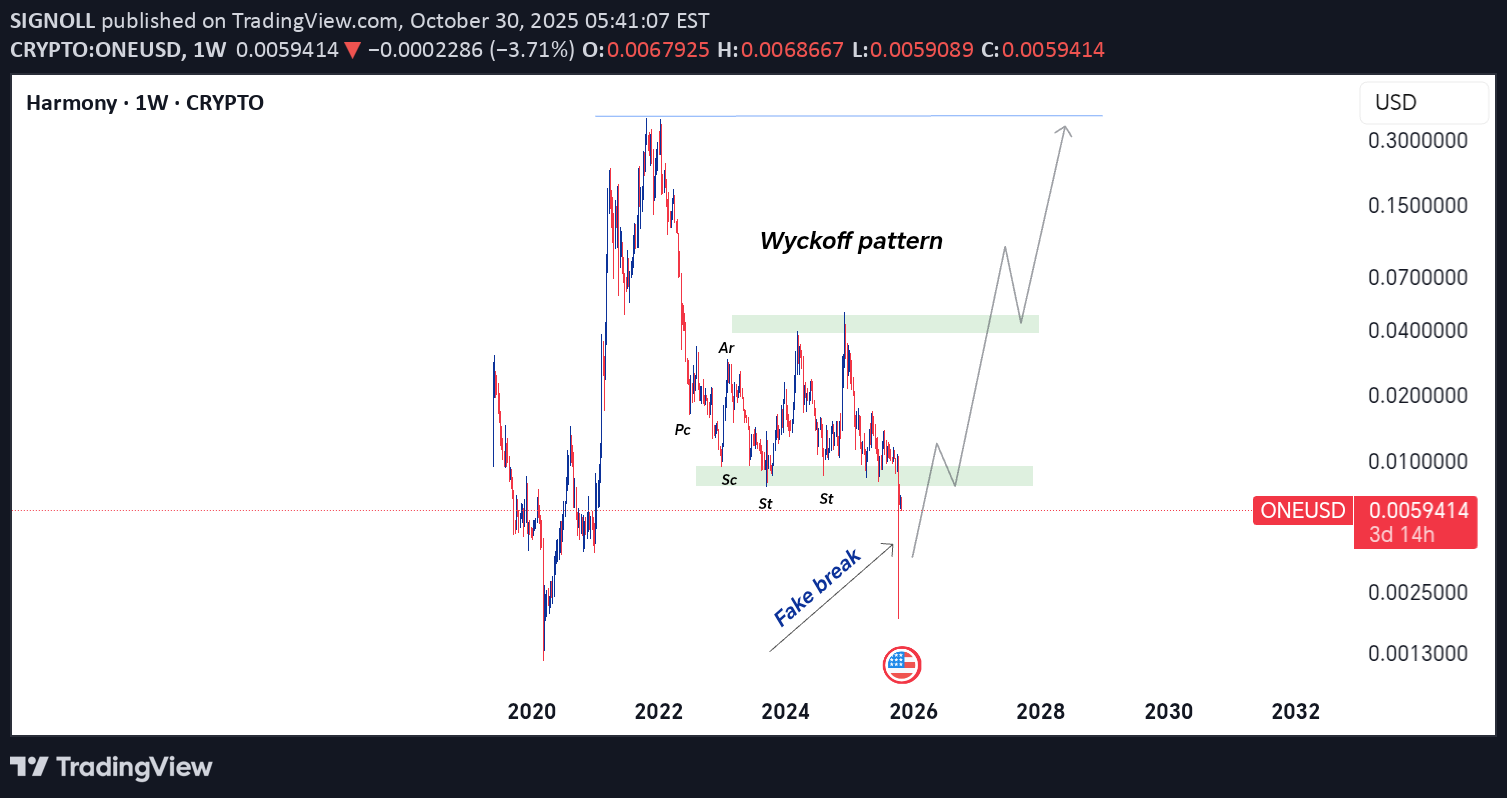
تحلیل آخر لعملة الهارمونی بناءً على نموذج ویکوف
SIGNOLL
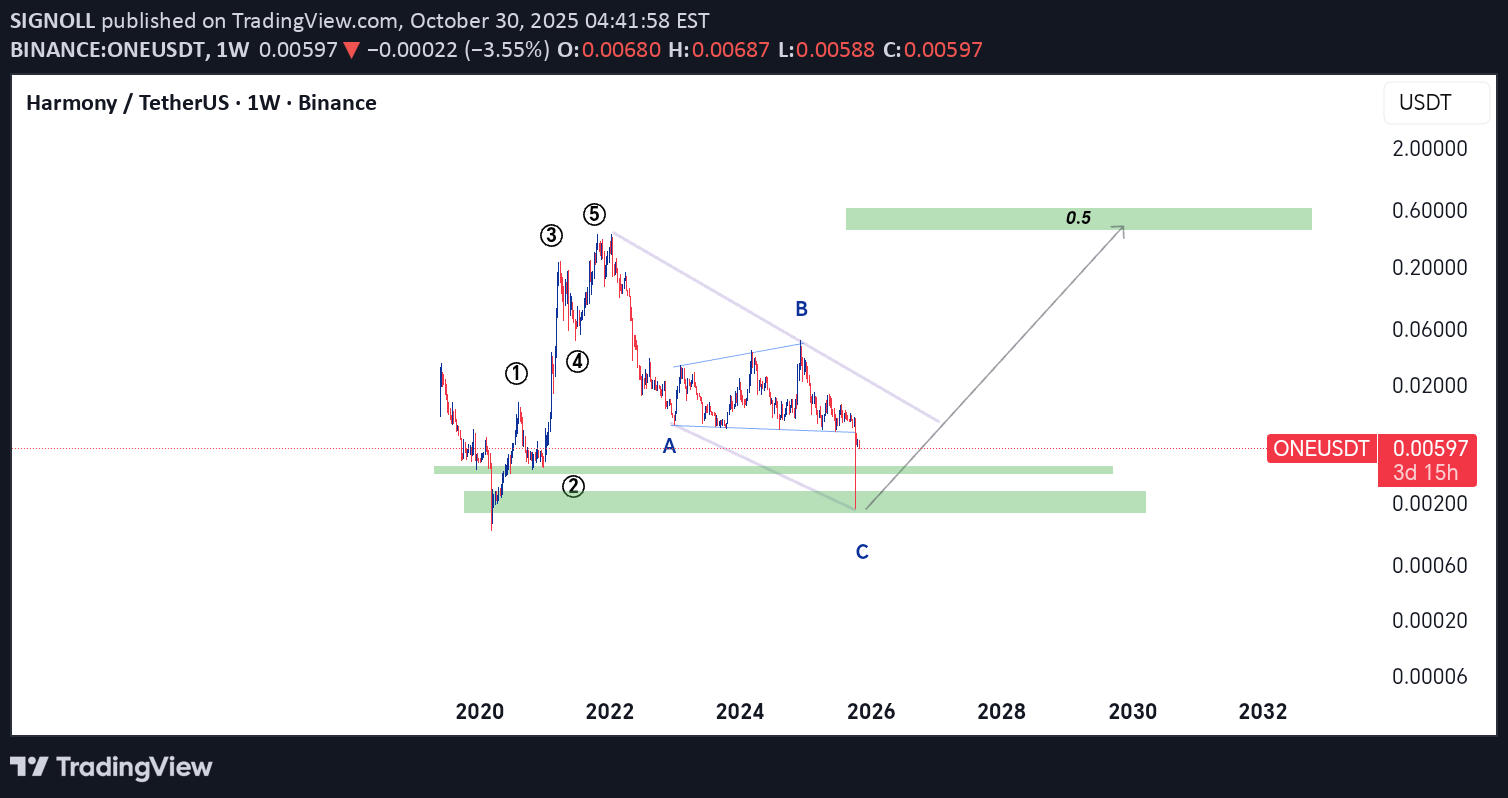
هارمونی (ONE) بعد از اصلاح، آماده پرواز به کجا؟ پیشبینی بزرگ با تحلیل امواج الیوت!

Zorroreny
آیا تاریخ تکرار میشود؟ راز پنهان الگوی صعودی $ONE و هدف ۱۰ دلاری!
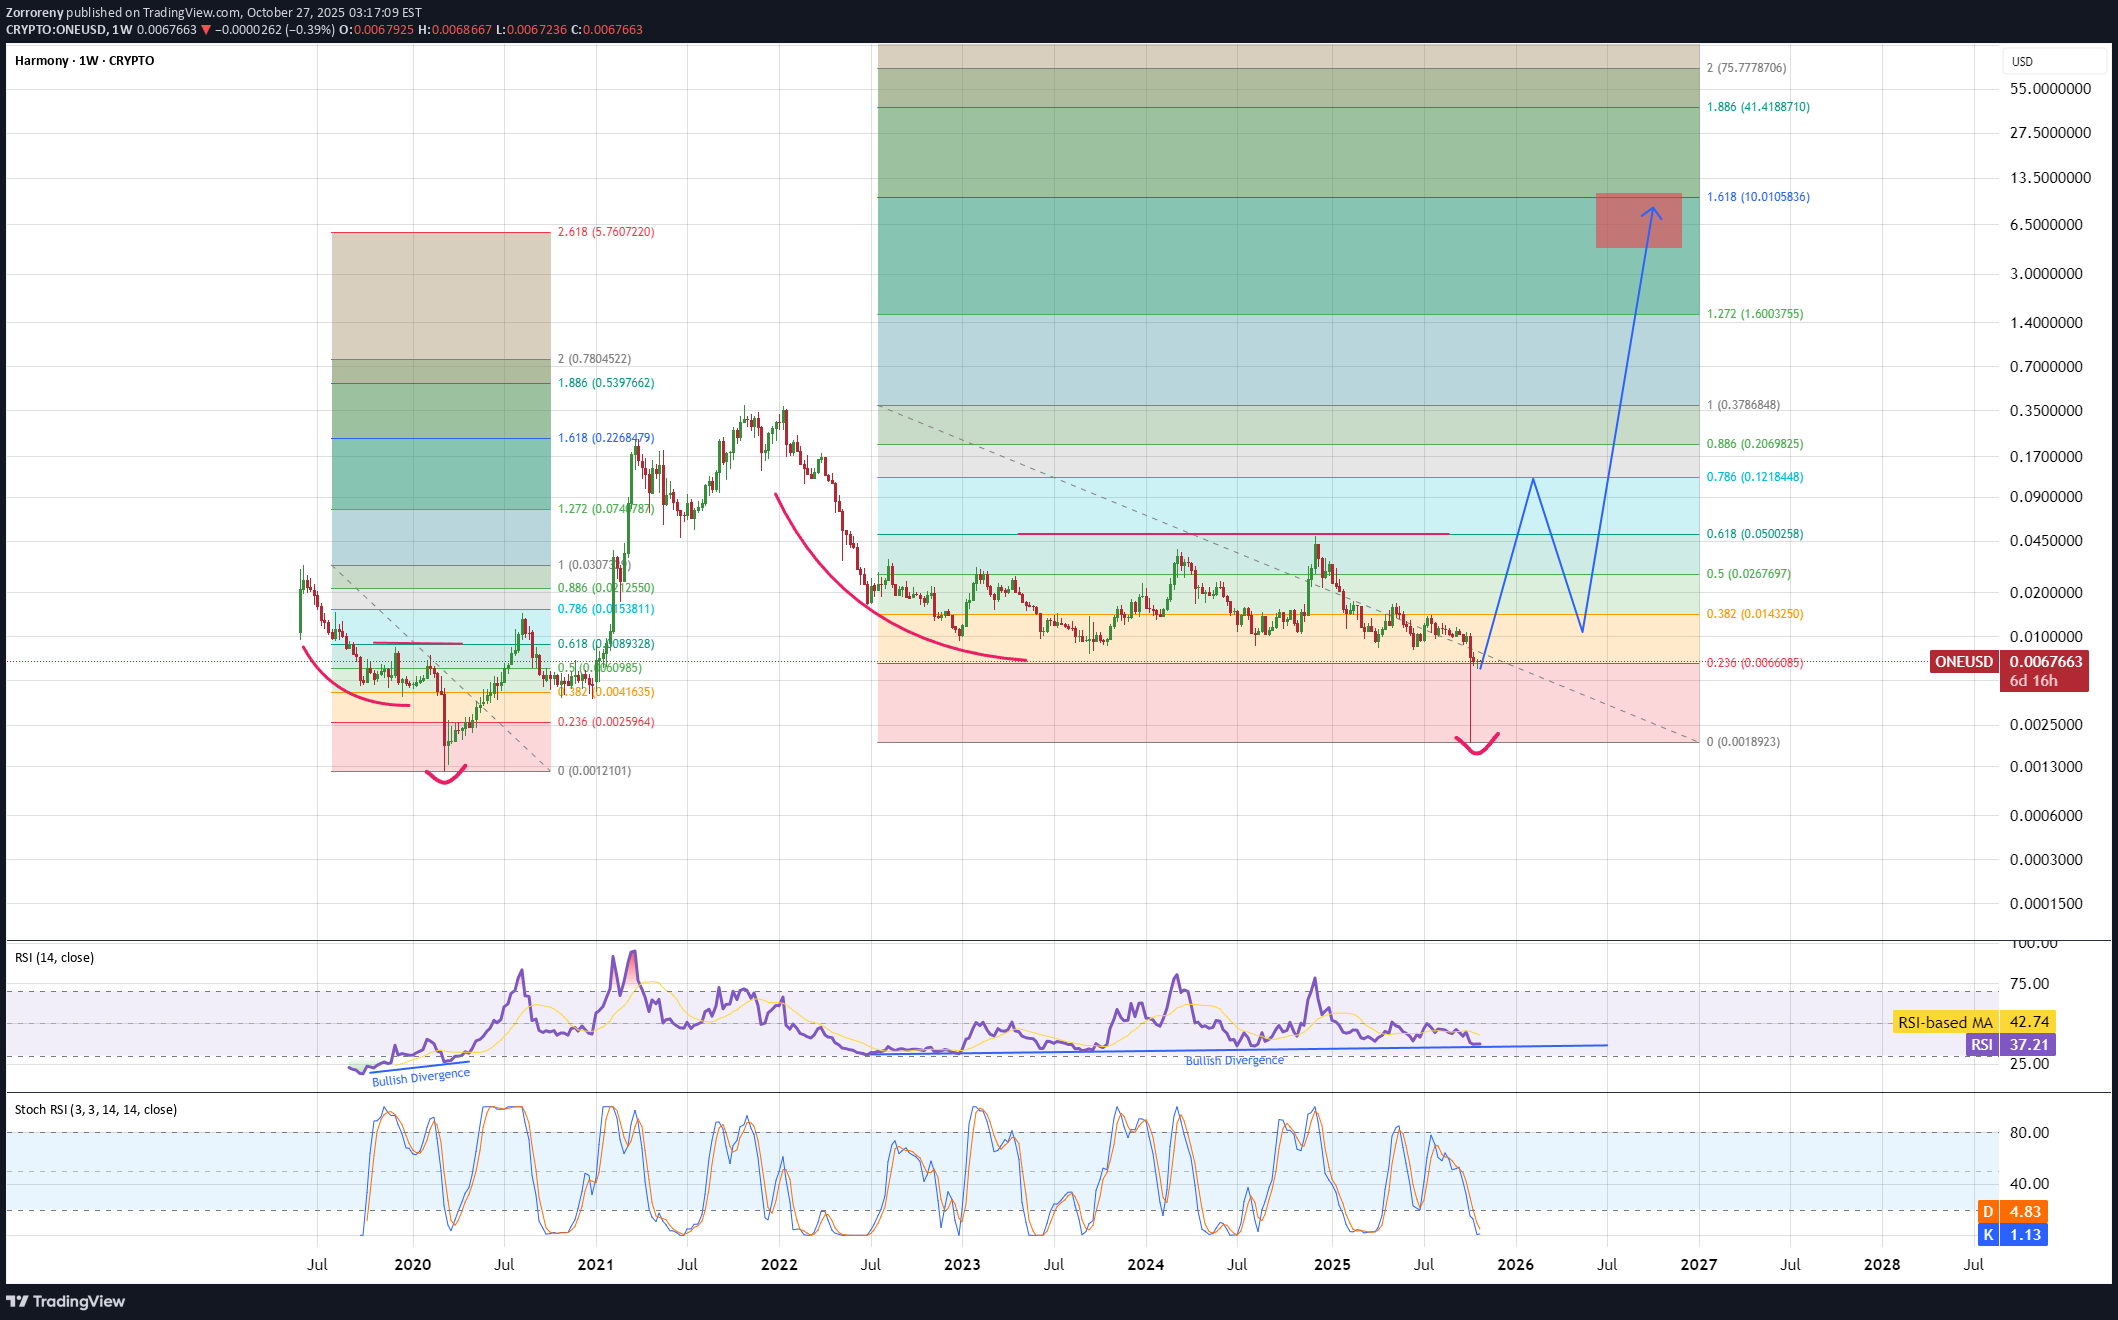
واحد تم تطویر نفس النمط تمامًا مع نفس مستویات فیب کما فی عام 2020. تمامًا کما هو الحال فی عام 2020، لدینا الآن تباعد صعودی وإذا تکرر التاریخ یمکننا الآن أن نتوقع الدفع إلى ATH جدید مع هدف هو نطاق 10 دولارات. التشکل الأول لهذه الخطة هو الدفع إلى نطاق 0.786 فیب ثم التصحیح مرة أخرى إلى مستوى فیب 0.382 إلى form وهو مستوى منخفض أعلى.

نمونه فرمولاسیون توبو چیست؟ آیا برای کار شما مناسب است؟
دعونا نرى ما إذا کانت دراسة التکوین ستعمل کمثال.

CryptoAnalystSignal
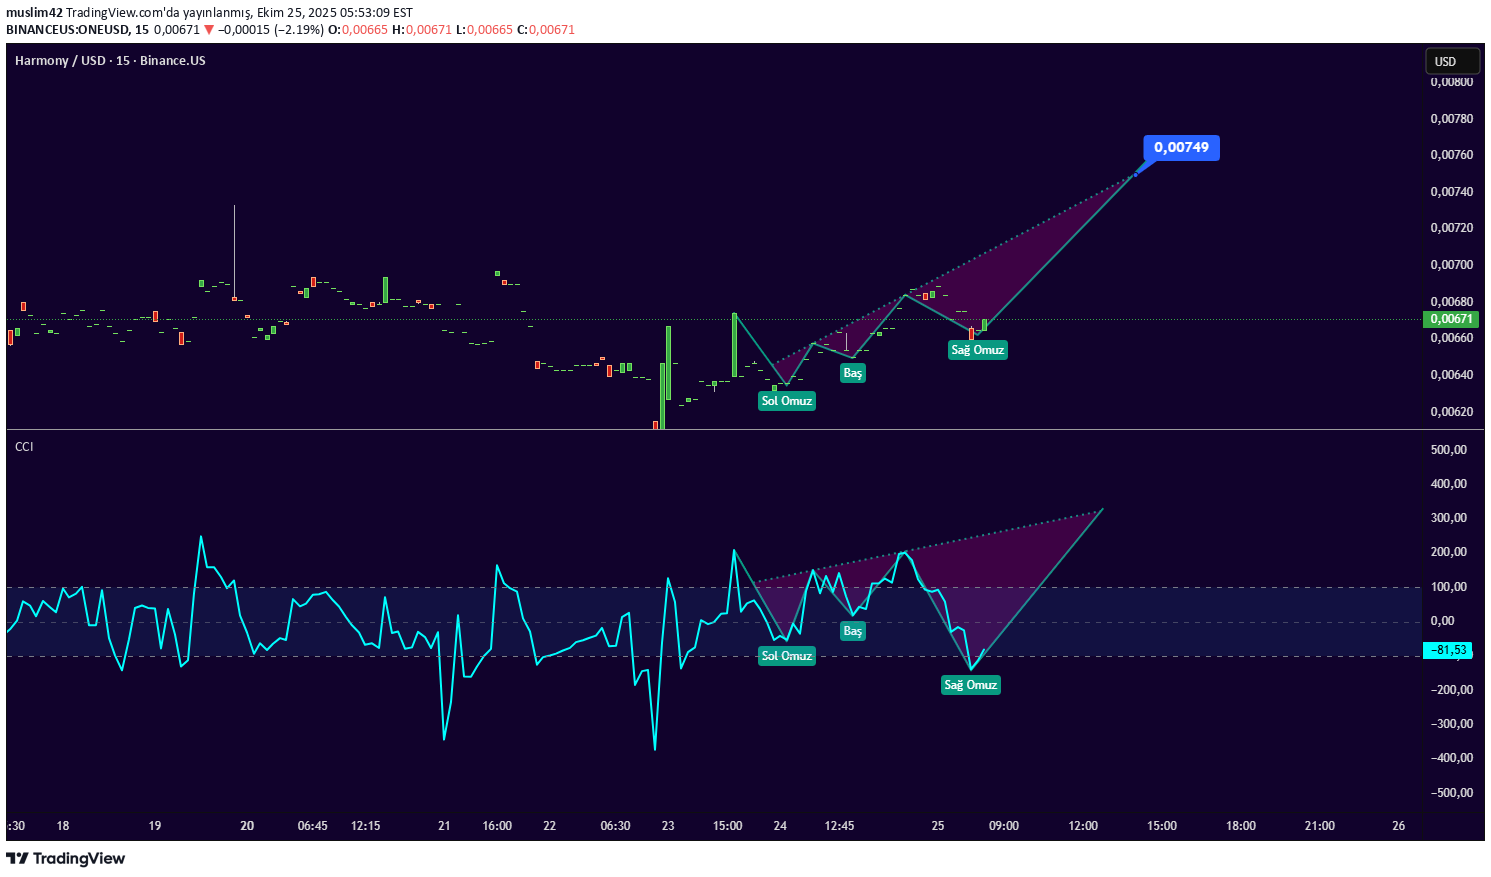
آیا ارز ONE در آستانه بازگشت صعودی است؟ تحلیل دقیق سطوح کلیدی و اهداف قیمتی

#واحد یتحرک السعر داخل قناة هابطة على الإطار الزمنی للساعة ملتصقًا بها جیدًا ویتجه نحو اختراق قوی وإعادة اختبار. لدینا اتجاه هابط على مؤشر القوة النسبیة الذی على وشک أن یتم کسره وإعادة اختباره، مما یدعم الاختراق الصعودی. توجد منطقة دعم major باللون الأخضر عند 0.00652، مما یمثل نقطة دعم قویة. نحن نتجه نحو التماسک فوق المتوسط المتحرک 100. سعر الدخول: 0.00691 الهدف الأول: 0.00706 الهدف الثانی: 0.00721 الهدف الثالث: 0.00739 لا تنس أمرا بسیطا: إدارة رأس المال. عندما تصل إلى الهدف الأول، قم بتوفیر بعض المال ثم قم بتغییر أمر إیقاف الخسارة إلى أمر دخول. للاستفسار یرجى ترک تعلیق. شکرًا لک.

CryptoNuclear
آیا ONE/USDT قبل از بازگشت بزرگ، آخرین کف قیمتی را لمس میکند؟

یوضح الرسم البیانی الأسبوعی لـ ONE/USDT story دورة سوق العملات المشفرة الکاملة: من أعلى مستویاته المبهجة لعام 2021 إلى الاتجاه الهبوطی الطویل الذی أعاد السعر الآن إلى منطقة التراکم التاریخیة بین 0.0055 - 0.0042 - وهی نفس المنطقة التی سبقت الاتجاه الصعودی السابق لـ ONE. أثار الانهیار تحت 0.00915 موجة من البیع الذعر واکتسح السیولة، مما شکل فتیلًا سفلیًا هائلاً اخترق منطقة الطلب الصفراء. مثل هذه الحرکات غالبا ما تکون بمثابة مرحلة الاستسلام، حیث یستسلم تجار التجزئة وتبدأ الأموال الذکیة فی التراکم بصمت تحت السطح. --- نظرة عامة على الهیکل والتقنیة الاتجاه الکلی: اتجاه هبوطی قوی لعدة سنوات مع قمم منخفضة وأدنى مستویات منخفضة منذ عام 2021. منطقة الطلب الرئیسیة: تعمل الکتلة الصفراء (0.0055 - 0.0042) بمثابة منطقة الطلب الأخیرة major وقاعدة محتملة لدورة سوق جدیدة. سلوک الشمعة: یشیر الفتیل الکبیر إلى انتزاع السیولة - وهی إشارة شائعة إلى أن الإرهاق الهبوطی قد یکون قریبًا إذا تم تأکیده من خلال إغلاق أسبوعی قوی فوق المنطقة. Major مستویات المقاومة: 0.0130 → 0.01625 → 0.0200 → 0.0240 → 0.0355 - یمکن أن تکون هذه المستویات بمثابة أهداف إعادة اختبار أو اختراق محتملة فی حالة حدوث انعکاس فی الاتجاه. --- السیناریو الصاعد الشرط الرئیسی: الإغلاق الأسبوعی فوق 0.00915 من شأنه أن یشیر إلى استعادة رئیسیة وانعکاس هیکلی محتمل. إشارات التأکید: ارتفاع حجم الشراء وتشکیل قاع أعلى فوق المنطقة الصفراء. الأهداف الصعودیة: 1.0.0130 – مستوى الارتداد الفنی الأول 2. 0.01625 – 0.0200 – منطقة الإمداد متوسطة المدى 3. 0.0355 – هدف کبیر إذا استمر الانعکاس السرد الصاعد: "إن الأموال الذکیة تتراکم عندما یهیمن الخوف. وربما تکون المرحلة الهادئة من التراکم قد بدأت بالفعل". --- السیناریو الهبوطی التأکید الهابط: الإغلاق الأسبوعی تحت 0.0042 سیؤکد الانهیار الهیکلی الکامل. الهدف التالی: استمرار الانخفاض نحو المنطقة النفسیة 0.0023، والدخول فی مرحلة انخفاض القیمة deep. السرد الهبوطی: "إذا فشلت المنطقة الصفراء، فیمکن أن تدخل شرکة ONE المرحلة الأخیرة من دورة الهبوط - وهی مرحلة لا یتحملها سوى المستثمرین الأکثر صبرًا". --- الإستراتیجیة والفرصة المتداولون على المدى القصیر: انتظروا الاسترداد المؤکد فوق 0.00915 قبل التفکیر فی عملیات الدخول الطویلة. المستثمرون على المدى الطویل: یظل النطاق 0.0055 – 0.0042 منطقة تراکم محتملة – ولکن فقط مع إدارة منضبطة للمخاطر دون مستوى الدعم. Core المبدأ: "الانتکاسات الحقیقیة لا تولد من التفاؤل، بل من الیأس." --- خاتمة یقف ONE عند نقطة انعطاف حرجة لعدة سنوات. یمثل النطاق 0.0055 – 0.0042 ساحة المعرکة النهائیة بین الاستسلام والولادة الجدیدة. إذا صمدت المنطقة واستعاد السعر 0.00915، فقد تبدأ دورة جدیدة. إذا انخفض إلى مستوى أقل، توقع انخفاضًا أعمق فی قیمة العملة قبل أن تتشکل مرحلة التراکم التالیة. یختبر السوق الصبر – ویفصل المؤمنین عن أتباع الاتجاه. --- #ONEUSDT #HarmonyONE #CryptoAnalogy #AltcoinReversal #PriceAction #CryptoCapitulation #MarketCycle #TechnicalAnalogy #CryptoMarket #SupportResistance

satooshi1242
روند انفجاری در راه است: رسیدن به 350٪ تنها با کمی صبر!

کما ترون من الرسم البیانی ، یتم کسر خطوط اتجاهین مهمة والاستعداد لضرب 350 ٪ بسهولة ، ولکن هناک حاجة إلى القلیل من الصبر.

CryptoWithJames
خیز 50 درصدی ONE: سیگنال شکست الگوی گوه نزولی برای سود انفجاری!

#واحد تحدیث إعداد فنی واحد النمط: نمط إسفین السقوط الصعودی السعر الحالی: 0.01265 دولار السعر المستهدف: 0.01907 دولار کسب ٪ الهدف: 50.82 ٪ واحد یخرج من نمط إسفین المتساقط على الإطار الزمنی 1D. السعر الحالی هو 0.01265 دولار بهدف بالقرب من 0.01907 دولار ، مما یدل على حوالی 50 ٪ من الاتجاه الصعودی. یؤکد الاختراق الزخم الصعودی مع هیکل لصالح الاستمرار. استخدم دائمًا إدارة المخاطر المناسبة. الإطار الزمنی: 1D نصیحة إدارة المخاطر: استخدم دائمًا إدارة المخاطر المناسبة.

هارمونی وان: چرا این پروژه undervalued است و پتانسیل صعودی عظیمی دارد؟

أساسیات رائعة ، مشروع بأقل من تقدیر للغایة ، دایور

morningishappy
Really want to go to the moon
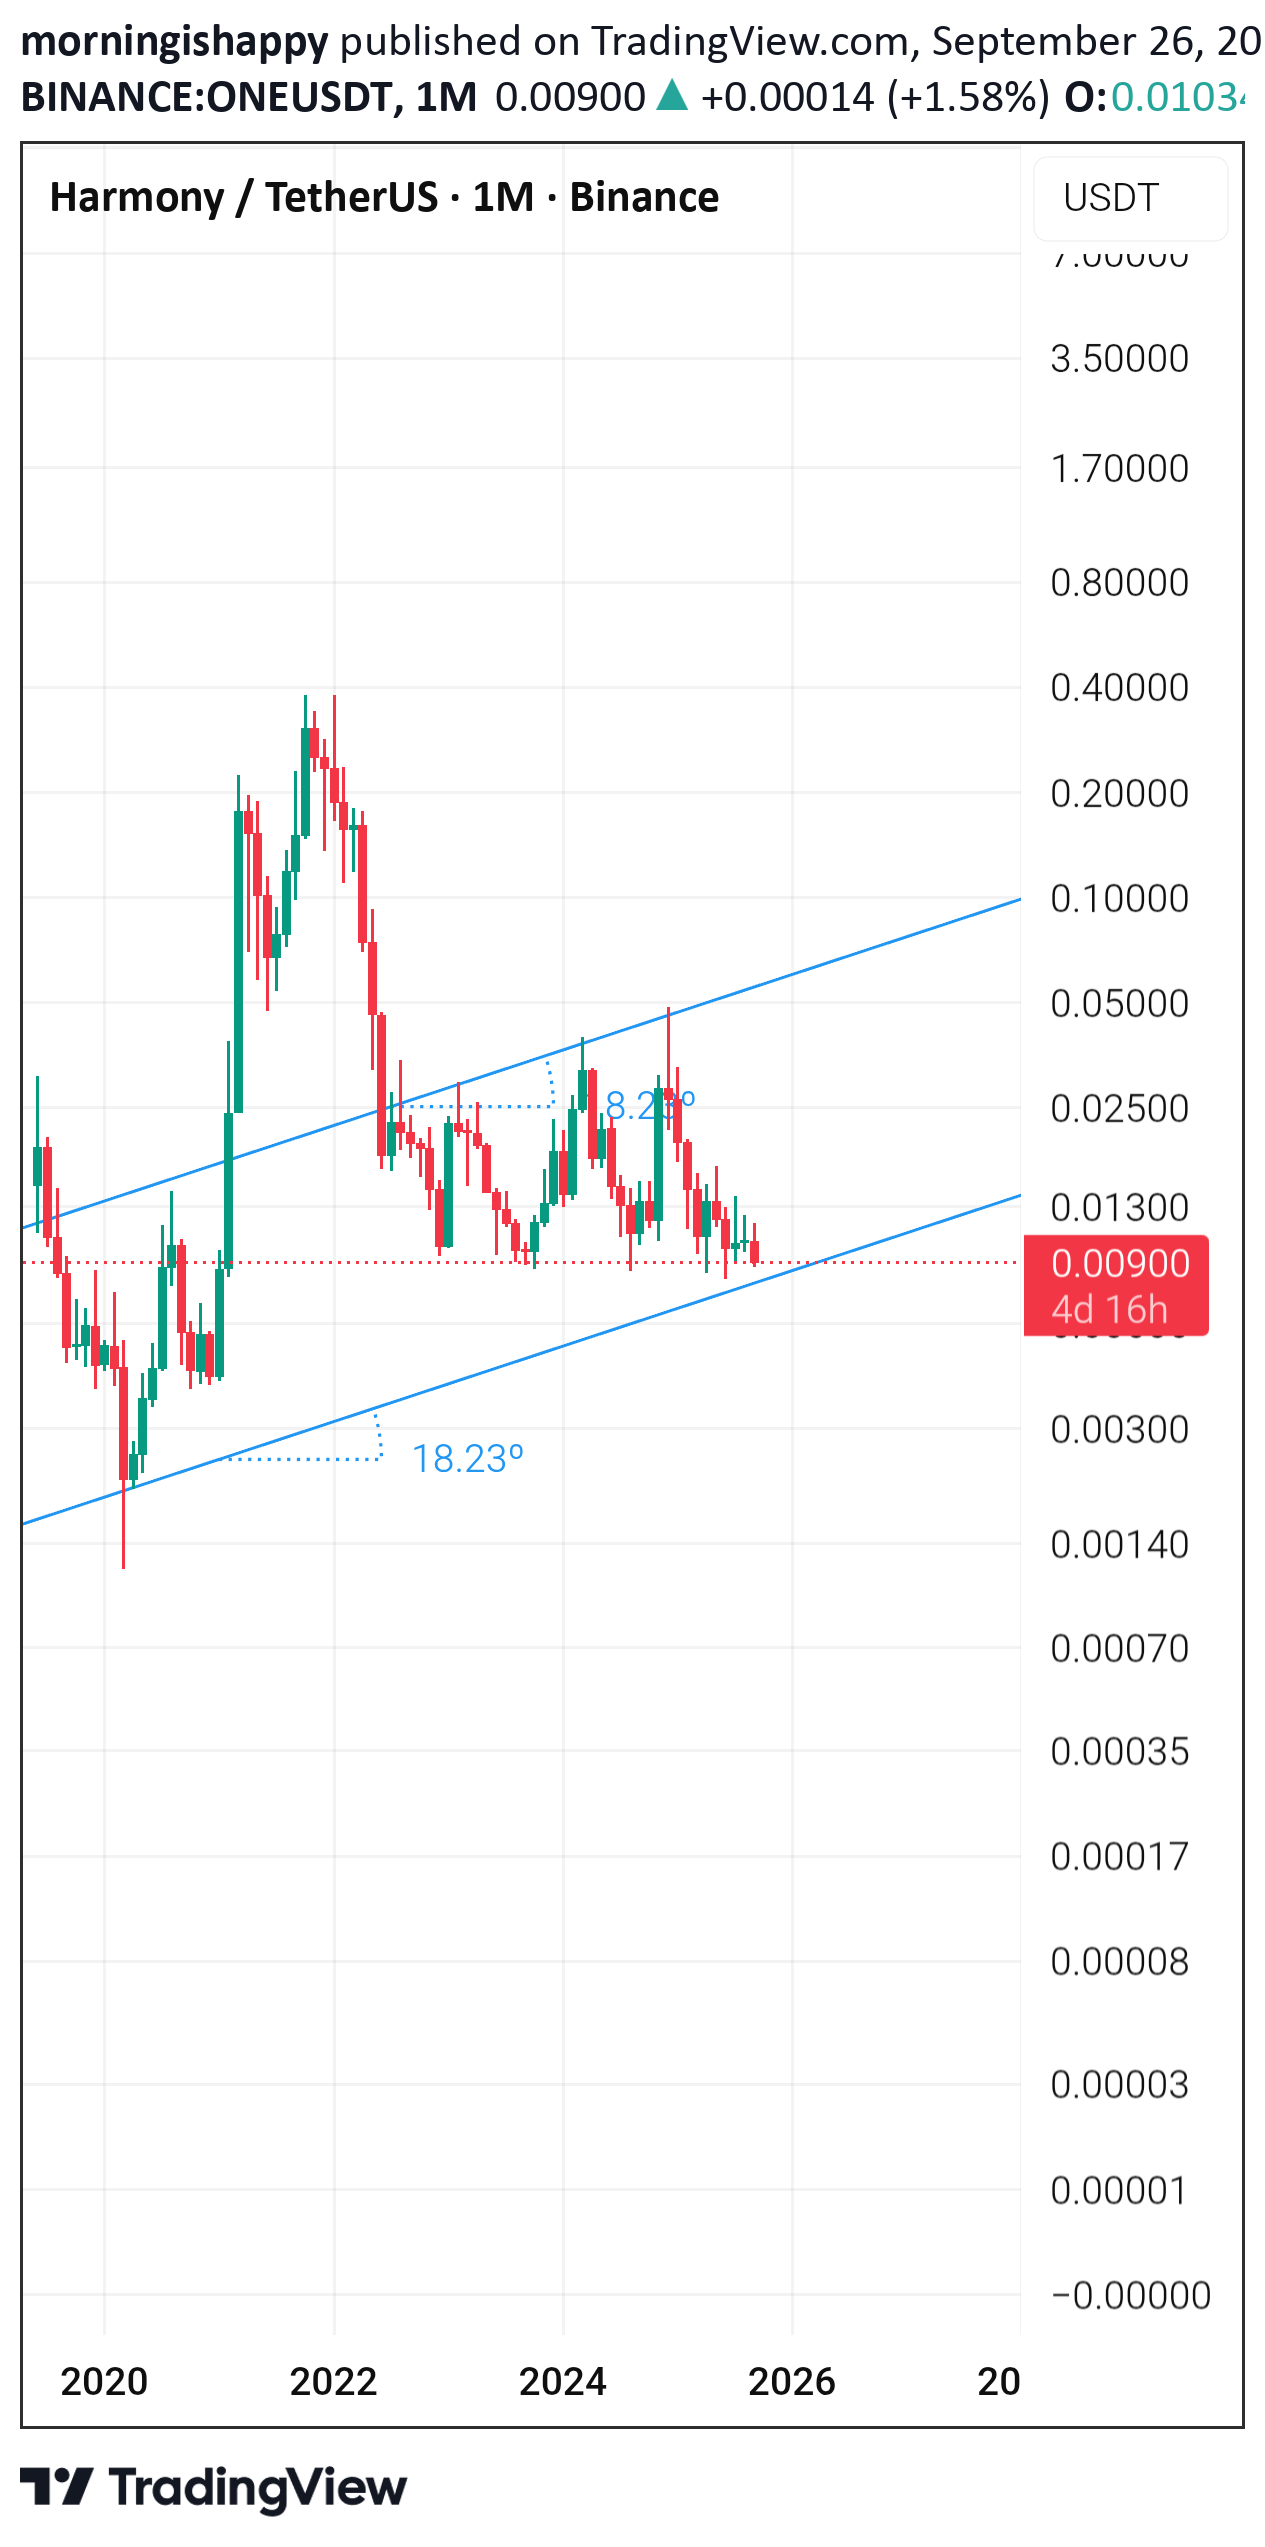
هذا الرسم البیانی فی الإطار الزمنی الشهری. لذلک یجب أن تکون صبورًا جدًا للقفز.
إخلاء المسؤولية
أي محتوى ومواد مدرجة في موقع Sahmeto وقنوات الاتصال الرسمية هي عبارة عن تجميع للآراء والتحليلات الشخصية وغير ملزمة. لا تشكل أي توصية للشراء أو البيع أو الدخول أو الخروج من سوق الأوراق المالية وسوق العملات المشفرة. كما أن جميع الأخبار والتحليلات المدرجة في الموقع والقنوات هي مجرد معلومات منشورة من مصادر رسمية وغير رسمية محلية وأجنبية، ومن الواضح أن مستخدمي المحتوى المذكور مسؤولون عن متابعة وضمان أصالة ودقة المواد. لذلك، مع إخلاء المسؤولية، يُعلن أن المسؤولية عن أي اتخاذ قرار وإجراء وأي ربح وخسارة محتملة في سوق رأس المال وسوق العملات المشفرة تقع على عاتق المتداول.