
DOT
Polkadot
| تریدر | نوع سیگنال | حد سود/ضرر | زمان انتشار | مشاهده پیام |
|---|---|---|---|---|
 AAK_الرتبة: 3936 | خرید | حد سود: تعیین نشده حد ضرر: تعیین نشده | 19/12/2025 | |
خرید | حد سود: تعیین نشده حد ضرر: تعیین نشده | 18/12/2025 | ||
 ULYSSESTRADERالرتبة: 32197 | خرید | حد سود: تعیین نشده حد ضرر: تعیین نشده | 29/11/2025 |

مخطط سعر Polkadot
سود ثلاثة أشهر :
خلاصه سیگنالهای Polkadot
سیگنالهای Polkadot
مرشح
فرز الرسالة بناءً على
نوع التاجر
الإطار الزمني
AAK_
DOT/USD
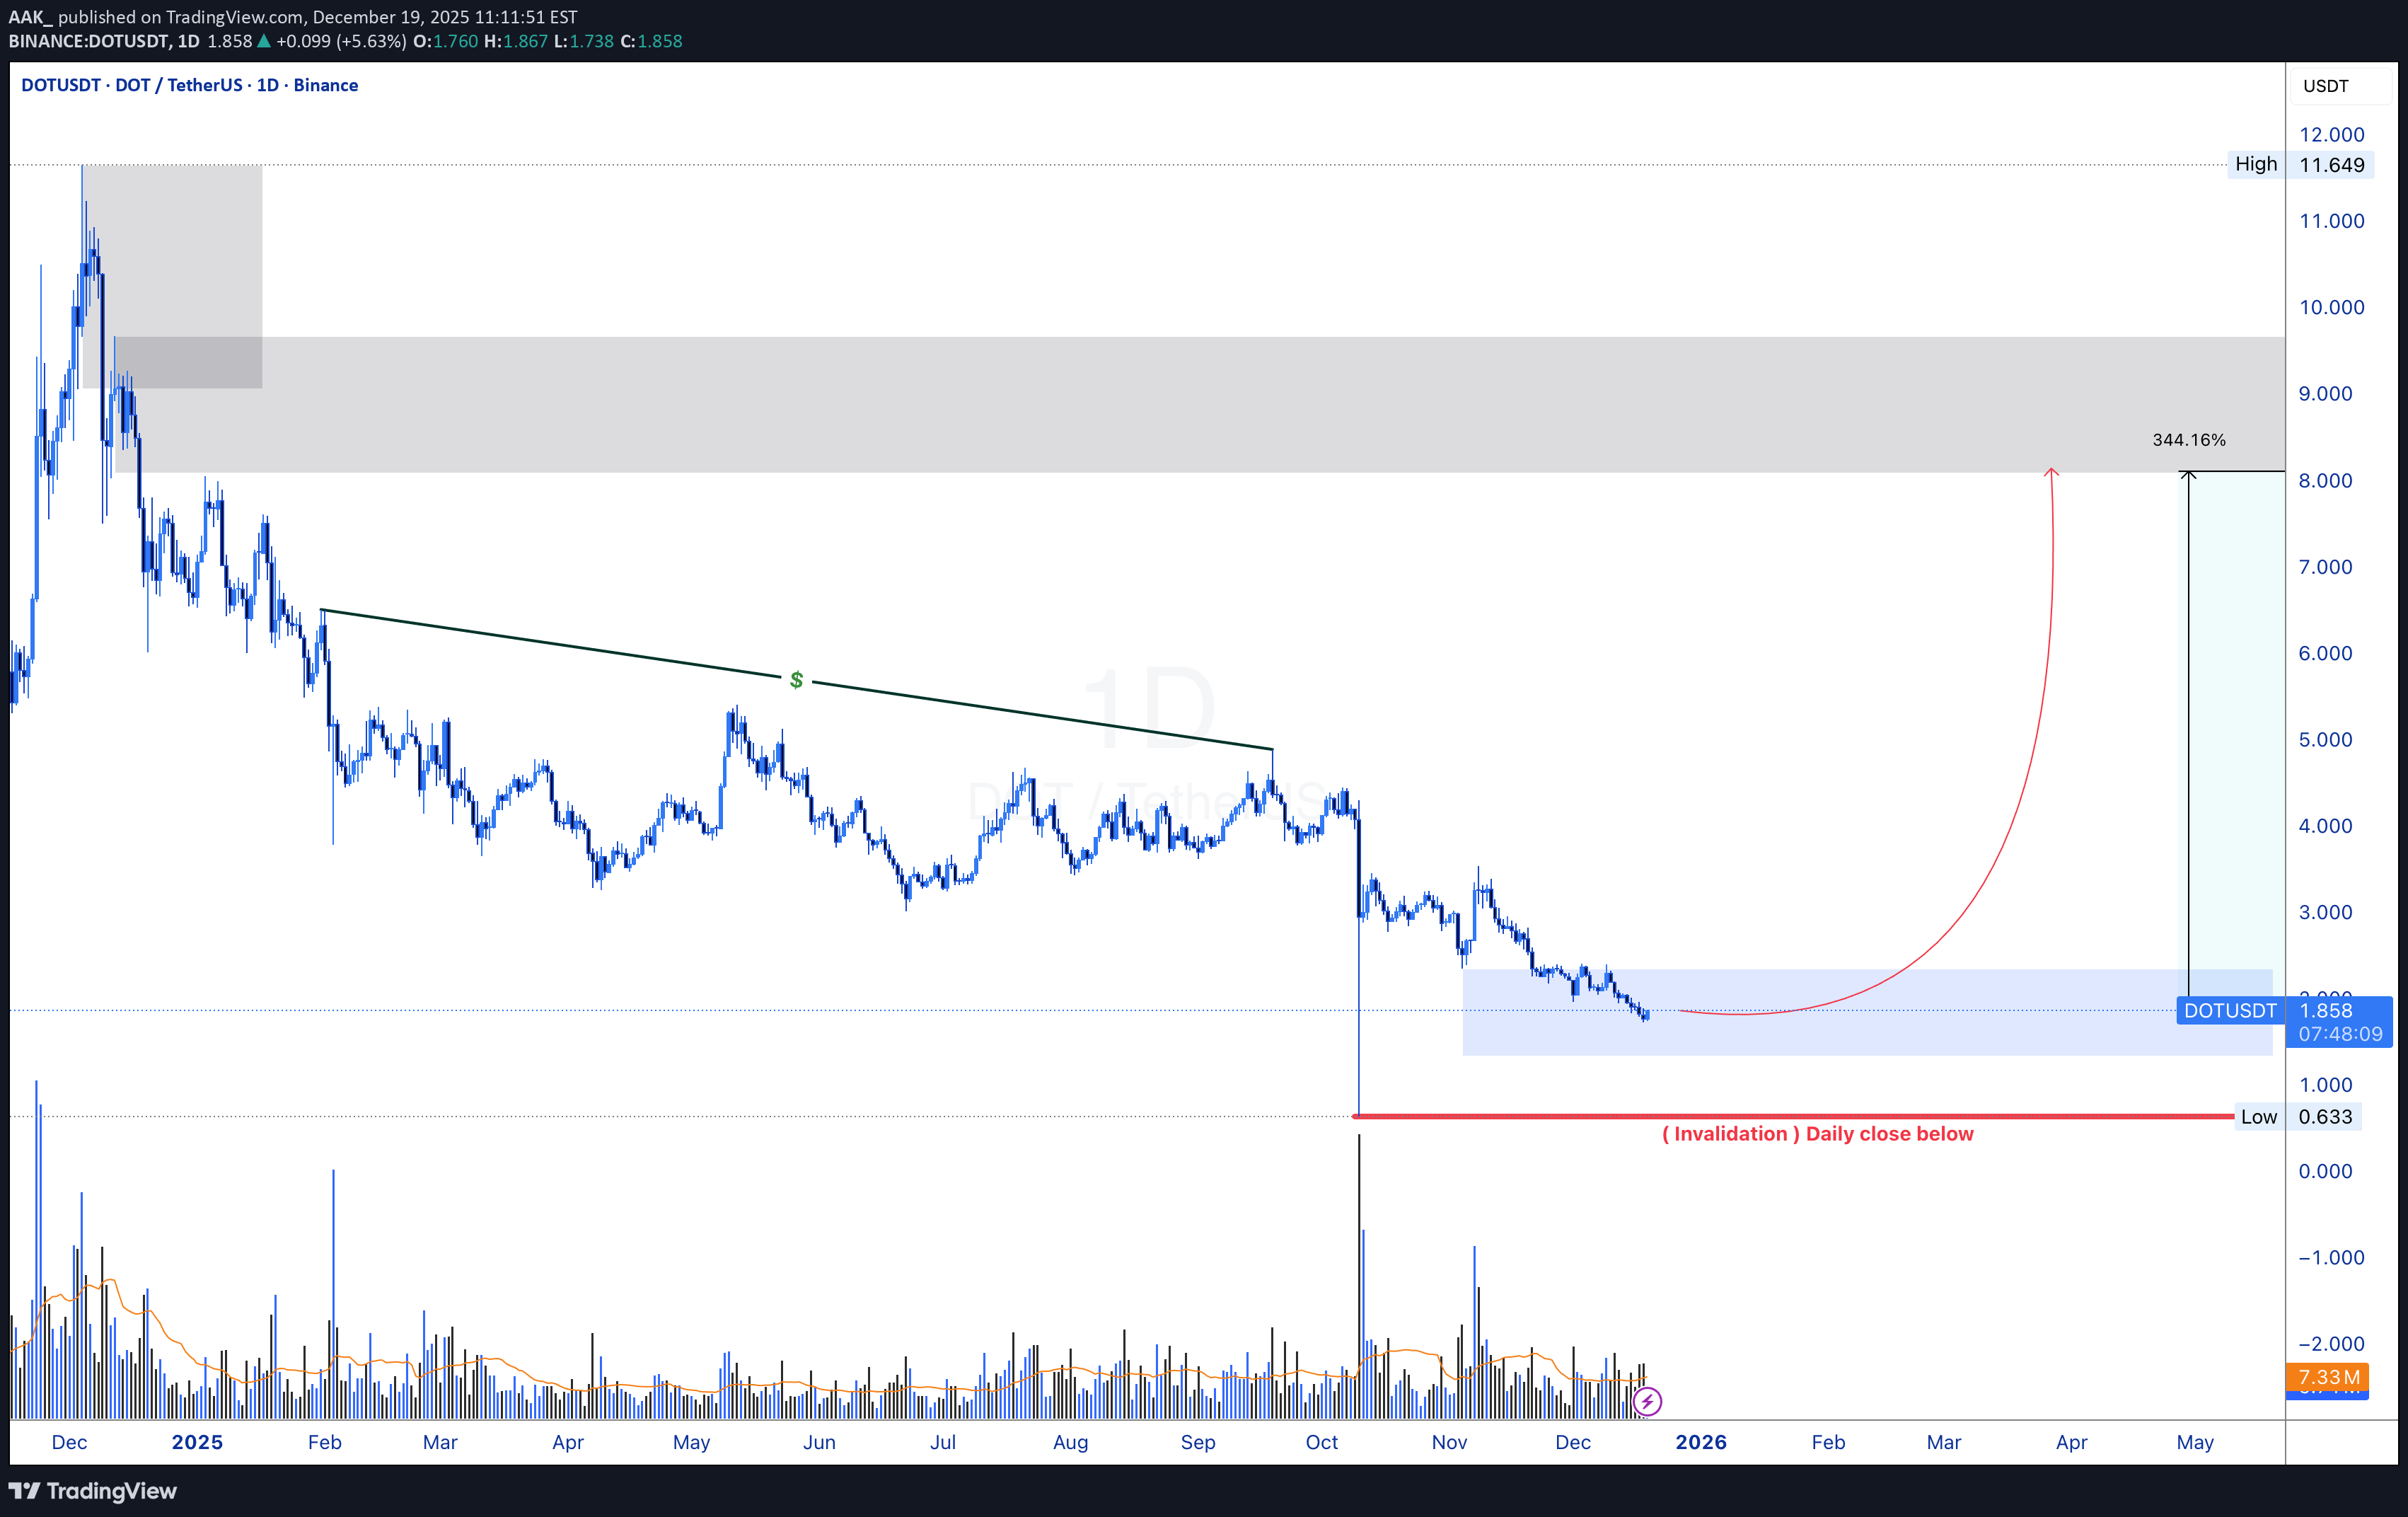
تم أخذ SSL → (الاتجاه الصعودی) توسع صعودی محتمل ومن المتوقع حدوث تراجع فی العرض للتخفیف هذا توقع طویل المدى، متوقع بحلول أوائل عام 2026 (الربع الأول). (هذه لیست نصیحة مالیة. تداول على مسؤولیتک الخاصة)
تحلیل تکنیکال DOTUSDT: سیگنال صعودی قوی با واگرایی مثبت! (اهداف و حد ضرر)
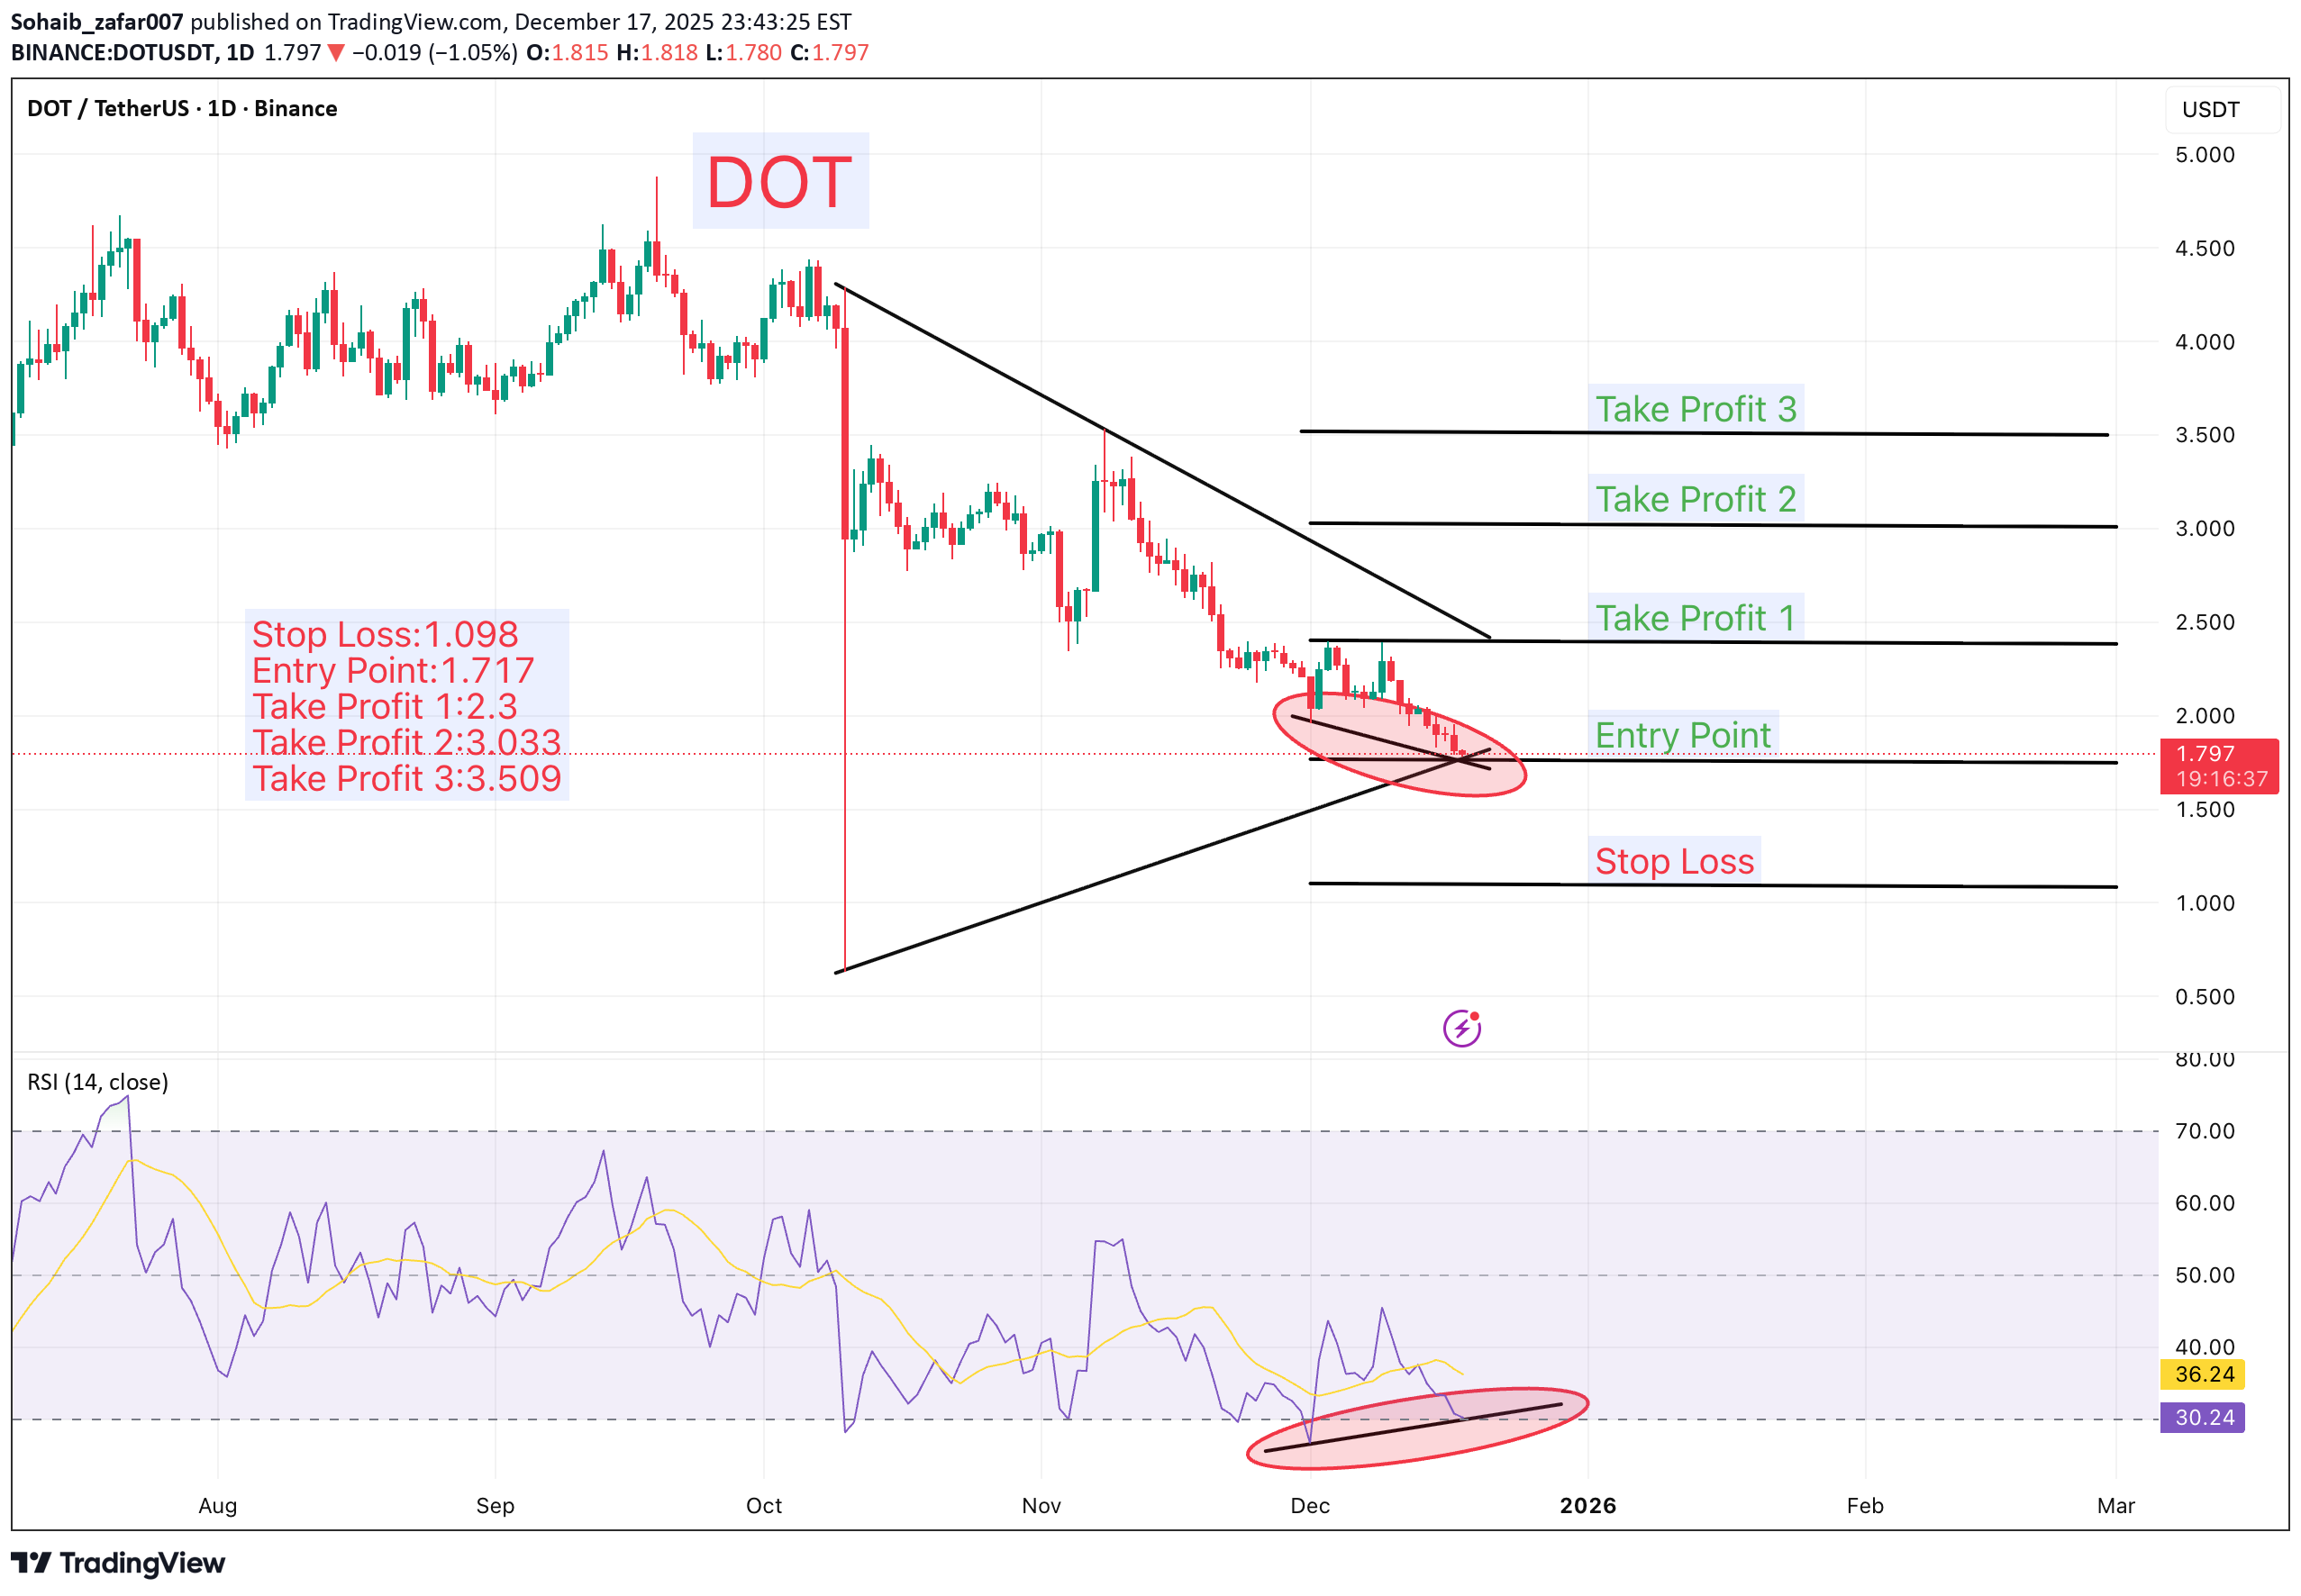
وقف الخسارة: 1.098 نقطة الدخول: 1.717 جنی الربح 1: 2.300 جنی الربح 2: 3.033 جنی الربح 3: 3.509 تشکل التباعد الصعودی عبر الأطر الزمنیة 1D و4H و1H، مما یشیر إلى انعکاس محتمل من الاتجاه الهبوطی إلى الاتجاه الصعودی. الدخول المقترح یقع حول 1.717، مع توقعات بتراجع السعر إلى move نحو الأهداف المتوقعة عند 2.300 و3.033 و3.509. ⚠️ تذکر دائمًا حمایة رأس مالک من خلال وقف الخسارة المناسب وإدارة المخاطر المنضبطة.

skainn


OpenYourMind1318
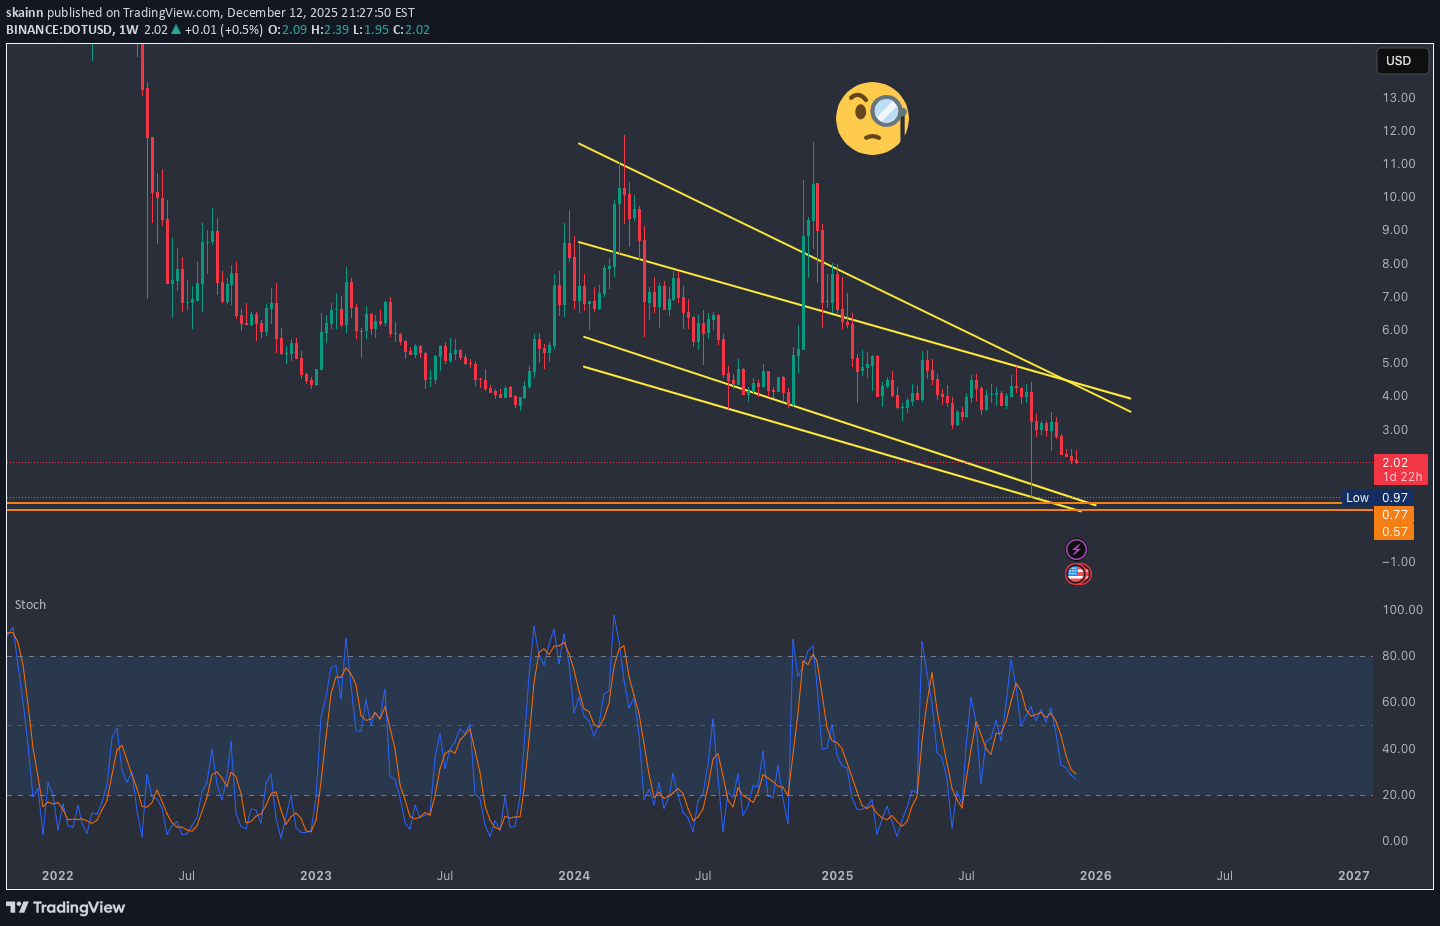
POLKADOT DOT DOTUSD 1W TF
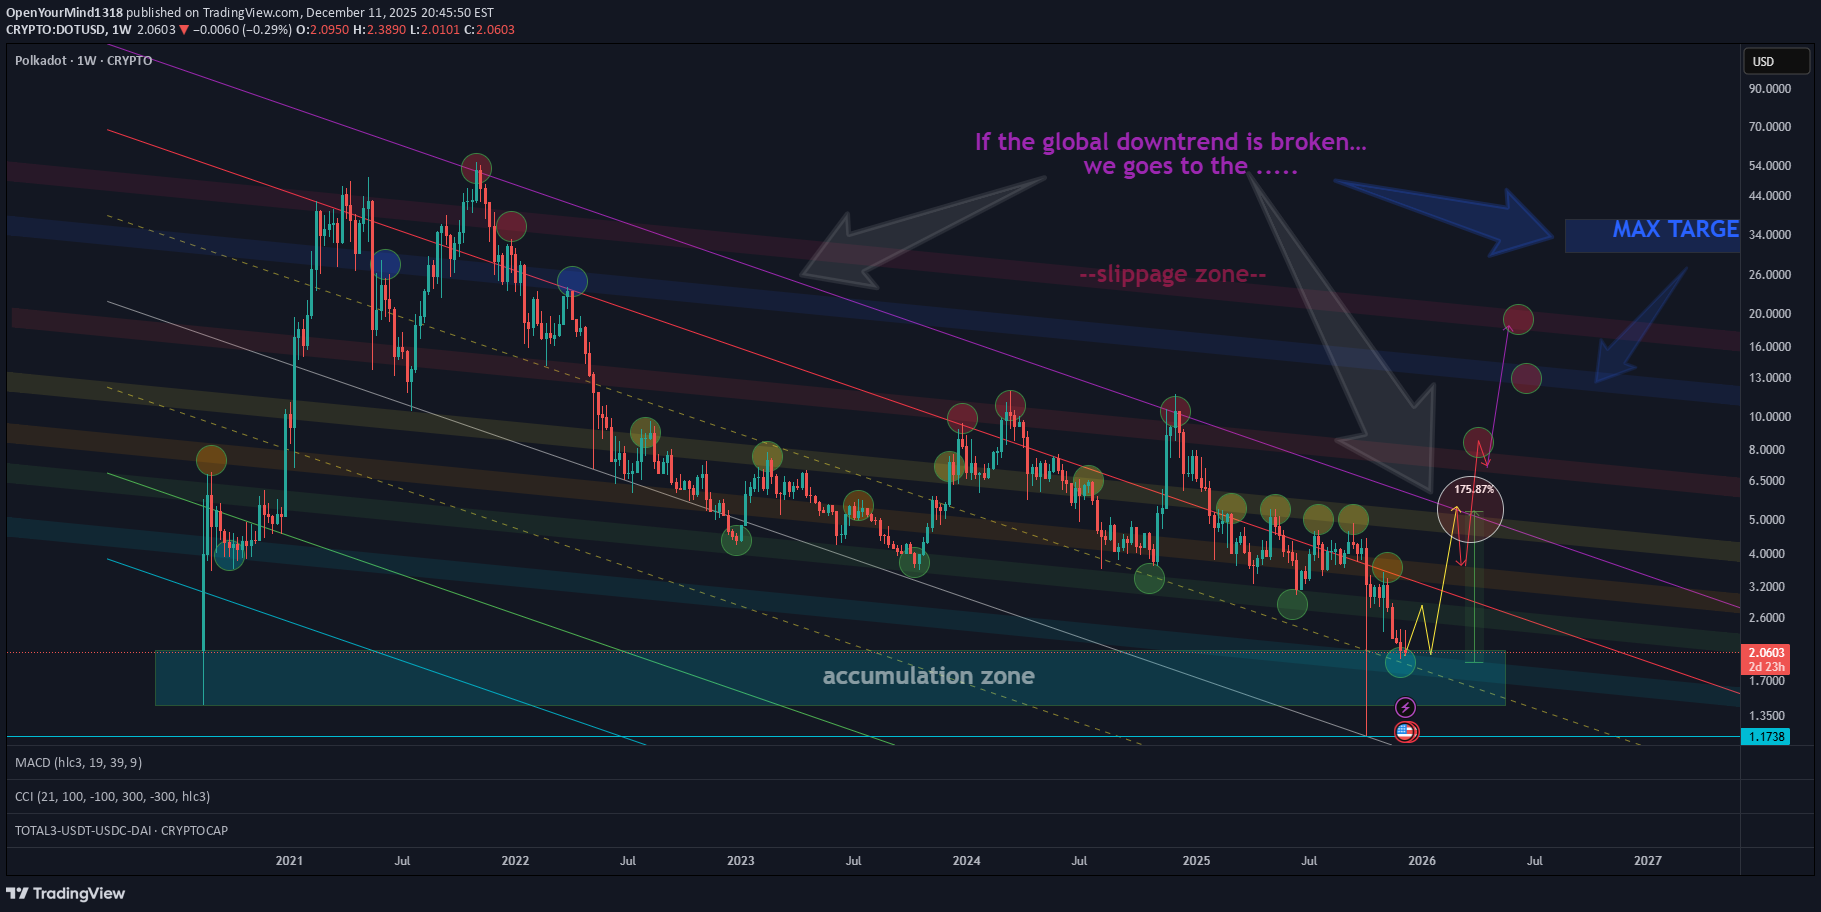
یظهر الرسم البیانی مستویات الدعم والمقاومة بالإضافة إلى الأهداف وصولاً إلى القناة الهابطة العالمیة. إذا تم کسر الاتجاه الهبوطی العالمی - فإن الحد الأقصى للهدف هو المنطقة الزرقاء. تمثل المنطقة red منطقة ضغط قصیرة تنشأ من المنطقة الزرقاء - والتی قد تحدث أو لا تحدث ویمکن أن یحدث الضغط أیضًا فی وقت مبکر. فی هذه اللحظة نحن فی منطقة تراکم الأصول.
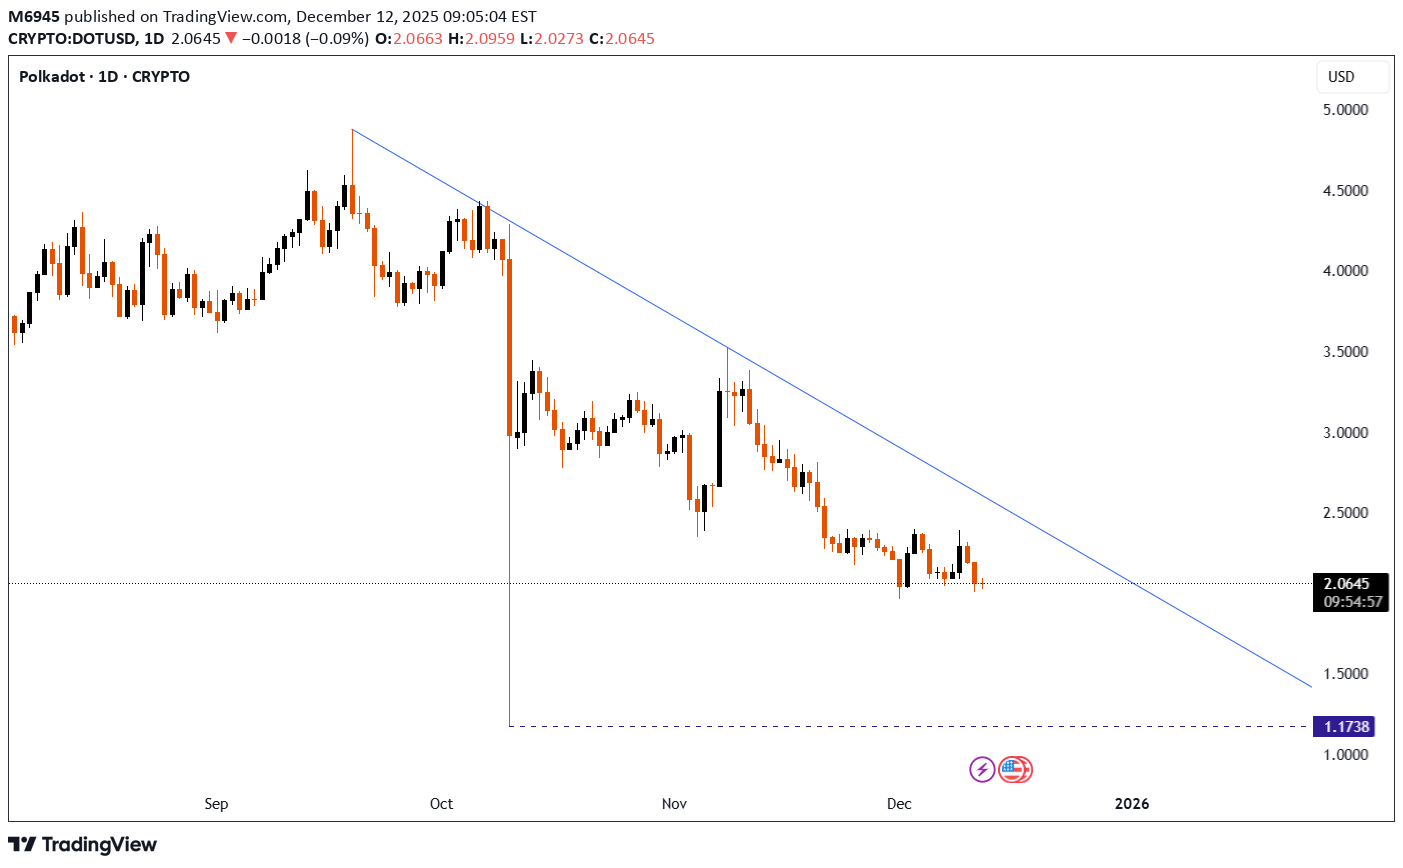
پولکادات (DOT) در آستانه جهش بزرگ؟ منتظر واکنش از ناحیه کلیدی بمانید!
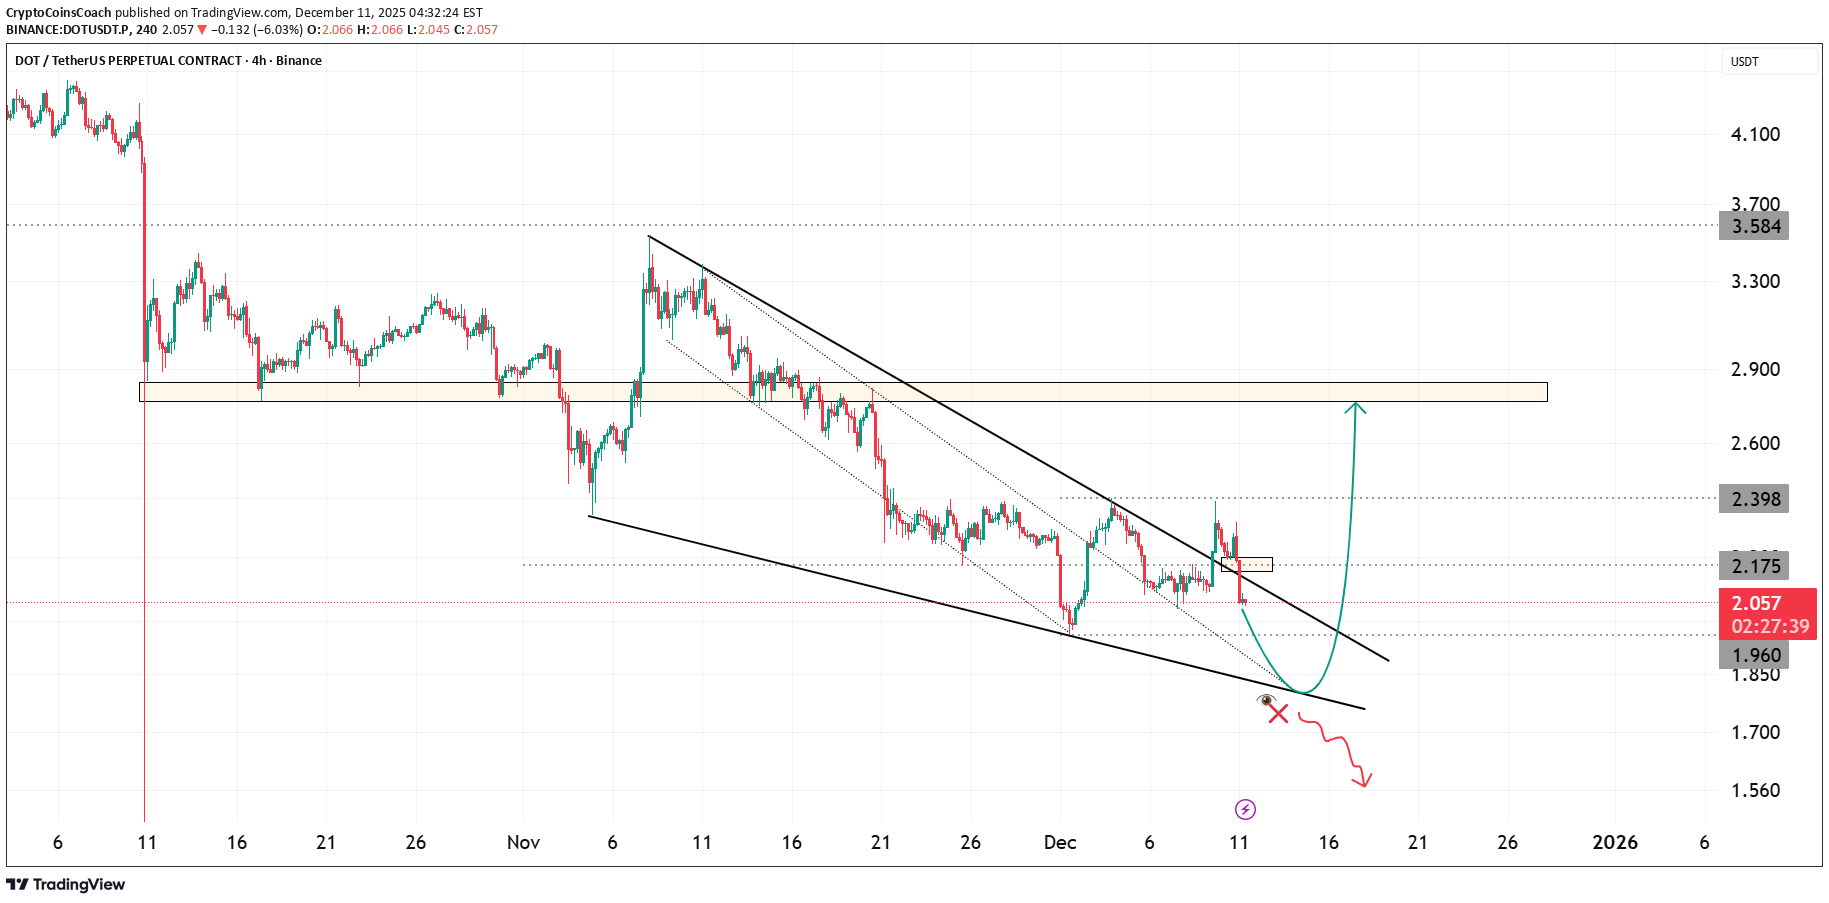
یستمر DOT فی التداول داخل إسفین هابط محدد جیدًا والذی کان یوجه السوق منذ أوائل نوفمبر. انخفض السعر مؤخرًا من النطاق المتوسط ویتجه الآن نحو الحد السفلی للوتد. لقد کانت هذه المنطقة بمثابة جیب للسیولة ومنطقة رد فعل عدة مرات فی الماضی. إذا وصل السعر إلى خط الاتجاه السفلی وأظهر رد فعل مستقر، فیمکن أن تبدأ موجة راحة نظیفة من هذه النقطة. الأهداف major التالیة تقع فی منطقتین. الأول هو مقاومة القناة الوسطى بالقرب من نقطتین وواحد سبعة. والثانیة هی منطقة الرفض الهبوطی الأوسع حول نقطتین وتسعة حیث فشل السعر عدة مرات خلال المحاولات السابقة. سیؤدی انهیار دعم القناة السفلیة إلى إبطال هذا السیناریو الصعودی وقد یفتح المجال نحو قیعان أعمق. رد الفعل بالقرب من أرضیة الإسفین سیحدد الاتجاه التالی. یرکز هذا الإعداد على هیکل السوق، وسلوک خط الاتجاه، ودینامیکیات القناة، وعملیات مسح السیولة. إنها تظل نظرة قائمة على رد الفعل ولیس التنبؤ. تظل إدارة التجارة ومراقبة المخاطر ضروریة فی هذه البیئة.

mastercrypto2020
سیگنال خرید فوری DOT/USDT: فرصت سود ۳ برابری با اهداف مشخص!
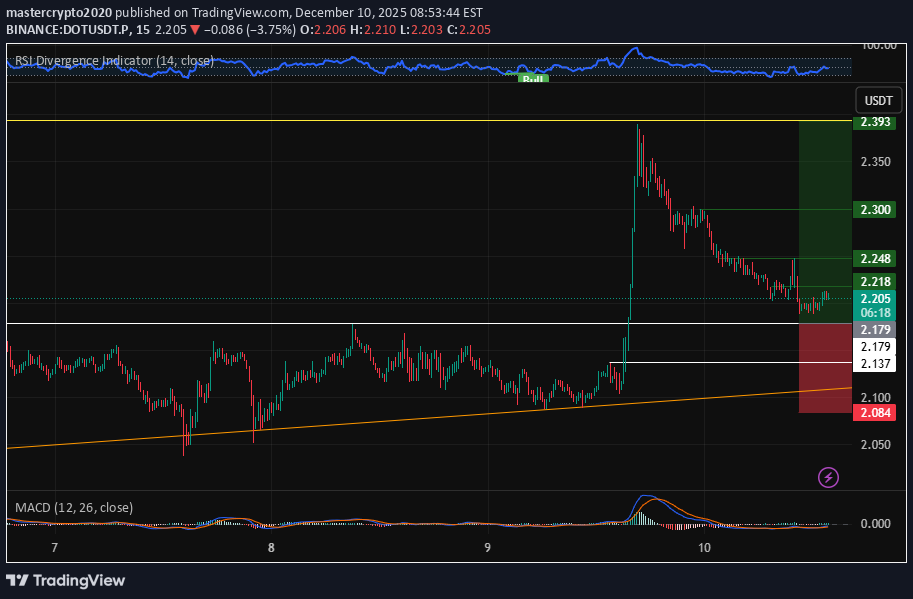
--- 📢 إشارة التجارة الرسمیة – DOT/USDT 📈 نوع الوظیفة: طویلة 💰 سعر الدخول: 2.179 (أمر محدد) --- 🎯 أهداف جنی الأرباح (الخروج الجزئی): • TP1: 2.218 • TP2: 2.248 • TP3 : 2.300 • TP4: 2.393 • تی بی 5: — --- 🛑 وقف الخسارة: 2.084 📊 الإطار الزمنی: 15m ⚖️ نسبة المخاطرة/المکافأة: ≈ 2.25 (على أساس TP4) 💥 الرافعة المالیة المقترحة: 3× – 5× --- 🧠 ملخص التحلیل الفنی یظهر DOT زخمًا صعودیًا محتملاً بعد استقراره بالقرب من منطقة الدعم الرئیسیة حول 2.179. قد یؤدی الاختراق الناجح فوق المقاومة المباشرة إلى تحفیز move نحو مناطق سیولة ذات إطار زمنی أعلى. یشیر هیکل الرسم البیانی 15m إلى تحول محتمل نحو الأعلى، مع أهداف واضحة تتماشى مع أعلى مستویات التأرجح السابقة ومستویات السیولة فی دفتر الطلبات. الأهداف الصعودیة الحاسمة: 2.218 → 2.248 → 2.300 → 2.393 قد یؤدی الارتفاع المستمر move فوق TP1 (2.218) إلى تسریع الزخم نحو 2.300 و2.393. --- ⚙️ قواعد إدارة التجارة ✔ احصل على ربح جزئی عند کل مستوى TP ✔ Move وقف الخسارة إلى نقطة الدخول بمجرد الوصول إلى TP1 ✔ تتبع وقف الخسارة مع تقدم السعر نحو الأهداف الأعلى ✔ لا یجوز إعادة الدخول إذا تم تفعیل وقف الخسارة (2.084). ✔ تأکید الترکیبة الصعودیة على الرسم البیانی 15m قبل الدخول --- 📌 علامات التصنیف TradingView #DOTOUSDT #DOT #CryptoSignal #LongTrade #عرض التداول #تداول العقود الآجلة #التحلیل الفنی --- اسمحوا لی أن أعرف إذا کنت ترغب فی ترجمة هذا إلى اللغة الفارسیة أو تعدیله بأی شکل من الأشکال.

House-of-Technicals
Double bottom
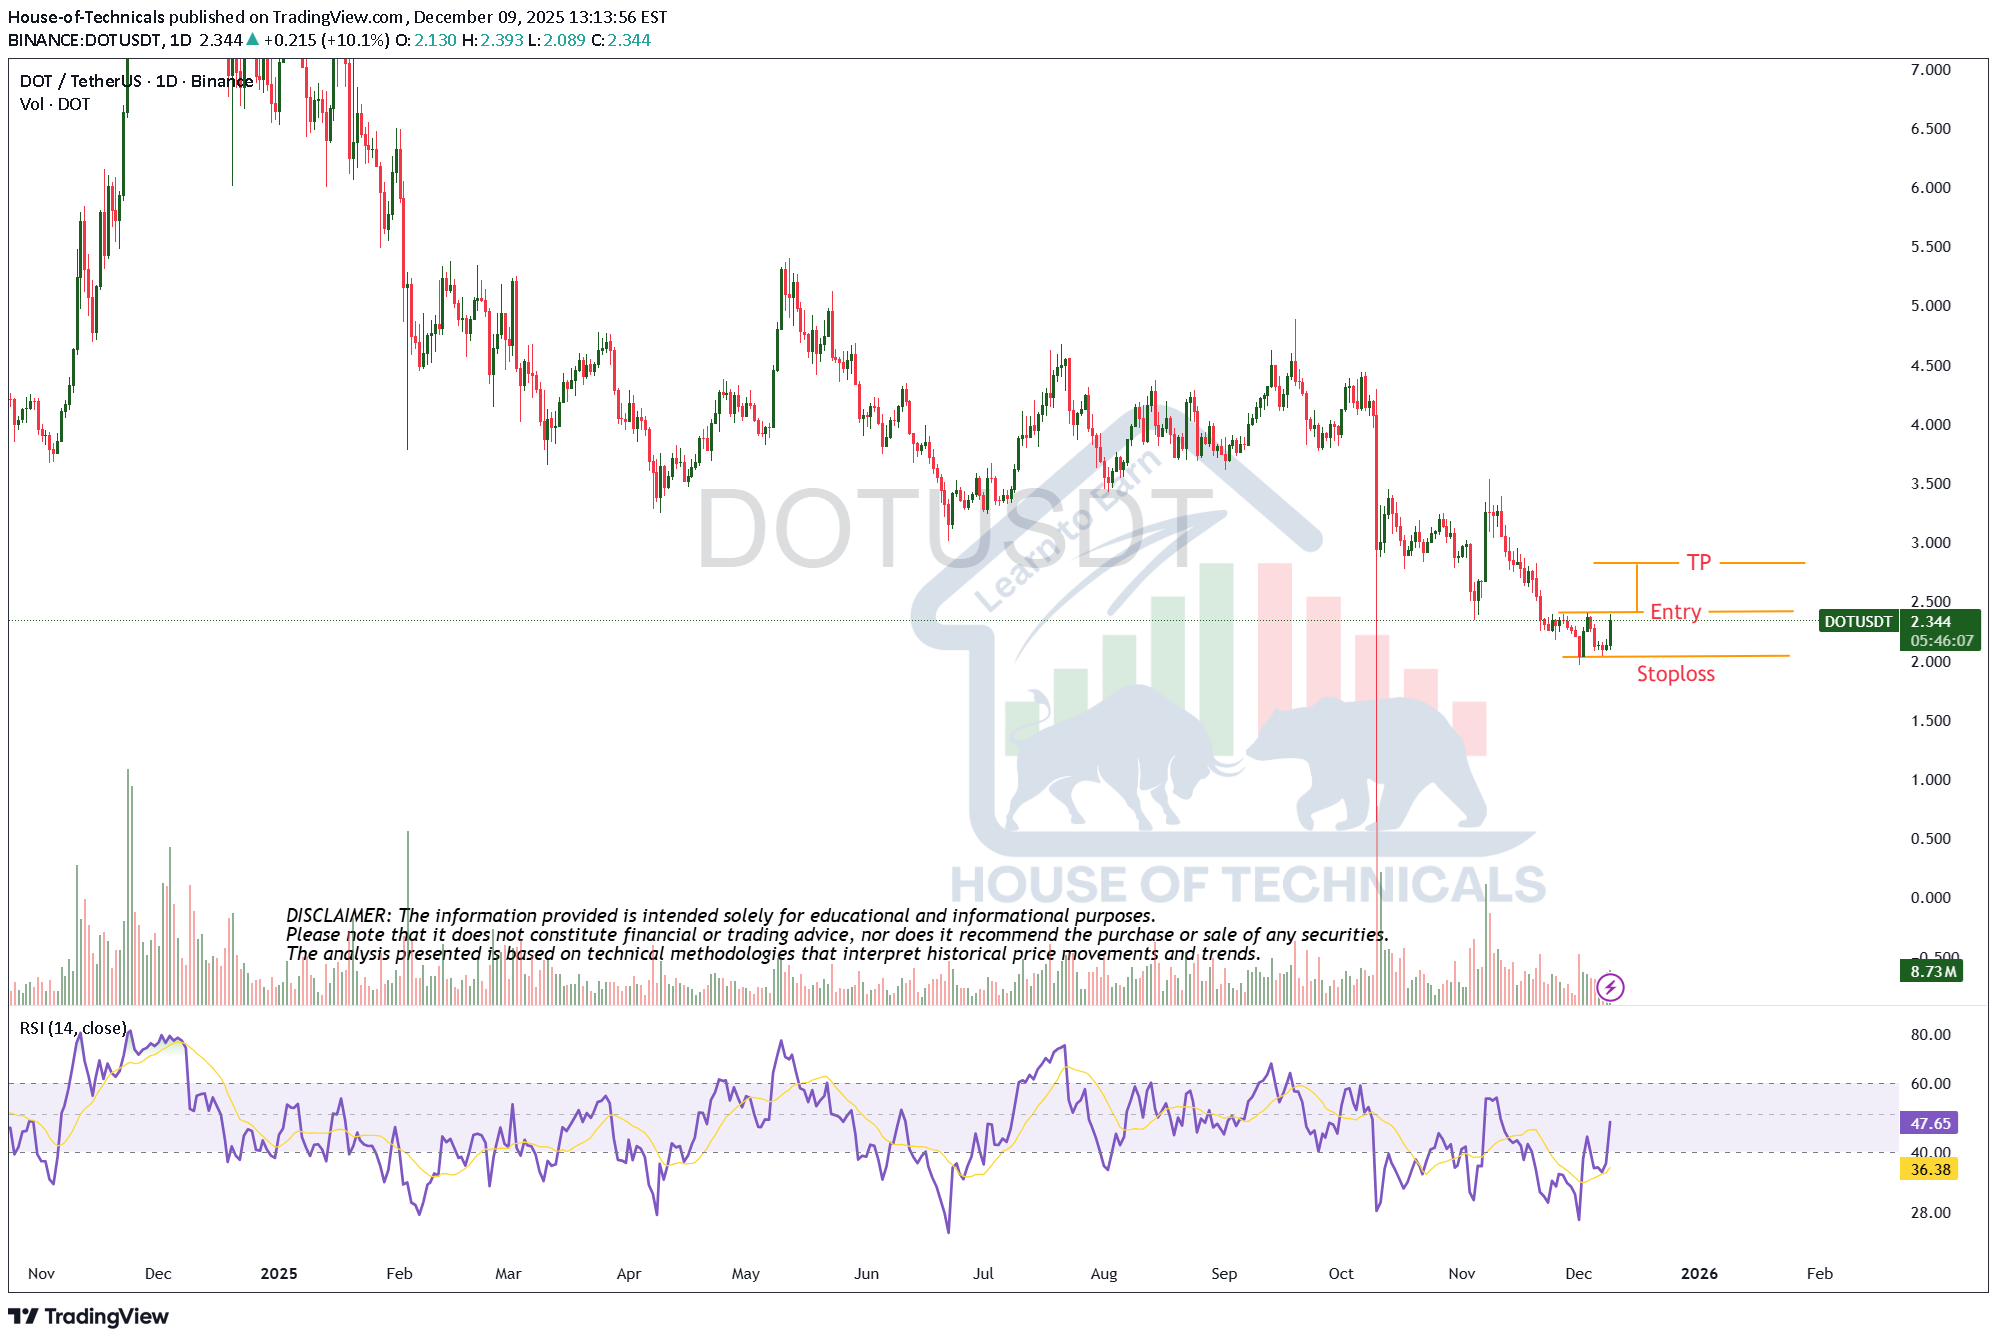
09-12-2025 قد یؤدی القاع المزدوج مع التباعد الصعودی إلى رفع السعر.

SwallowAcademy
Polkadot (DOT): Looking For Bullish Movement | Unfilled Zone
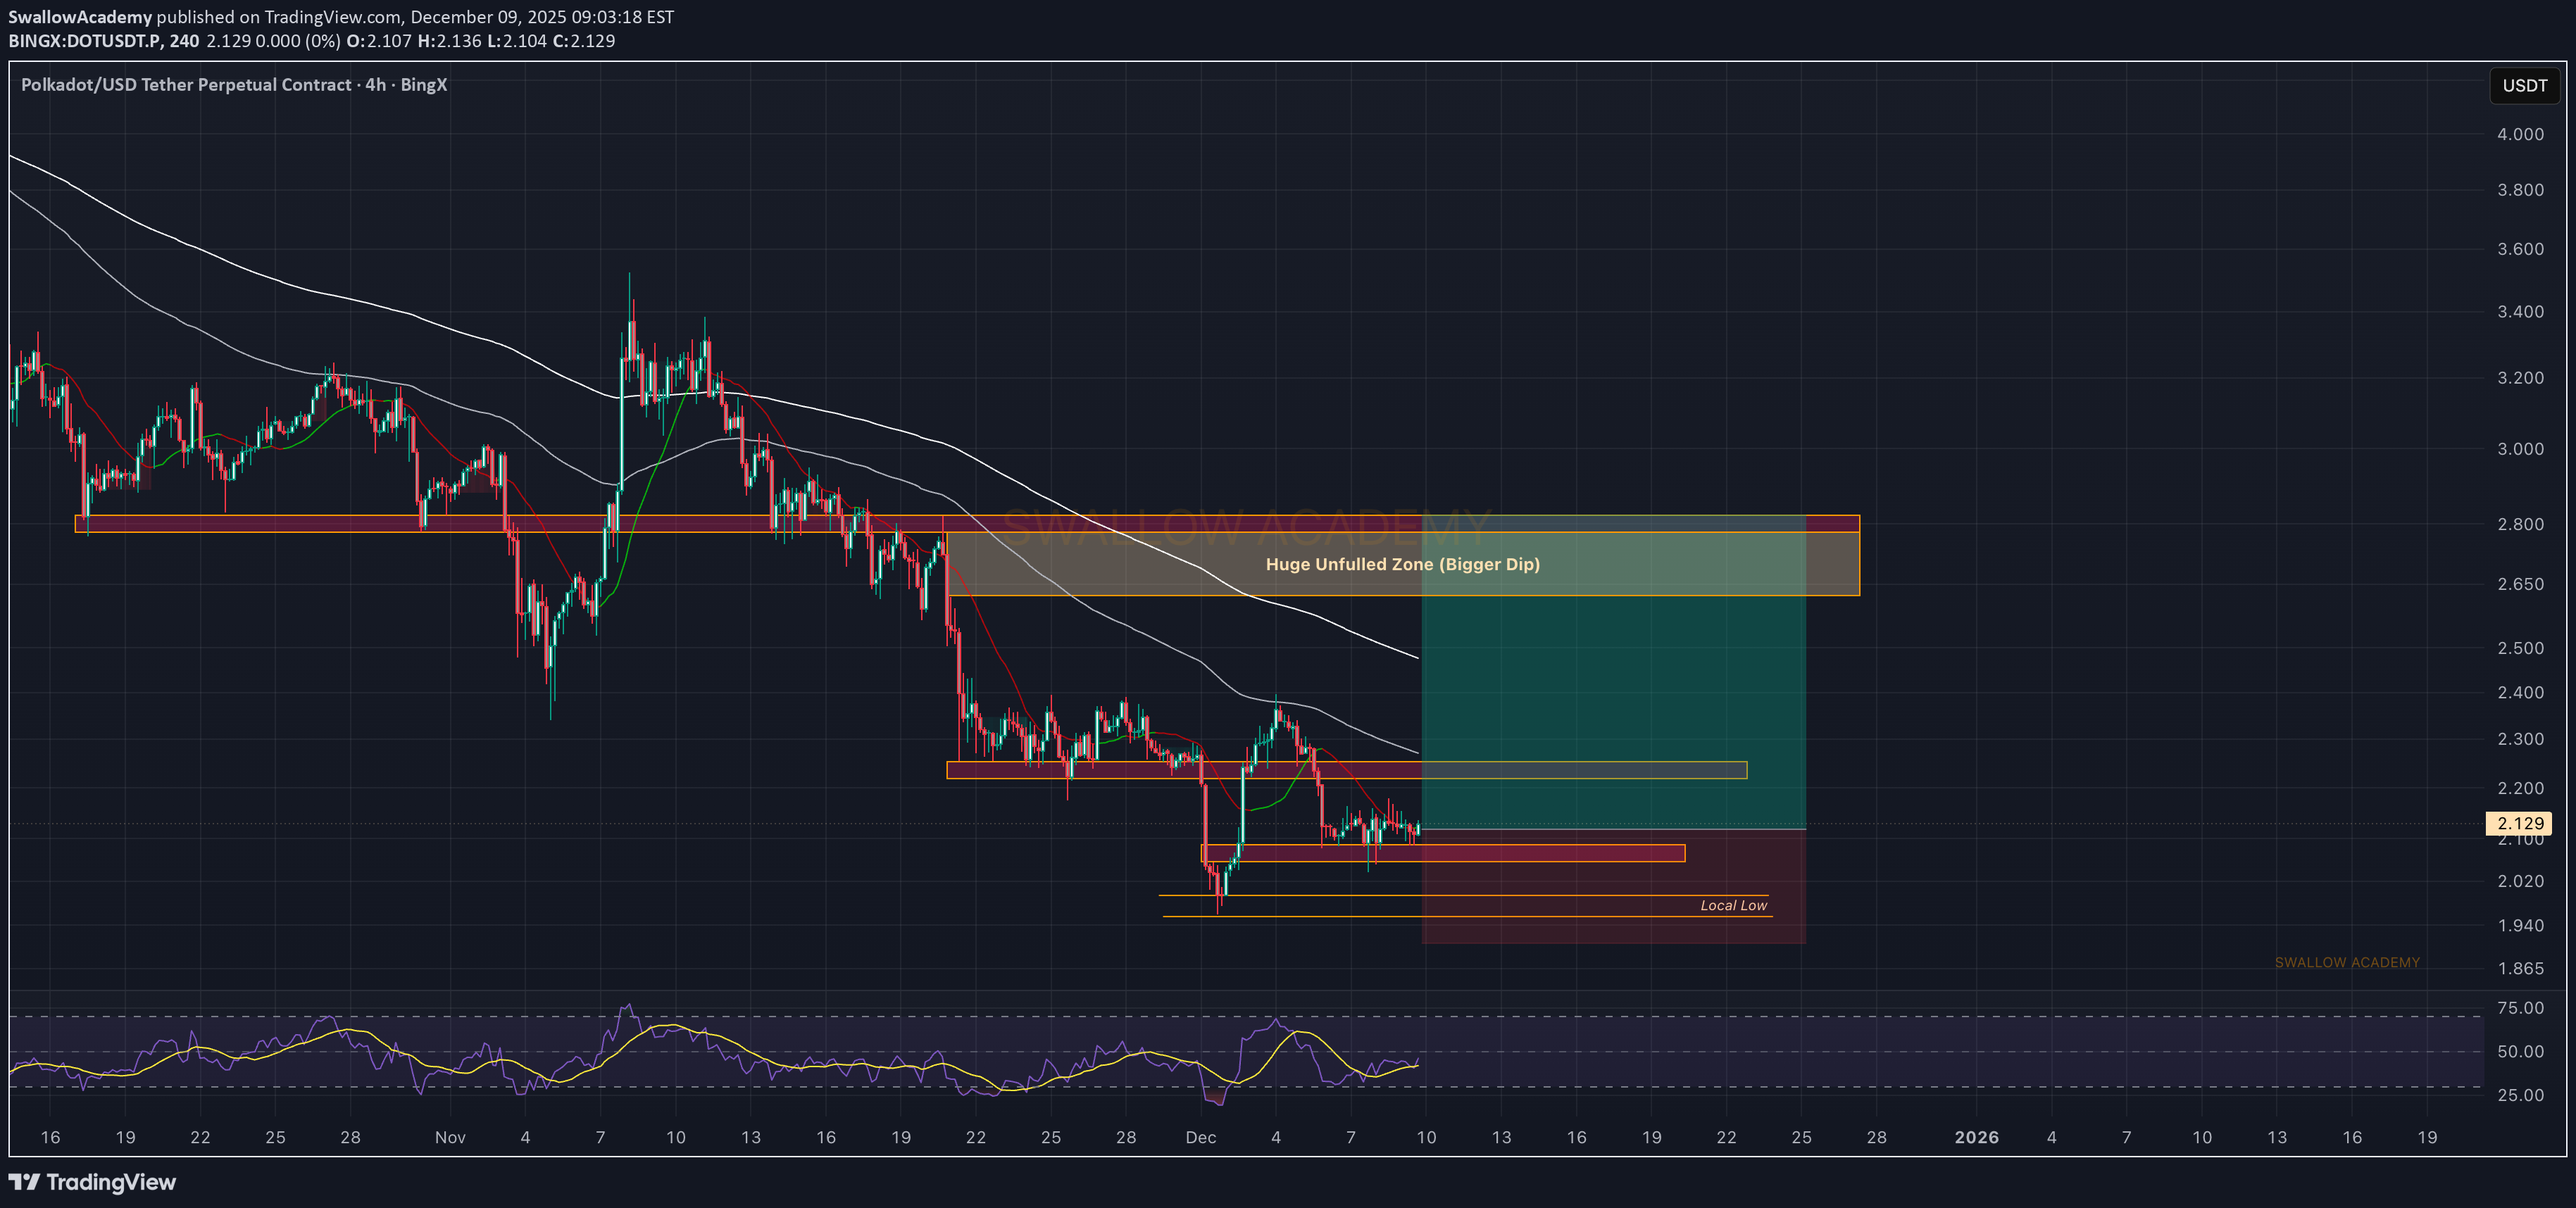
یحتفظ DOT بمنطقة الدعم الأصغر جیدًا، وهذا هو بالضبط المکان الذی بدأت فیه الإشارات الصعودیة الأولى form. تم التقاط الصنبور إلى تلک المنطقة بسرعة، مما یدل على أن المشترین على استعداد للرد هناک، ولهذا السبب فإن الشراء منطقی من هذه المنطقة. ما نحتاجه بعد ذلک هو استعادة واضحة للمقاومة قصیرة المدى أعلاه. هذا هو التأکید الذی یفتح move باتجاه المنطقة الفارغة فی الأعلى. وحتى حدوث هذا الاختراق، تظل الفکرة کما هی - یحاول المشترون بناء الزخم من هذا الدعم، ویتحول الهیکل ببطء لصالحهم. أکادیمیة السنونو

Cryptollica
POLKADOT ($DOT)
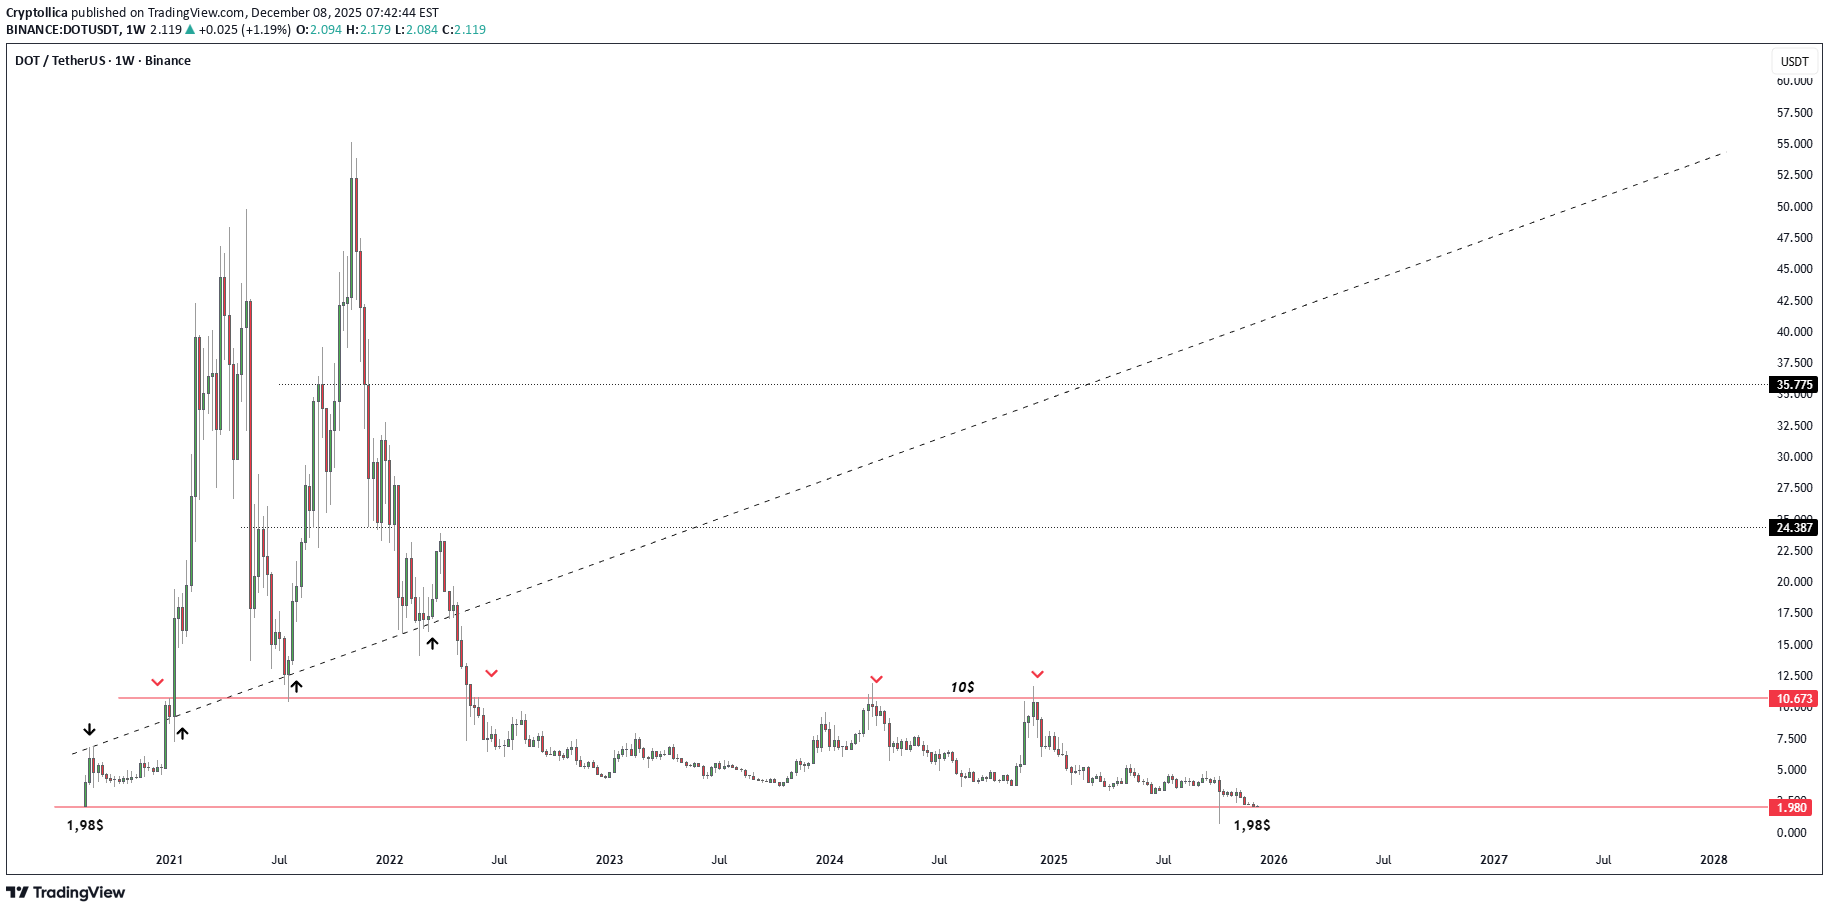
Polkadot (DOT) الرسم البیانی الأسبوعی (1W) التحلیل الفنی بفحص الرسم البیانی الأسبوعی Polkadot (DOT)، یمکننا أن نرى أن الأصل عند منعطف تاریخی وحرج للغایة. من وجهة نظر المحلل الفنی، دعونا نفصل هذا الرسم البیانی فیما یتعلق بدورة السوق، ومستویات الدعم/المقاومة الحرجة، وهیکل الاتجاه. 1. هیکل السوق العام وتحلیل الدورة یوضح الرسم البیانی بوضوح دورة "الازدهار والکساد" الکلاسیکیة. إعادة ضبط الدورة الکاملة: عاد السعر إلى نقطة البدایة الدقیقة للموجة الصعودیة الهائلة التی بدأت فی أواخر عام 2020 (حوالی 1.98 دولار). وهذا یعنی أن حرکة السعر خلال السنوات الخمس الماضیة قد تم محوها بشکل فعال، مما أعاد السوق إلى "نقطة الصفر". توقعات الاتجاه: یهیمن السوق الهابط على الهیکل الرئیسی حالیًا. تم کسر خط الاتجاه الصاعد major (الخط المتقطع) فی أوائل عام 2022، وظل السعر مکبوتًا تحت هذا الاتجاه منذ ذلک الحین. 2. مستویات الأسعار الحرجة أهم المناطق الفنیة على الرسم البیانی هی کما یلی: 🟢 Major الدعم: 1.98 دولار - 2.00 دولار منطقة ("قبلة الحیاة") هذه المنطقة هی مستوى "الإنشاء أو الانفصال" لـ DOT. الأهمیة التاریخیة: هذا هو المکان الذی نشأ فیه التجمع التاریخی لعام 2020. تشیر العودة إلى هذا المستوى إلى أننا قد نکون عند نقطة الإرهاق التام للبائع (الاستسلام). التوقعات الفنیة: من المحتمل جدًا حدوث رد فعل/ارتداد قوی من هذا المستوى من الناحیة الفنیة. ومع ذلک، فإن الإغلاق الأسبوعی تحت هذا المستوى من شأنه أن یسحب السعر إلى "اکتشاف السعر" إلى الجانب الهبوطی (منطقة غیر معروفة). 🔴 Major المقاومة: 10.67 دولار (خط Red) تم تحدید هذا کـ "10 دولارات" على الرسم البیانی، وهو حاجز المقاومة الأکثر أهمیة. حاول السعر اختراق هذا المستوى فی الأعوام 2022 و2023 و2024، ولکن تم رفضه فی کل مرة (کما هو موضح بواسطة الأسهم السفلیة red). ومن المستحیل من الناحیة الفنیة الحدیث عن اتجاه صعودی جدید حتى یتم استعادة هذا المستوى بشکل حاسم. ⚠️ المقاومة المتوسطة وخط الاتجاه المکسور الاتجاه الصاعد المکسور: یعمل الخط الأسود المتقطع الآن کمقاومة قطریة قویة. کل محاولة صعودیة تصل إلى هذا الخط أو المقاومة الأفقیة وترتد. الأهداف المتوسطة: فی حالة الانعکاس المحتمل، من المرجح أن یکون مستوى 4.50 دولار - 5.00 دولار band act کأول مقاومة وسیطة. 3. التکوین الفنی والتفسیر رحلة ذهابًا وإیابًا (اکتمال الدورة): یشیر الانخفاض من مستویات 55 دولارًا إلى 2 دولارًا إلى اکتمال الدورة بشکل کبیر. عادةً ما تتبع نهایة مثل هذه الانخفاضات الکبیرة مرحلة طویلة من "التراکم الأفقی". القمة الثلاثیة / الرفض: الرفض المتعدد عند مستوى 10 دولارات (سیظهر حوالی عام 2024) prove هناک کتلة کبیرة من العرض (البائع) فی تلک المنطقة. 4. استراتیجیة المستثمر والسیناریوهات کمحلل للسوق، یمکن بناء سیناریوهین رئیسیین بناءً على هذا الرسم البیانی: السیناریو أ: "الصید فی القاع" (انعکاس صعودی) الأطروحة: السعر عند الدعم التاریخی (1.98 دولار). تعتبر نسبة المخاطرة إلى المکافأة (R/R) عند النقطة الأکثر جاذبیة للمشترین. الإستراتیجیة: یمکن محاولة التراکم التدریجی فی نطاق 1.98 دولارًا - 2.10 دولارًا، مع وضع وقف الخسارة بشکل صارم تحت 1.80 دولارًا. الهدف: هدف رد الفعل الأول هو 4-5 دولارات band. على المدى الطویل، یمکن اختبار الحد +10 دولارات مرة أخرى. وربما القدیم ATH = 50 دولارًا
إخلاء المسؤولية
أي محتوى ومواد مدرجة في موقع Sahmeto وقنوات الاتصال الرسمية هي عبارة عن تجميع للآراء والتحليلات الشخصية وغير ملزمة. لا تشكل أي توصية للشراء أو البيع أو الدخول أو الخروج من سوق الأوراق المالية وسوق العملات المشفرة. كما أن جميع الأخبار والتحليلات المدرجة في الموقع والقنوات هي مجرد معلومات منشورة من مصادر رسمية وغير رسمية محلية وأجنبية، ومن الواضح أن مستخدمي المحتوى المذكور مسؤولون عن متابعة وضمان أصالة ودقة المواد. لذلك، مع إخلاء المسؤولية، يُعلن أن المسؤولية عن أي اتخاذ قرار وإجراء وأي ربح وخسارة محتملة في سوق رأس المال وسوق العملات المشفرة تقع على عاتق المتداول.