
W
Wormhole
| تریدر | نوع سیگنال | حد سود/ضرر | زمان انتشار | مشاهده پیام |
|---|---|---|---|---|
Sonuç bulunamadı. | ||||
Wormhole Fiyat Grafiği
سود Üç Ay :
سیگنالهای Wormhole
filtre
Mesajı şuna göre sırala
Tüccar Türü
timeframe

سیگنال خرید فوری W/USDT: با لوریج بالا، آماده کسب سود شوید!
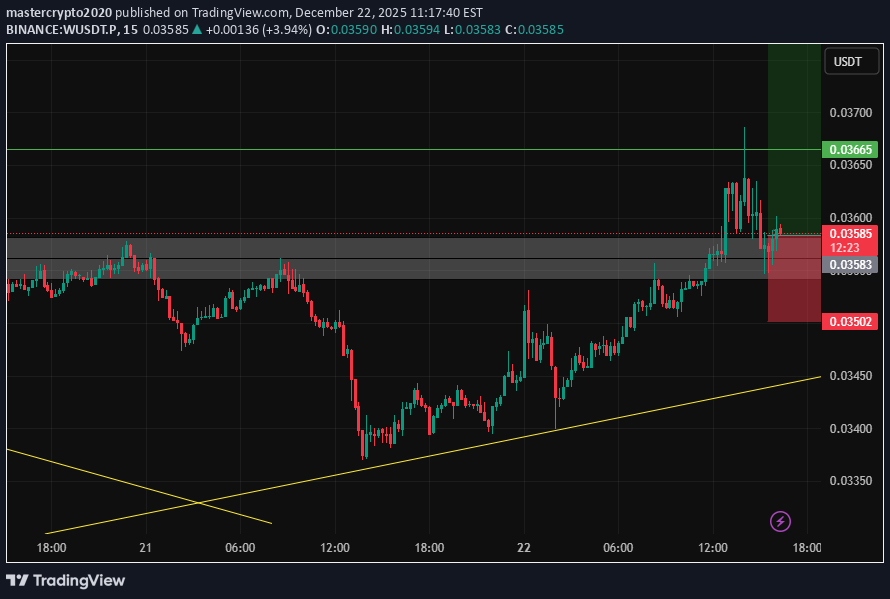
📢 Resmi Ticaret Sinyali – USDT ile 📈 Pozisyon Türü: UZUN 💰 Giriş Fiyatı: 0.03584 (Limitli Emir) 🎯 Kâr Alma Hedefleri (Kısmi Çıkışlar): • TP1: 0,03665 • TP2: 0,03767 • TP3: 0,03870 • TP4: — • TP5: — • TP6: — 🛑Zarar Durdurma: 0,035 📊 Zaman aralığı: 15m ⚖️ Risk/Ödül Oranı: Belirlenecek 💥 Önerilen Kaldıraç: 5× – 10× 🧠 Teknik Analiz Özeti W/USDT, 0,035 civarında destekle yükseliş momentumu gösteriyor. Fiyat, 15m grafiğinde bu seviyeden olumlu tepki vererek daha yüksek dipler oluşturuyor ve satın alma ilgisini doğruluyor. Kısmi kar alma işlemleri likidite bölgeleriyle uyumludur: 0,03665 → 0,03767 → 0,03870 TP1'in (0,03665) kırılması daha yüksek hedeflere ulaşma olasılığını artırır. ⚙️ Ticaret Yönetim Kuralları ✔ TP1'de kısmi kar elde edin ✔ Move TP1'e ulaşıldığında SL'den Başabaş'a geçiş ✔ Fiyat daha yüksek hedeflere yaklaştıkça Trail SL ✔ SL vurulursa yeniden girişten kaçının ✔ Girmeden önce yapıyı onaylayın 📌 TradingView Hashtagleri #WUSDT #CryptoSignal #LongSetup #TradingView #FuturesTrading #Altcoins #TeknikAnaliz

Wormhole: غول پلهای بلاکچین با ۲ میلیارد دلار قفل شده (همکاری با بلکراک)

Merhaba Wormhole, TVL'de 2B+'a sahiptir ve BlackRock ve diğer bazı büyük kurumlar için köprüleme ve çapraz zincir işlemlerine liderlik etmektedir. Bu bir ticaret tavsiyesi değildir. teşekkürler Gex

شکاف کرمچاله و USD: راز خروج از کانال نزولی بلندمدت!
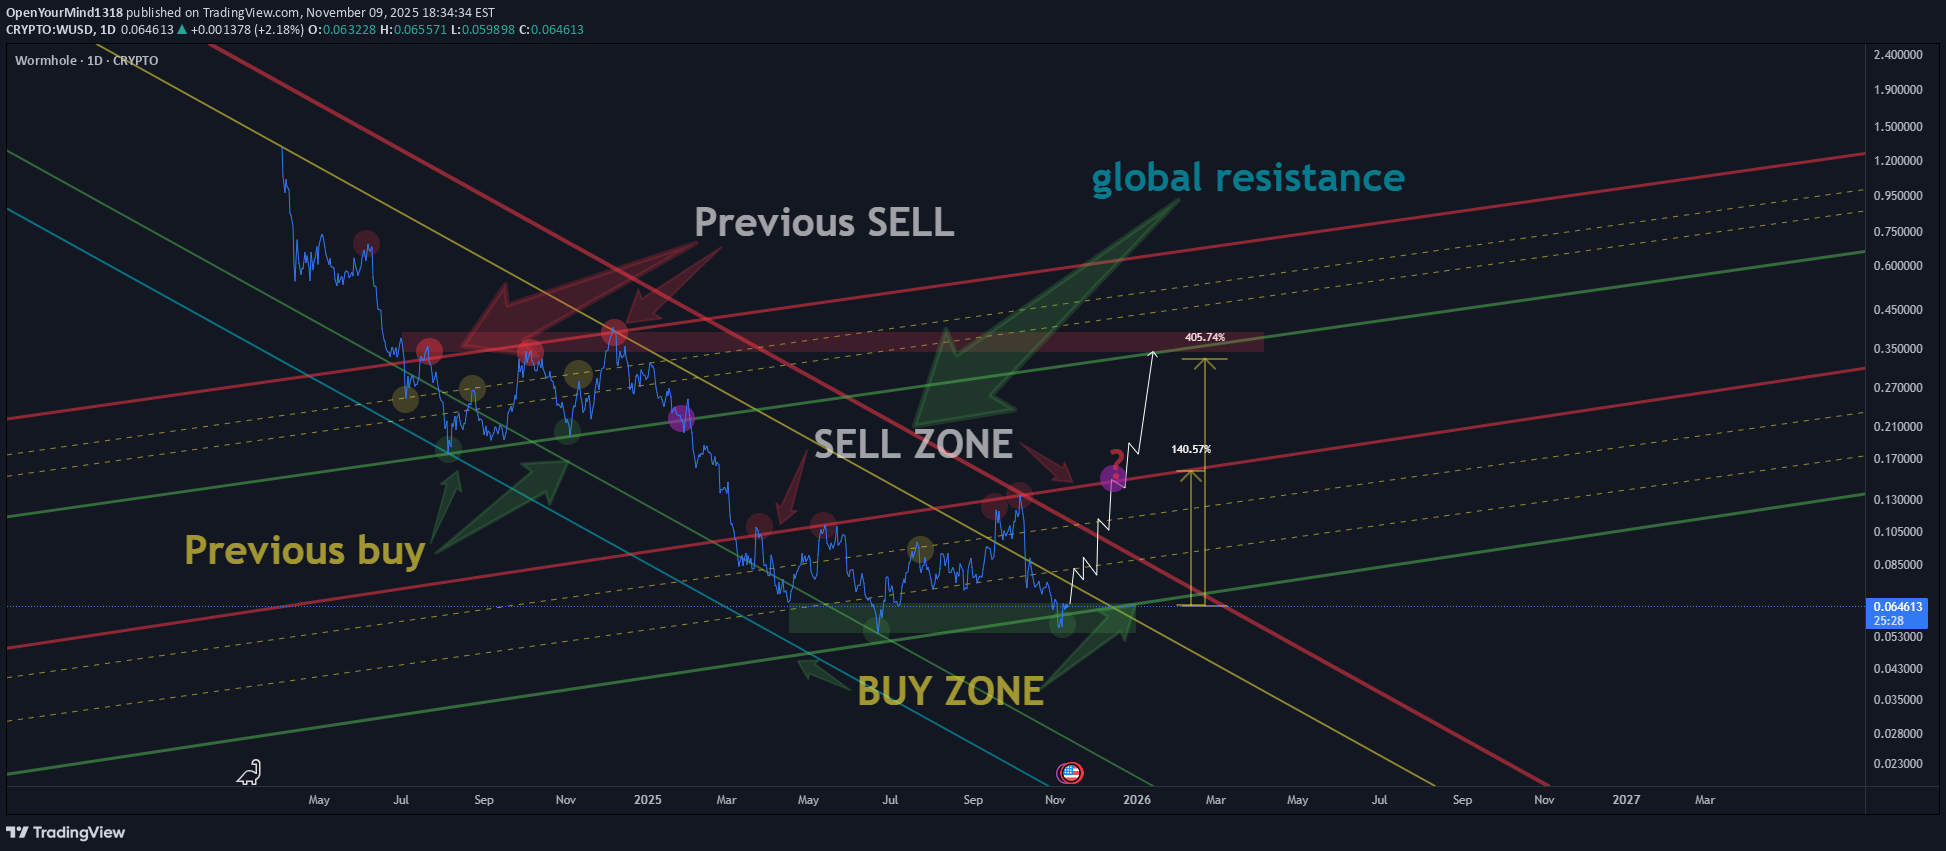
Grafikte iki kanal görüyoruz: biri önceki movement'a verilen tepkiyi yansıtıyor, diğeri ise potansiyel mevcut kurulumu gösteriyor. Her kanalın içinde bir belirsizlik bölgesi vardır (kesikli çizgilerle işaretlenmiştir) — bu aralıkta fiyat zayıf ellerden kurtulabilir ve pozisyon biriktirebilir. Bu bölgenin üzerinde bir kırılma ve güvenli bir mum kapanışının ardından, güçlü bir yükseliş move bekleyebiliriz. Kilit nokta, dürtüyü onaylamak için mum gövdesinin bölge sınırının üzerinde kapanmasını beklemektir. Ek olarak fiyat hala küresel azalan bir kanal içerisinde hareket ediyor. Daha yüksek hedeflere ulaşmak için piyasanın bu uzun vadeli düşüş trendi kanalının üst sınırının üzerinde kalması çok önemli.

آینده WUSDT: انتظار جهش بزرگ پس از شکست مقاومت! (اهداف تا ۰.۲۵ دلار)
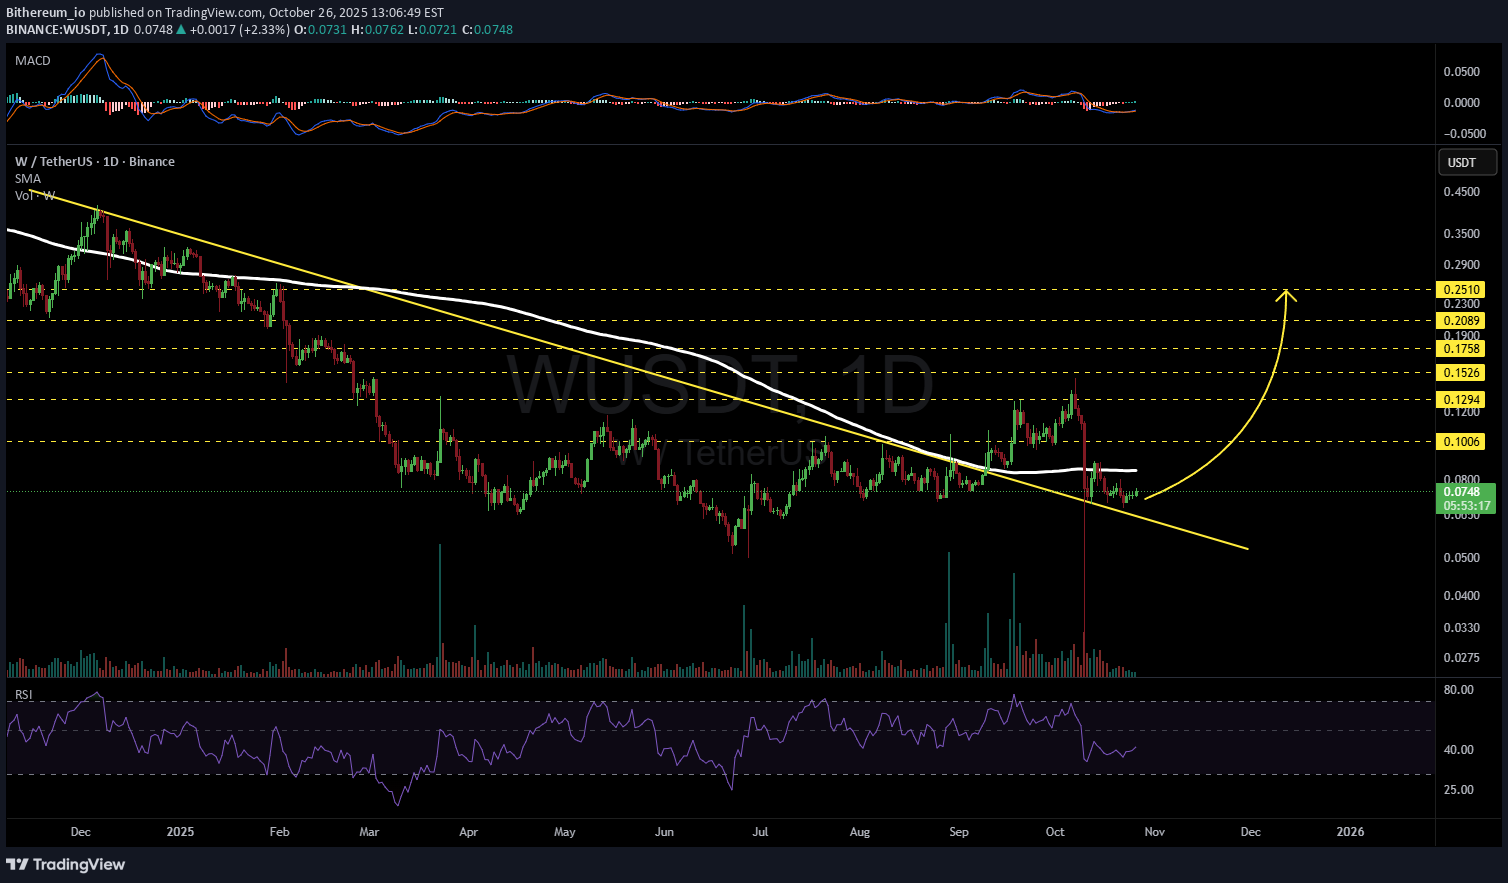
#W günlük grafikte kırılmış azalan direncin üzerinde duruyor ve buradan bir sıçrama bekleniyor. Yükseliş senaryosunun onaylanması için günlük SMA200'ün geri kazanılması gerekiyor. Böyle bir durumda potansiyel hedefler şunlardır: 🎯 0,1006$ 🎯 0,1294$ 🎯 0,1526$ 🎯 0,1758$ 🎯 0,2089$ 🎯 0,2510$ ⚠️ Her zaman sıkı bir zararı durdurma yöntemini kullanmayı ve doğru risk yönetimini sürdürmeyi unutmayın.

احتمال بازگشت بزرگ: قیمت Wormhole تا 2026 چه خواهد شد؟

Ters baklava deseninin ilk yarısının ortaya çıktığını gördük ve daha erken olmasa da 2026'nın ilk 4 ayında bunun ikinci kısmı doldurmaya bakacağız.

صعود انفجاری W/USDT: الگو «سر و شانه معکوس» نویدبخش چه قیمتی است؟

USDT ile güçlü bir tersine çevirme momentumu belirtileri gösteriyor. Net bir ters kafa ve omuz deseni tamamlandı, yaka kırılması potansiyel bir yükseliş eğilimi değişimi olduğunu gösteriyor. Fiyat, şimdi destek olarak hareket eden ve kırılmaya güç katan yaka yakınında birleştiriliyor. Momentum devam ederse, bir sonraki yukarı yönlü hedefler 0,19 $ - 0.29 $ 'a doğru açılır ve uzun vadede 1.85 $' a doğru geniş bir yükseliş potansiyeli ile. Dezavantajı, desteğin ortalama ve uzun vadeli yatırımcılar için riski oldukça çekici tutarak 0,061 $-0.049 $ civarında görülüyor.

W (Warmhole): سیگنال خرید قوی و آماده برای جهش بزرگ!

W (Sıcak deliği) Güzel birikim deseni şekillendirme. Eylül ayı sonundan bu yana fiyat (0.0.09 - 0,12 $) fiyatı sarıyor ve daha yüksek alçak alıcı desteğini gösteriyor. Kurumsal hacim dökülüyor ve bir miting için akıllı para konumlandırılması öneriyor. Orta vadeli kar için satın alabileceğiniz minimum riskli iyi bir kurulum. Satın Al Bölgesi- 0,12 $- 0.10 SL- $ 0.085 TP-1 $ 0.15 TP-2 $ 0.20 TP-3 $ 0.25 TP-4 $ 0.40 Gelecek daha çok kurulum Sık güncellemeler için bir telgraf kanalı başlatıyorum Plz katıl ve paylaşım bu kanal tartışma için olduğu için bilgimi orada paylaşacak t .me/Ticari

Testing new Strategy

1. İnen flama üzerinde kırıldı ve desteği onayladı. 2. Simetrik bir üçgen yarattı. Desteğe girme. 3. Fiyatın simetrik üçgenin üzerinde kırılacağını tahmin edin ve bir sonraki direnç olarak paralel kanal kullanın. Teori: Fiyat eylemi düşüşten nötr, yükselişe gider. Fiyat bunu yaparsa ve paralel kanalın üzerinde kırılırsa, daha da iyi! Aksi takdirde simetrik üçgenin altındaki kaybı durdurun.

#W Bullish Head and Shoulders
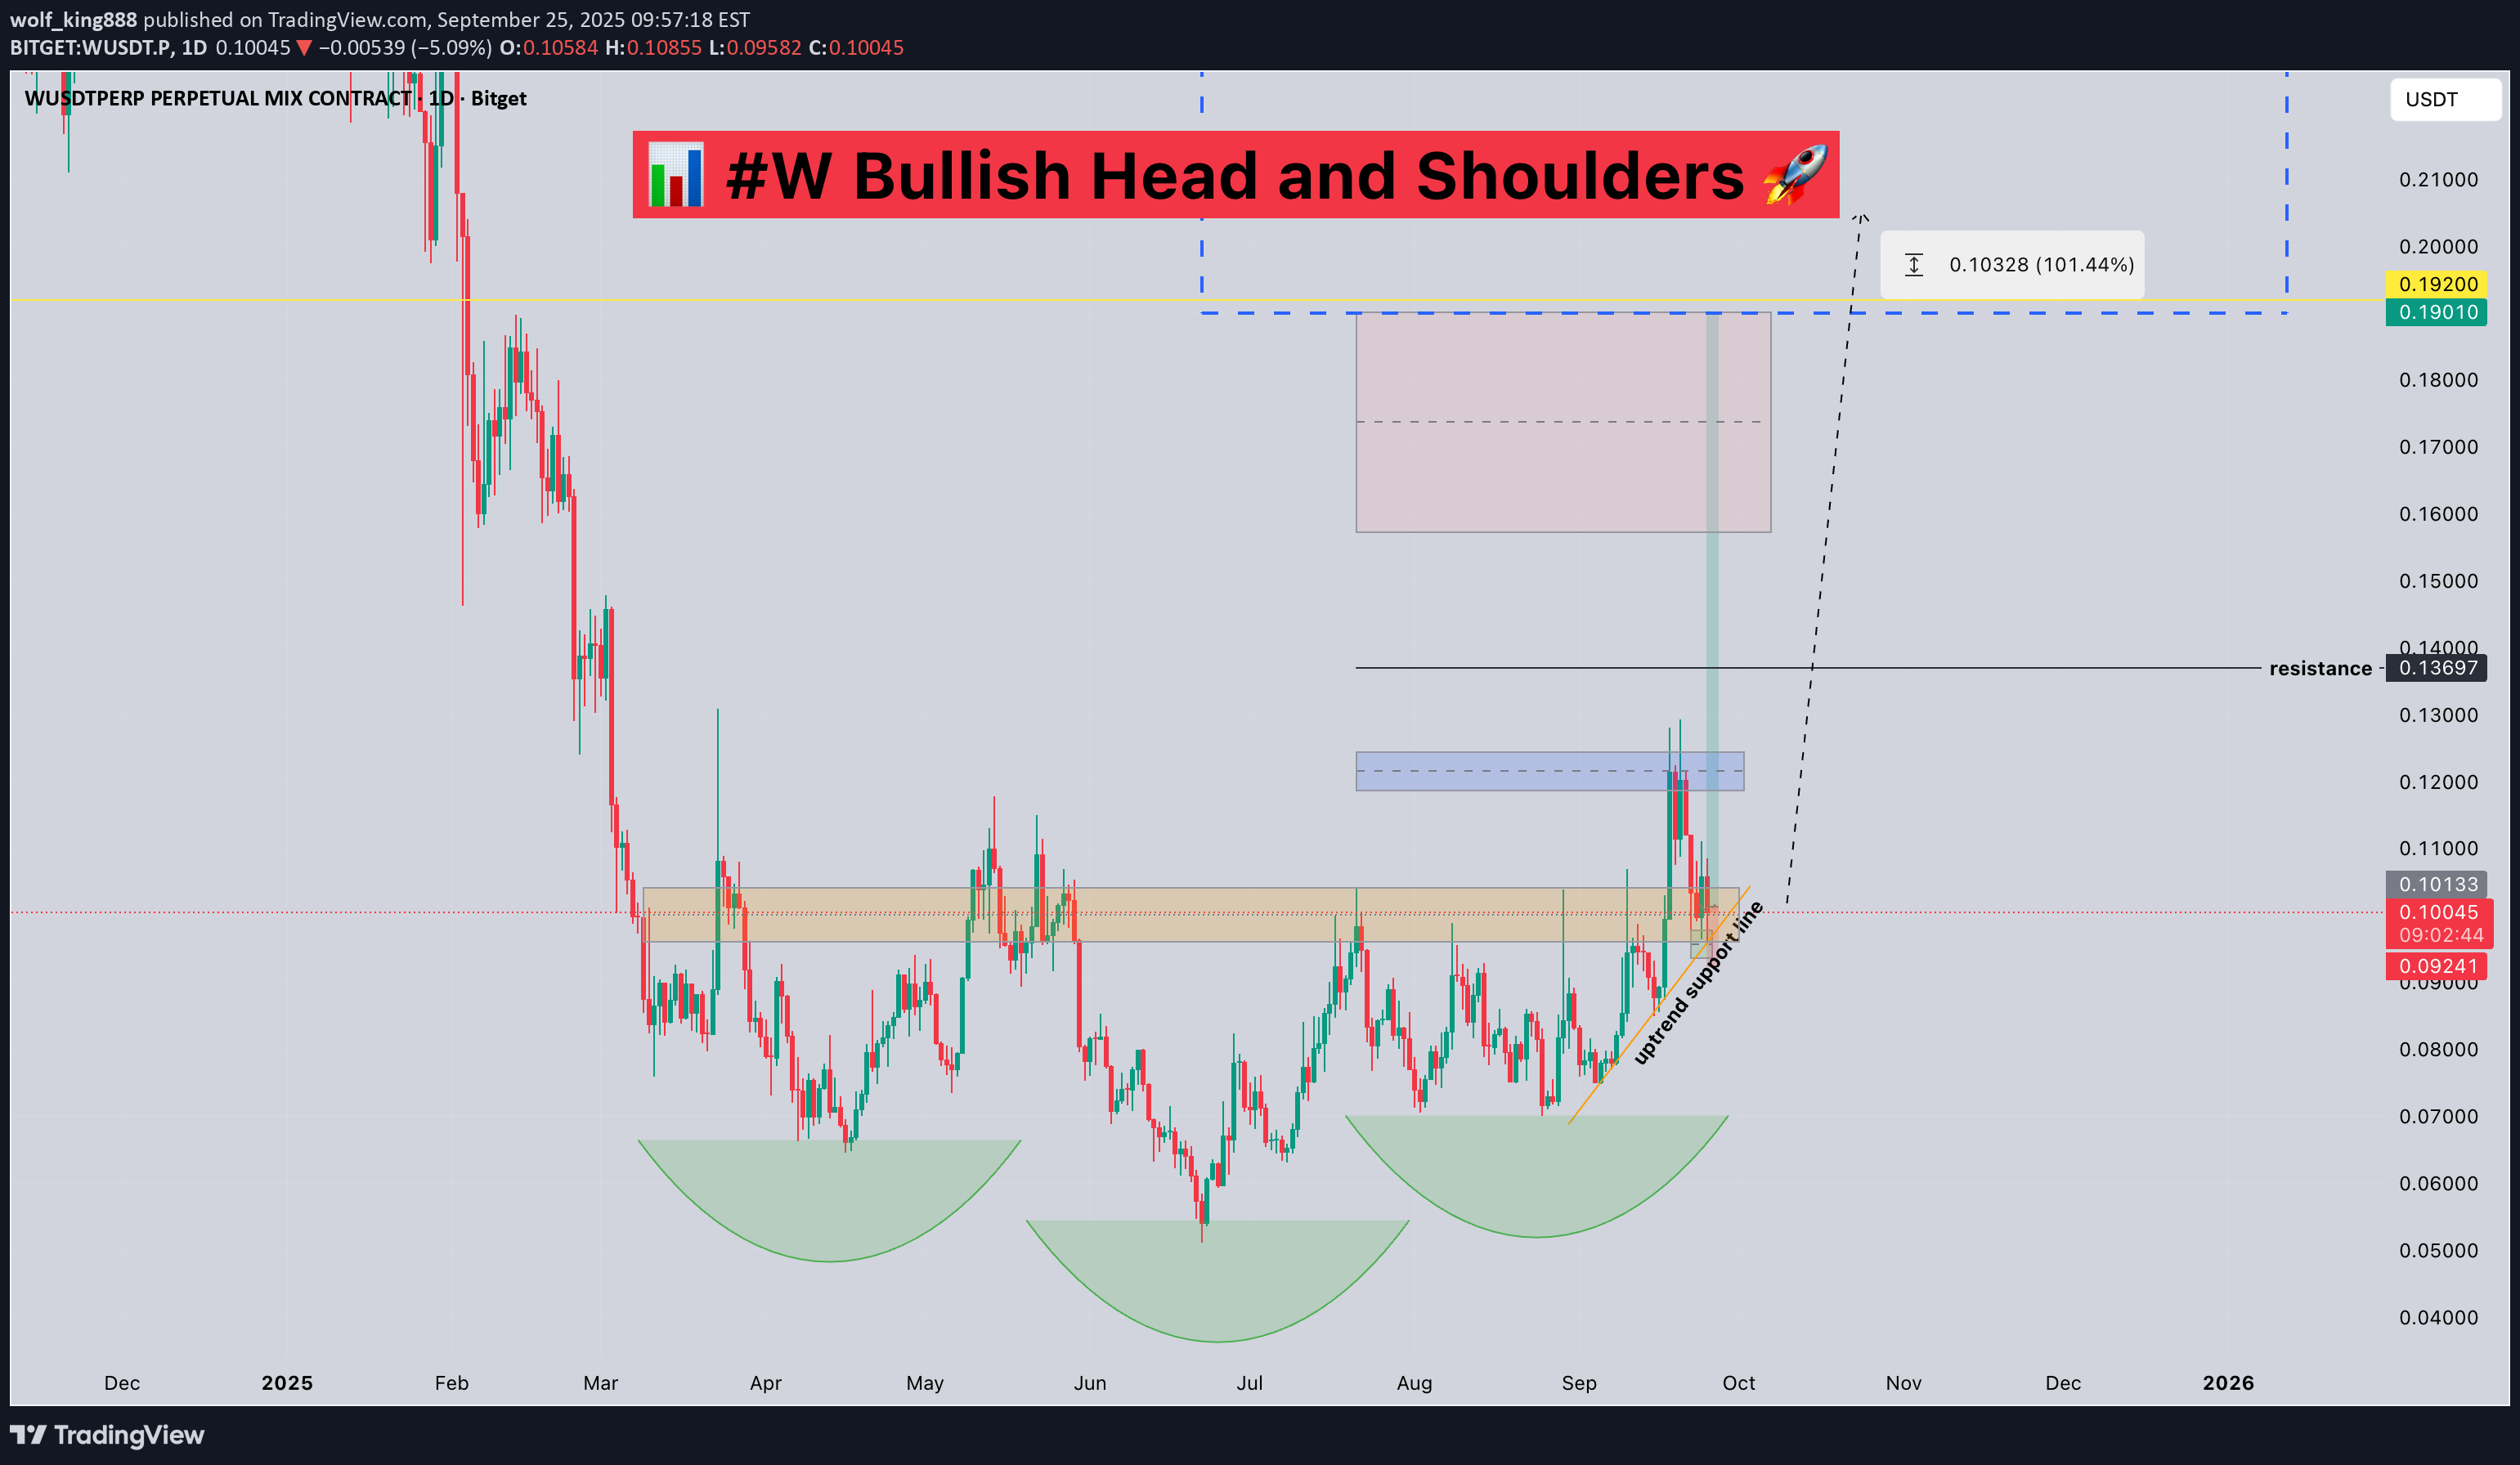
📊 #W Boğa kafası ve omuzlar 🚀 Yapısal bir bakış açısından, altta bir yükseliş başı ve omuz deseni oluşturduk, şu anda boyun çizgisi destek alanını ve yükseliş trendi destek hattını test ediyoruz. Burada tutabilirsek, buradan daha fazla bir kopuş olasılığı yüksektir. Bakalım 👀 🤜 Analizimi beğendiyseniz, lütfen 💖 ve paylaşın 💬 Wusdt.p

W Secondary. Reversed Head and Shoulders Key Area. 18 09 25
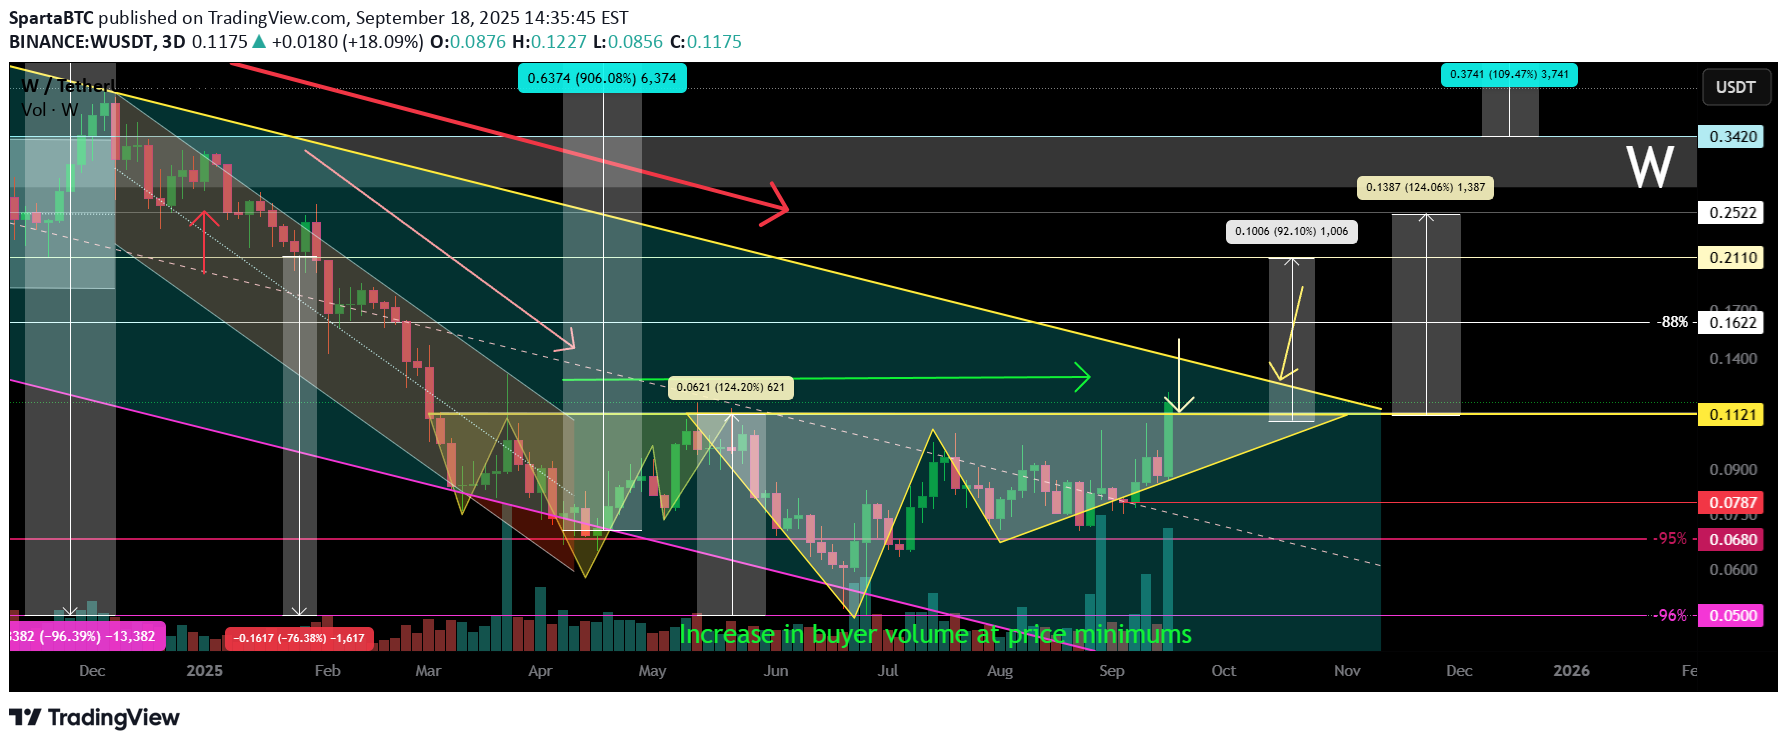
Logaritma. 3 gün. Ana eğilim 23 03 2025 Daha önce bahsedilen anahtar direncin (USD'ye çift) bir kırılması, büyük satın alma hacminde ve yan trendden (ters kafa ve omuzlar) bir çıkışta meydana gelir. Yerel hedefler, ters kafa ve omuz paterni gerçekleşmesi ve bir kase bir sonraki direnç seviyesinde (önceki konsolidasyon) oluşması durumunda.
Sorumluluk Reddi
Sahmeto'nun web sitesinde ve resmi iletişim kanallarında yer alan herhangi bir içerik ve materyal, kişisel görüşlerin ve analizlerin bir derlemesidir ve bağlayıcı değildir. Borsa ve kripto para piyasasına alım, satım, giriş veya çıkış için herhangi bir tavsiye oluşturmazlar. Ayrıca, web sitesinde ve kanallarda yer alan tüm haberler ve analizler, yalnızca resmi ve gayri resmi yerli ve yabancı kaynaklardan yeniden yayınlanan bilgilerdir ve söz konusu içeriğin kullanıcılarının materyallerin orijinalliğini ve doğruluğunu takip etmekten ve sağlamaktan sorumlu olduğu açıktır. Bu nedenle, sorumluluk reddedilirken, sermaye piyasası ve kripto para piyasasındaki herhangi bir karar verme, eylem ve olası kar ve zarar sorumluluğunun yatırımcıya ait olduğu beyan edilir.