
بورس
بورس اوراق بهادار تهران
| تریدر | نوع پیام | حد سود/ضرر | زمان انتشار | مشاهده پیام |
|---|---|---|---|---|
 سیگنال برترRank: 91 | خرید | حد سود: تعیین نشده حد ضرر: تعیین نشده | 10/5/2025 | |
 Market Analyzer (Amir Haghparast)Rank: 780 | خرید | حد سود: تعیین نشده حد ضرر: تعیین نشده | 10/13/2025 | |
 دهکده بورسی | Bours villageRank: 657 | خرید | حد سود: تعیین نشده حد ضرر: تعیین نشده | 10/11/2025 | |
 اسمارت بورسRank: 775 | خرید | حد سود: تعیین نشده حد ضرر: تعیین نشده | 10/5/2025 | |
 نبض بازار بورسRank: 807 | خرید | حد سود: تعیین نشده حد ضرر: تعیین نشده | 10/3/2025 |
Adjusted Price Chart of بورس
سود 3 Months :
پیامهای بورس
Filter
Sort messages by
Trader Type
Time Frame

Ali Moradi | علی مرادی
#Tip #Index_Com out #Stock Exchange On the upcoming trading day, I will cash in on 1 % of the stock; I keep another 1 % with the harm of #Index -General 4.3,3. I keep the liquidity as a fixed income, or add it to lower prices, or if the #index -overall passes through the ceiling and resistance. Unfortunately, I see today's offers in the short term a little #dangerous… Personal opinion is responsible for buying and selling with yourself. #Index -General 2.3,5 units Sincerity

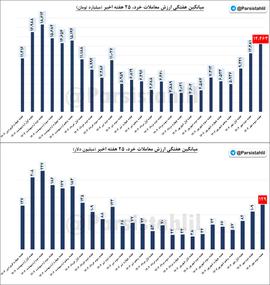
The weekly average of micro -transactions (rials value) of the third week of October 1404 reached 14463 billion tomans. The weekly average of micro -transactions (dollar transactions) of the third week of October 1404 reached $ 129 million. #Stock Exchange #Shares #Parsis Parsis Analytical Channel

🔥 "The refineries were brake, the index of breathing!" 📅 Tuesday, October 23, 2008 The stock market today after the turbulent and ascending days, finally brake a little; It is also the focus of the refineries who illuminated the fire in the heart of the market. While the overall index had recently conquered the summit of $ 5 million, today he retreated a little and went somehow resting. But this retreat should not be confused with falling - that was just a "refreshing breath". The market began today when the public space fluctuated between doubt and hope; On the one hand, on the one hand, the day ago, the energy of the buyers was still alive, and on the other hand, refining reports and gas rate fluctuations were excused for sellers to appear again. However, the important point is that the volume of transactions remained high and there was no sign of capital escape. This means that money is still on the market and the market is not going to withdraw seriously. Technically, the index needed rest after crossing the psychological boundary, and this sales pressure was somewhat natural and even necessary. The market always needs to stand a little after running, breathe fresh and move again. But is this the beginning of reform or just a rest? The answer lies in three key variables: ۱۰ـ The fundamental and coding reports that will be released in the coming days. Political and international developments that can affect the market risk space. Exchange rate fluctuations, which are still the most important motor of cash flow on the stock exchange. It seems that the upward phase of the market has not yet ended. The newcakes are still active, but the path was slower and more cautious than before. To conquer the next peaks, the market needs "big news" - a kind that can inject new excitement into traders; Whether in the field of politics or in codec reports or currency changes. In the meantime, legal behavior is still under the magnifying glass. Many of them have been delayed as ever; When the market was on the floor, the audience remained and now that the market is up, they are just thinking. Experience has proven that the group has often become a market sequence rather than flow. But on the other hand, consolidation and development funds in critical days have once again shown how to calm and profit the market with clever entry into the panels. As Shapur Mohammadi said: "These funds do not benefit from market fluctuations, they benefit from the market unnecessary fears!" Finally, today's market was neither failed nor fear, just standing to make its way more accurately. The liquidity flow is still alive, the value of the shares is in place, and the market moves in the logical circuit. As the old market says: > "The market becomes dangerous when everyone is optimistic; And when everyone is worried, opportunities just start. " Perhaps these few days are the same quiet opportunities before a new wave ... #Investment_Read_Mriver #Exchange #Market -capital Tehran Stock Exchange and Stock Exchange 🆔 @stockholders_tse
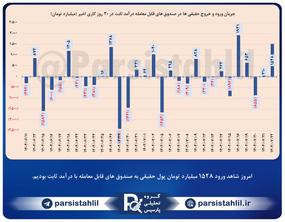
📊 Today we saw the entry of 1528 billion tomans of real money into fixed income funds. #Stock Exchange #Shares #Parsis Parsis Analytical Channel

نواندیشان بورس
#Record of the value of micro -transactions in the last few months in #Stock Exchange The value of transactions 17.7 was recorded.
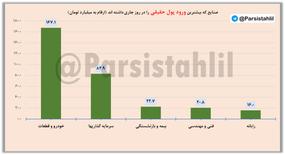
In which #industries was the most real and legal liquidity in today's marketer 1404/07/22? #Stock Exchange #Shares #Parsis Parsis Analytical Channel

ناظر بازار
#Stock Exchange #Jam Pillen #Khagster #Melting ❇️ Notification on the failure to approve part of the trading (stock), (Jam Pillen), (Khogster), (melting) ◼️ Informs part of the trading symbols of Tehran Stock Exchange (Stock Exchange), Jam Pillen Petrochemical Company (Jam Pillen), Iran Khodro Investment Expansion, Isfahan Steel (Melt) on this day in accordance with Article 112 of the Tehran Stock Exchange. Tehran Stock Exchange Stock Exchange Operations Management 1404-07-22 16:15 ایرین ایرین 📊 Market supervisor channel 🔗 @nazerbazar_ir
#Per capita_ buy Today, the market today was 22 October 1404 per capita of each symbol in the market, about 45.4 million tomans and the per capita sales was about 44.9 million tomans. Also, in today's market, for every code (average symbols), the per capita purchase was about 72.6 million tomans and the per capita sales was about 79.8 million tomans. #Stock Exchange #Shares #Parsis Parsis Analytical Channel
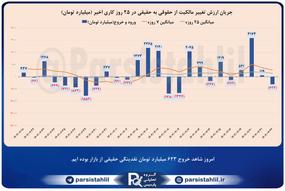
#Real #Legal In today's market, we have had a total of 623 billion tomans of real exit from the market. (Stocks + Priority Copper + Stuality Funds) It is necessary to explain that so far in the purchase sector, 74 % of purchases have been made by real and 26 % by law. Also in the sales sector 78 % of sales were made by real and 22 % by law. Important: In today's market, we have seen the entry of 102 billion tomans of real liquidity into market value symbols of less than 40,000 billion tomans and the withdrawal of 725 billion tomans from market value symbols of more than 40 billion tomans. #Stock Exchange #Shares #Parsis Parsis Analytical Channel

حامی بورس
📊 Market Day Report 📉 🔹 Stock and Priority: Trading value: 9.15 Hemmat Money Exit: 488 billion USD 🔹 Joint Stock Funds: Trading value: 2.24 Money Exit: 225 billion USD 🔹 Leverage: Trading value: 3.94 Money Log: 112 billion USD 🔹 Trading Opinion: Trading value: 975 billion USD #Market_Sam #Stock Exchange #Value_Claims #Exit_Pow #Login #Analysis_Bazar #Shares #Division_Phartments @hamibourse_ir
Disclaimer
Any content and materials included in Sahmeto's website and official communication channels are a compilation of personal opinions and analyses and are not binding. They do not constitute any recommendation for buying, selling, entering or exiting the stock market and cryptocurrency market. Also, all news and analyses included in the website and channels are merely republished information from official and unofficial domestic and foreign sources, and it is obvious that users of the said content are responsible for following up and ensuring the authenticity and accuracy of the materials. Therefore, while disclaiming responsibility, it is declared that the responsibility for any decision-making, action, and potential profit and loss in the capital market and cryptocurrency market lies with the trader.