
Trade Nation
@t_Trade Nation

What symbols does the trader recommend buying?
Purchase History
پیام های تریدر
Filter
Trade Nation
Gold uptrend consolidation supported at 4254
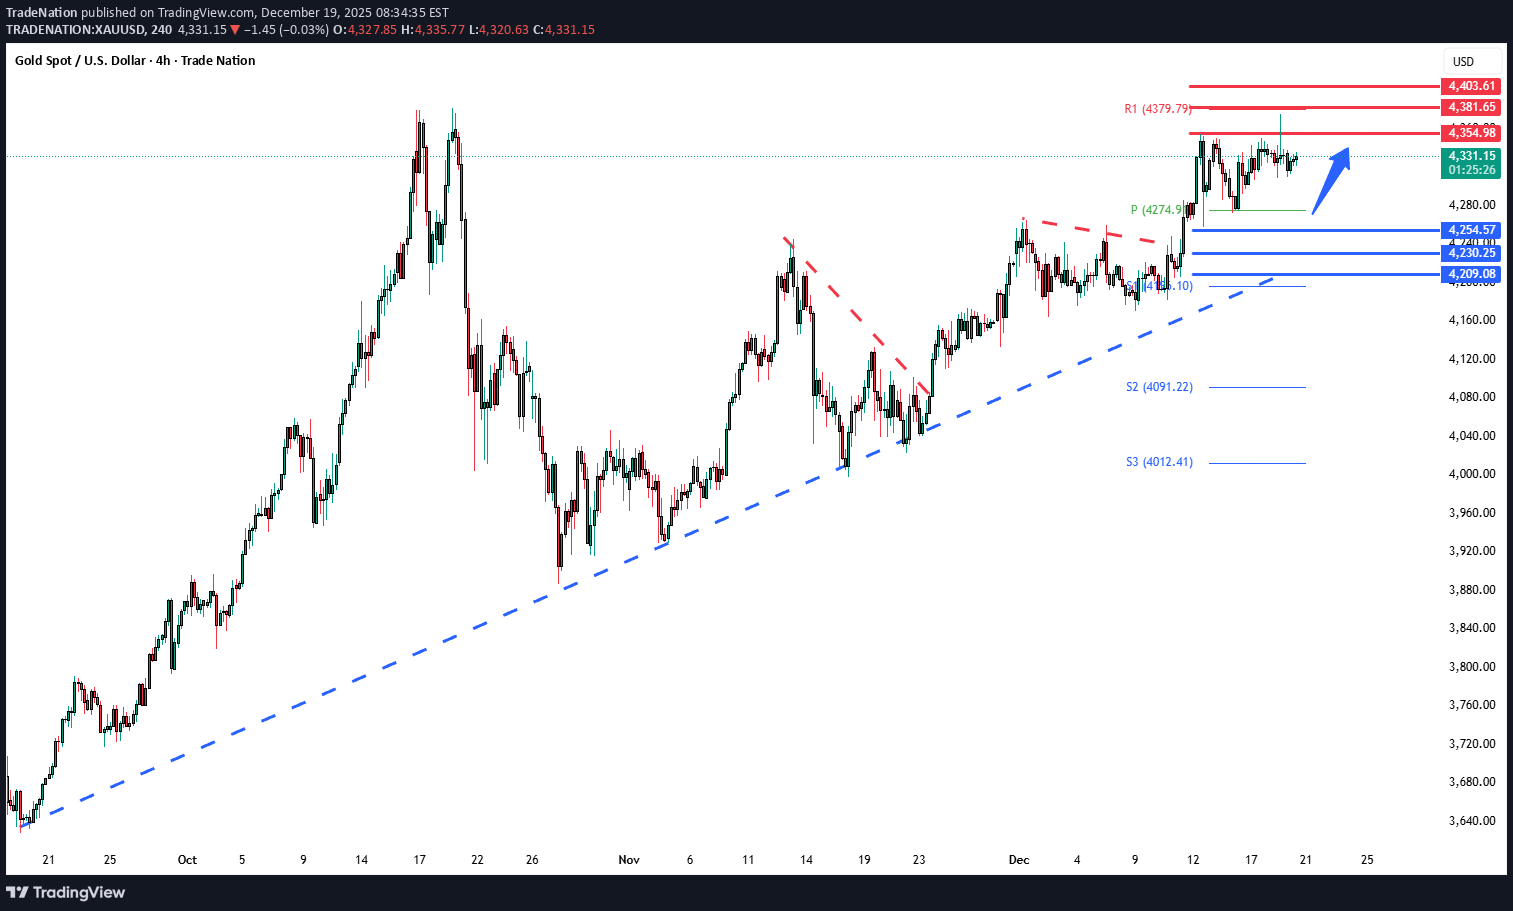
The Gold remains in a bullish trend, with recent price action showing signs of a breakout within the broader uptrend. Support Zone: 4254 – a key level from previous consolidation. Price is currently testing or approaching this level. A bullish rebound from 4254 would confirm ongoing upside momentum, with potential targets at: 4354 – initial resistance 4380 – psychological and structural level 4403 – extended resistance on the longer-term chart Bearish Scenario: A confirmed break and daily close below 4254 would weaken the bullish outlook and suggest deeper downside risk toward: 4230 – minor support 4209 – stronger support and potential demand zone Outlook: Bullish bias remains intact while the Gold holds above 4254. A sustained break below this level could shift momentum to the downside in the short term. This communication is for informational purposes only and should not be viewed as any form of recommendation as to a particular course of action or as investment advice. It is not intended as an offer or solicitation for the purchase or sale of any financial instrument or as an official confirmation of any transaction. Opinions, estimates and assumptions expressed herein are made as of the date of this communication and are subject to change without notice. This communication has been prepared based upon information, including market prices, data and other information, believed to be reliable; however, Trade Nation does not warrant its completeness or accuracy. All market prices and market data contained in or attached to this communication are indicative and subject to change without notice.
Trade Nation
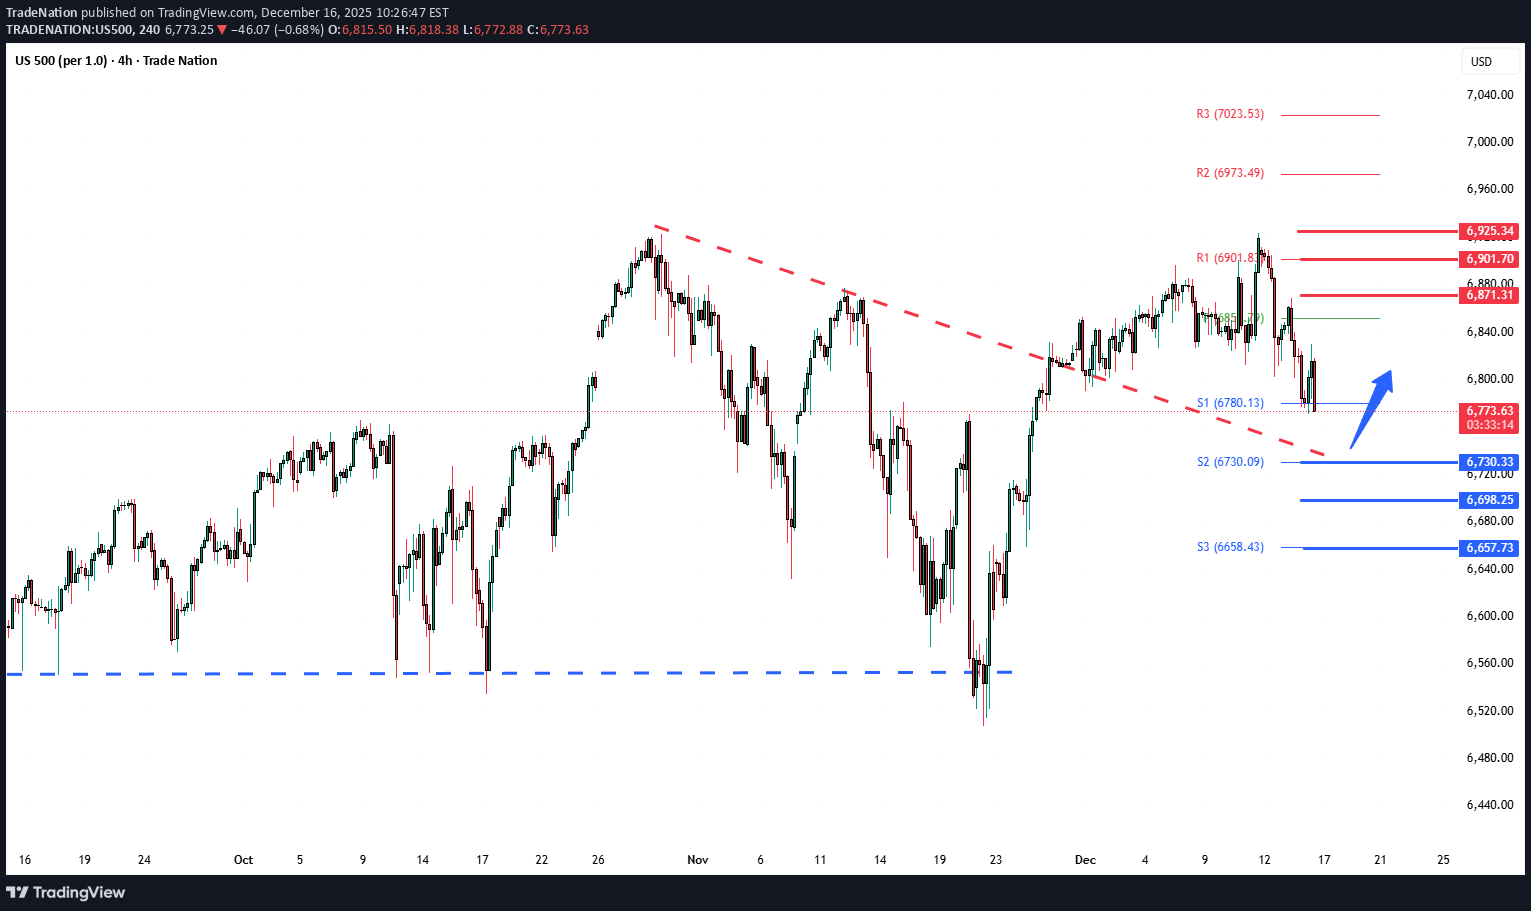
S&P500 oversold bounce supported at 6730
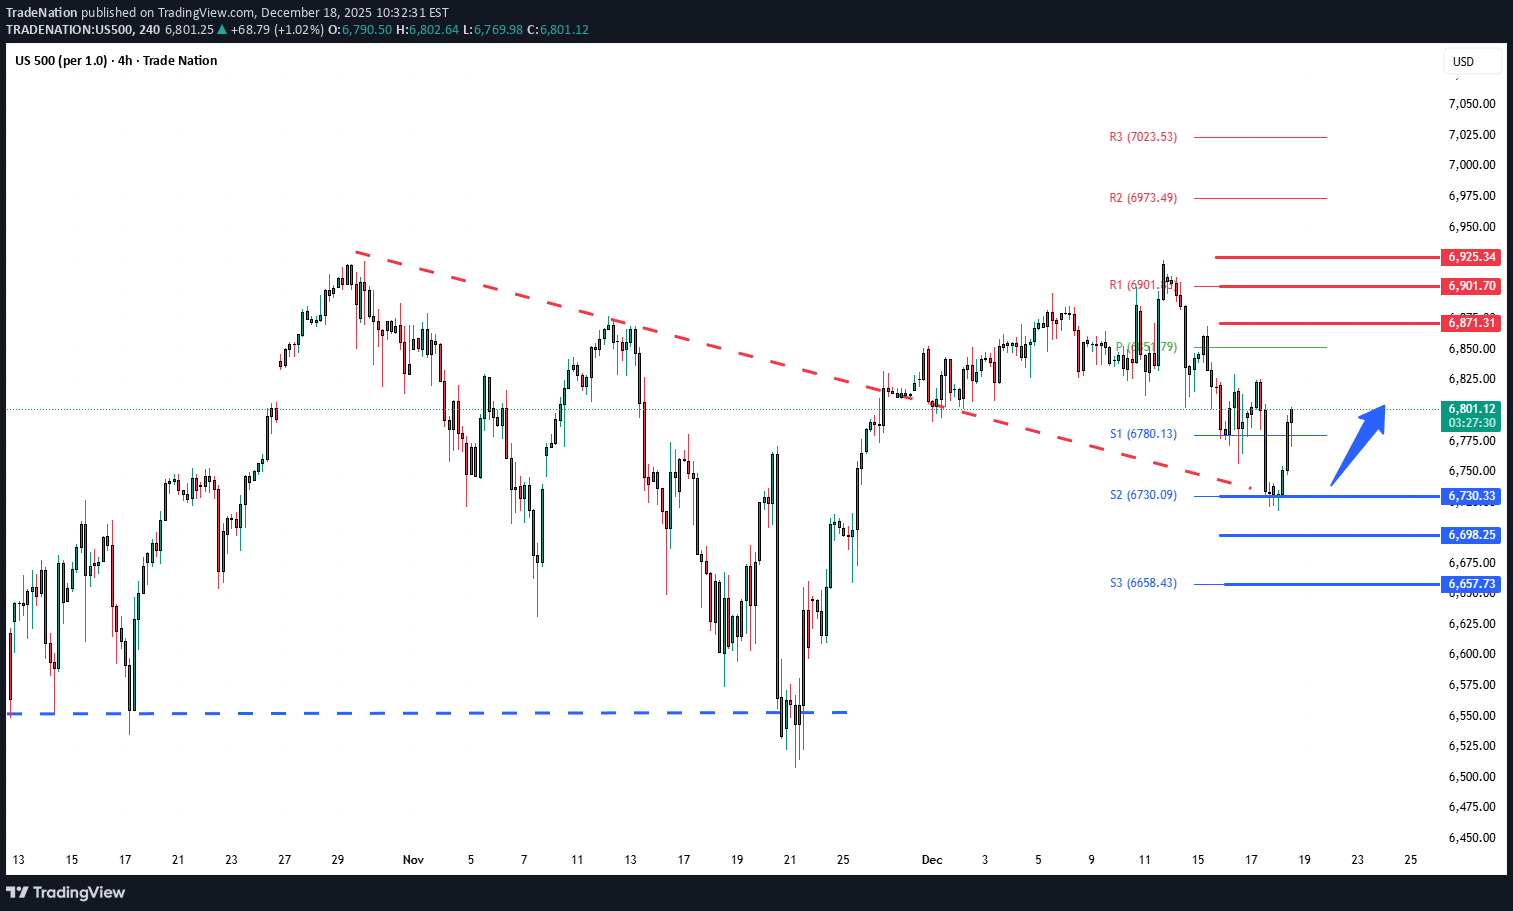
Key Support and Resistance Levels Resistance Level 1: 6871 Resistance Level 2: 6900 Resistance Level 3: 6925 Support Level 1: 6730 Support Level 2: 6700 Support Level 3: 6657 This communication is for informational purposes only and should not be viewed as any form of recommendation as to a particular course of action or as investment advice. It is not intended as an offer or solicitation for the purchase or sale of any financial instrument or as an official confirmation of any transaction. Opinions, estimates and assumptions expressed herein are made as of the date of this communication and are subject to change without notice. This communication has been prepared based upon information, including market prices, data and other information, believed to be reliable; however, Trade Nation does not warrant its completeness or accuracy. All market prices and market data contained in or attached to this communication are indicative and subject to change without notice.
Trade Nation
آدا (ADAUSD) در آستانه سقوط: کلید سرنوشت در سطح ۴,۵۹۰!
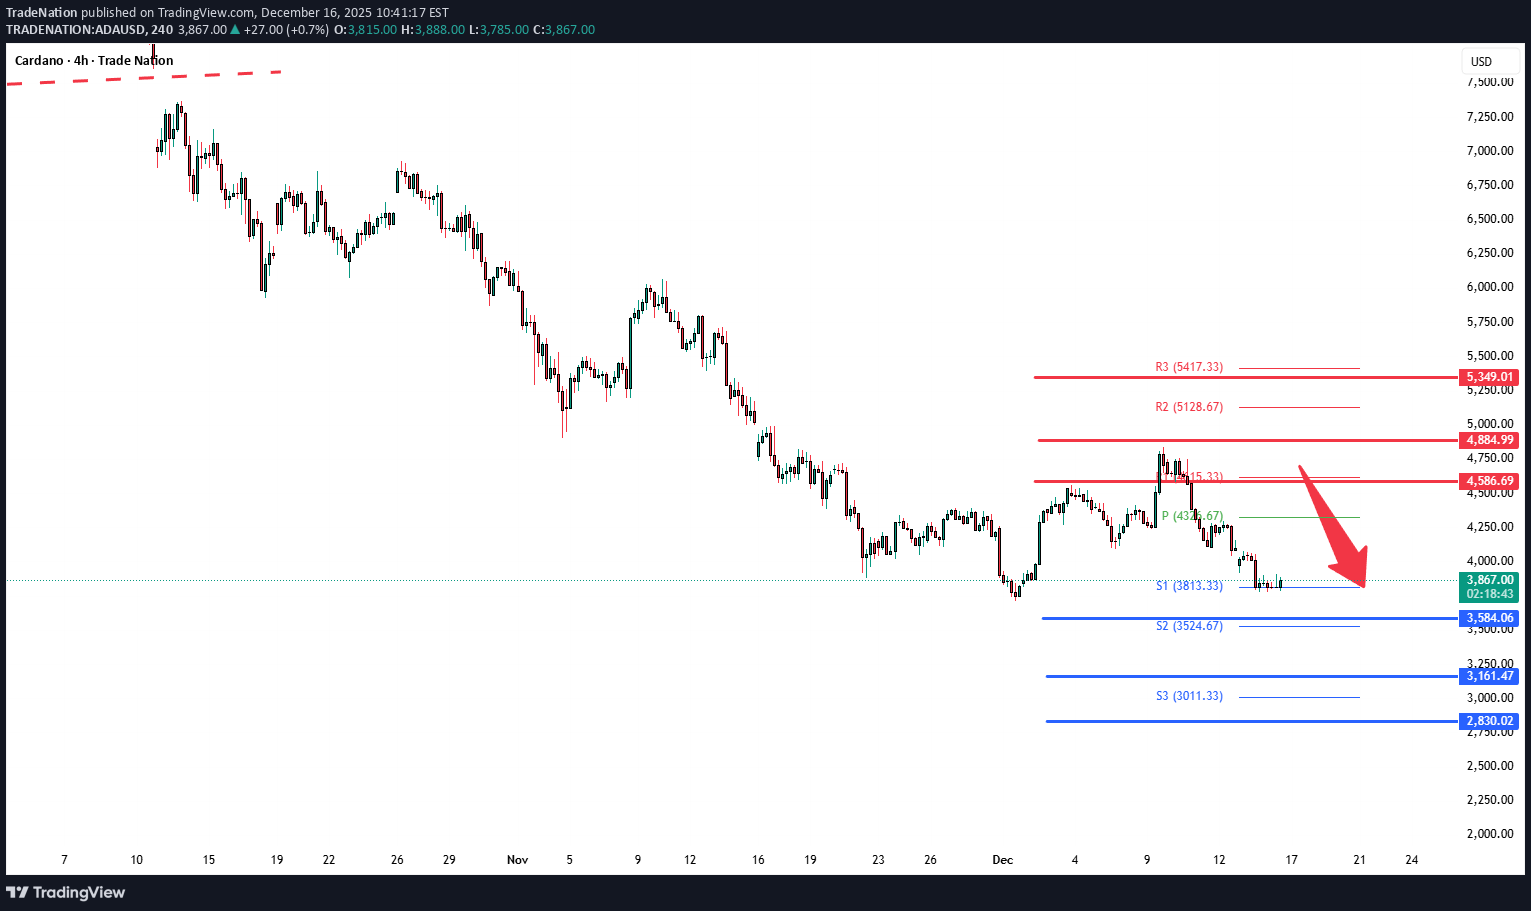
The ADAUSD pair continues to display a bearish outlook, in line with the prevailing downward trend. Recent price action suggests a corrective pullback, potentially setting up for another move lower if resistance holds. Key Level: 4,590 This zone, previously a consolidation area, now acts as a significant resistance level. A failed test and rejection at 4,590 would likely resume the bearish momentum. Downside targets include: 3,580 – Initial support 3,160 – Intermediate support 2,830 – Longer-term support level Bullish Scenario (breakout above 4,590): A confirmed breakout and daily close above 4,590 would invalidate the bearish setup. In that case, potential upside resistance levels are: 4,880 – First resistance 5,350 – Further upside target Conclusion ADAUSD remains under bearish pressure, with the 4,590 level acting as a key inflection point. As long as price remains below this level, the bias favours further downside. Traders should watch for price confirmation around that level to assess the next move. This communication is for informational purposes only and should not be viewed as any form of recommendation as to a particular course of action or as investment advice. It is not intended as an offer or solicitation for the purchase or sale of any financial instrument or as an official confirmation of any transaction. Opinions, estimates and assumptions expressed herein are made as of the date of this communication and are subject to change without notice. This communication has been prepared based upon information, including market prices, data and other information, believed to be reliable; however, Trade Nation does not warrant its completeness or accuracy. All market prices and market data contained in or attached to this communication are indicative and subject to change without notice.
Trade Nation
سقف ۳۲۵۰ دلار؛ آیا سقوط اتریوم ادامه مییابد؟
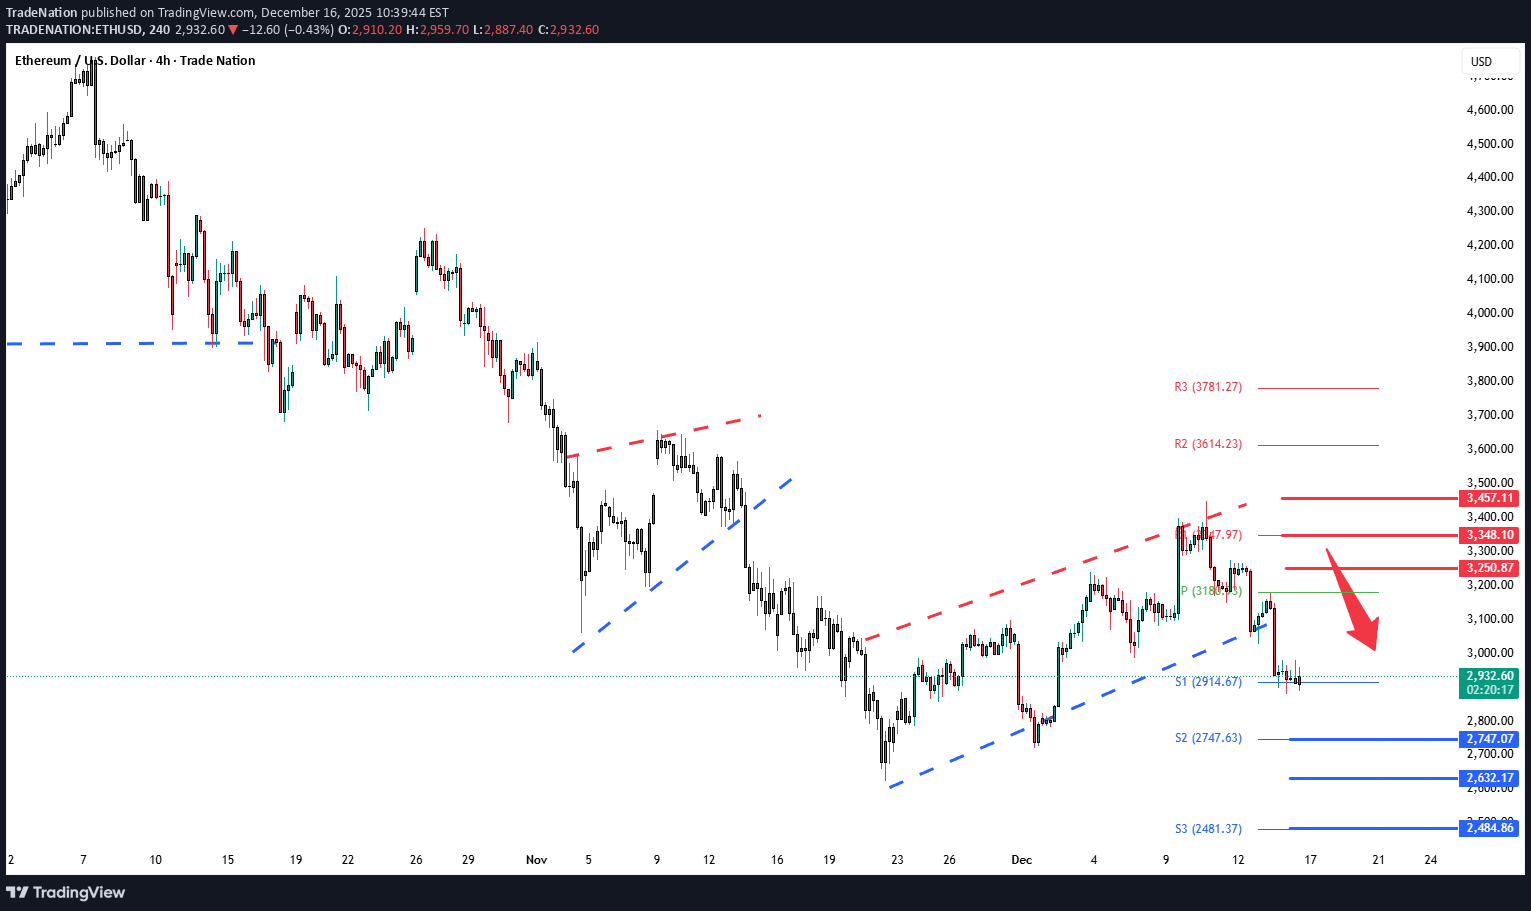
The ETHUSD pair continues to display a bearish outlook, in line with the prevailing downward trend. Recent price action suggests a corrective pullback, potentially setting up for another move lower if resistance holds. Key Level: 3,250 This zone, previously a consolidation area, now acts as a significant resistance level. A failed test and rejection at 3,250 would likely resume the bearish momentum. Downside targets include: 2,750 – Initial support 2,630 – Intermediate support 2,484 – Longer-term support level Bullish Scenario (breakout above 3,250): A confirmed breakout and daily close above 3,250 would invalidate the bearish setup. In that case, potential upside resistance levels are: 3,350 – First resistance 3,460 – Further upside target Conclusion ETHUSD remains under bearish pressure, with the 3,250 level acting as a key inflection point. As long as price remains below this level, the bias favours further downside. Traders should watch for price confirmation around that level to assess the next move. This communication is for informational purposes only and should not be viewed as any form of recommendation as to a particular course of action or as investment advice. It is not intended as an offer or solicitation for the purchase or sale of any financial instrument or as an official confirmation of any transaction. Opinions, estimates and assumptions expressed herein are made as of the date of this communication and are subject to change without notice. This communication has been prepared based upon information, including market prices, data and other information, believed to be reliable; however, Trade Nation does not warrant its completeness or accuracy. All market prices and market data contained in or attached to this communication are indicative and subject to change without notice.
Trade Nation
BTCUSD downtrend continuation below 93,700 resisance
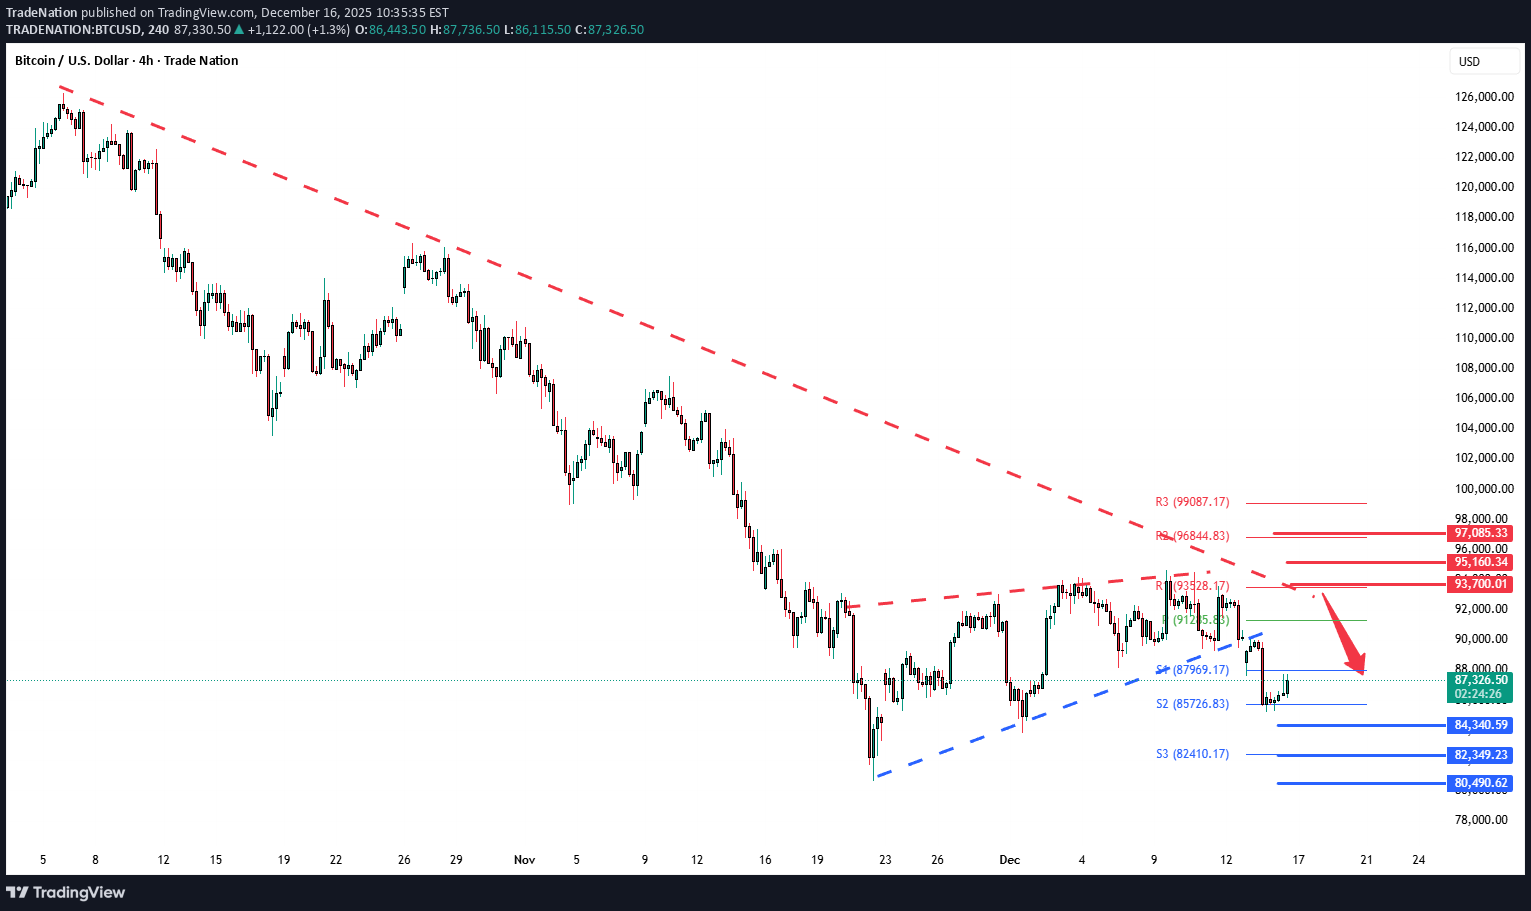
The BTCUSD currency pair continues to display a bearish outlook, in line with the prevailing downward trend. Recent price action suggests a corrective pullback, potentially setting up for another move lower if resistance holds. Key Level: 93,700 This zone, previously a consolidation area, now acts as a significant resistance level. Bearish Scenario (rejection at 93,700): A failed test and rejection at 93,700 would likely resume the bearish momentum. Downside targets include: 84,340 – Initial support 82,350 – Intermediate support 80,490 – Longer-term support level Bullish Scenario (breakout above 93,700): A confirmed breakout and daily close above 93,700 would invalidate the bearish setup. In that case, potential upside resistance levels are: 95,160 – First resistance 97,085 – Further upside target Conclusion BTCUSD remains under bearish pressure, with the 98,240 level acting as a key inflection point. As long as price remains below this level, the bias favours further downside. Traders should watch for price confirmation around that level to assess the next move. This communication is for informational purposes only and should not be viewed as any form of recommendation as to a particular course of action or as investment advice. It is not intended as an offer or solicitation for the purchase or sale of any financial instrument or as an official confirmation of any transaction. Opinions, estimates and assumptions expressed herein are made as of the date of this communication and are subject to change without notice. This communication has been prepared based upon information, including market prices, data and other information, believed to be reliable; however, Trade Nation does not warrant its completeness or accuracy. All market prices and market data contained in or attached to this communication are indicative and subject to change without notice.
Trade Nation
سطوح حیاتی حمایت و مقاومت S&P 500: نقاط کلیدی برای ترید امروز!
Key Support and Resistance Levels Resistance Level 1: 6871 Resistance Level 2: 6900 Resistance Level 3: 6925 Support Level 1: 6730 Support Level 2: 6700 Support Level 3: 6657 This communication is for informational purposes only and should not be viewed as any form of recommendation as to a particular course of action or as investment advice. It is not intended as an offer or solicitation for the purchase or sale of any financial instrument or as an official confirmation of any transaction. Opinions, estimates and assumptions expressed herein are made as of the date of this communication and are subject to change without notice. This communication has been prepared based upon information, including market prices, data and other information, believed to be reliable; however, Trade Nation does not warrant its completeness or accuracy. All market prices and market data contained in or attached to this communication are indicative and subject to change without notice.
Trade Nation
Gold resistance retest, uptrend support at 4254
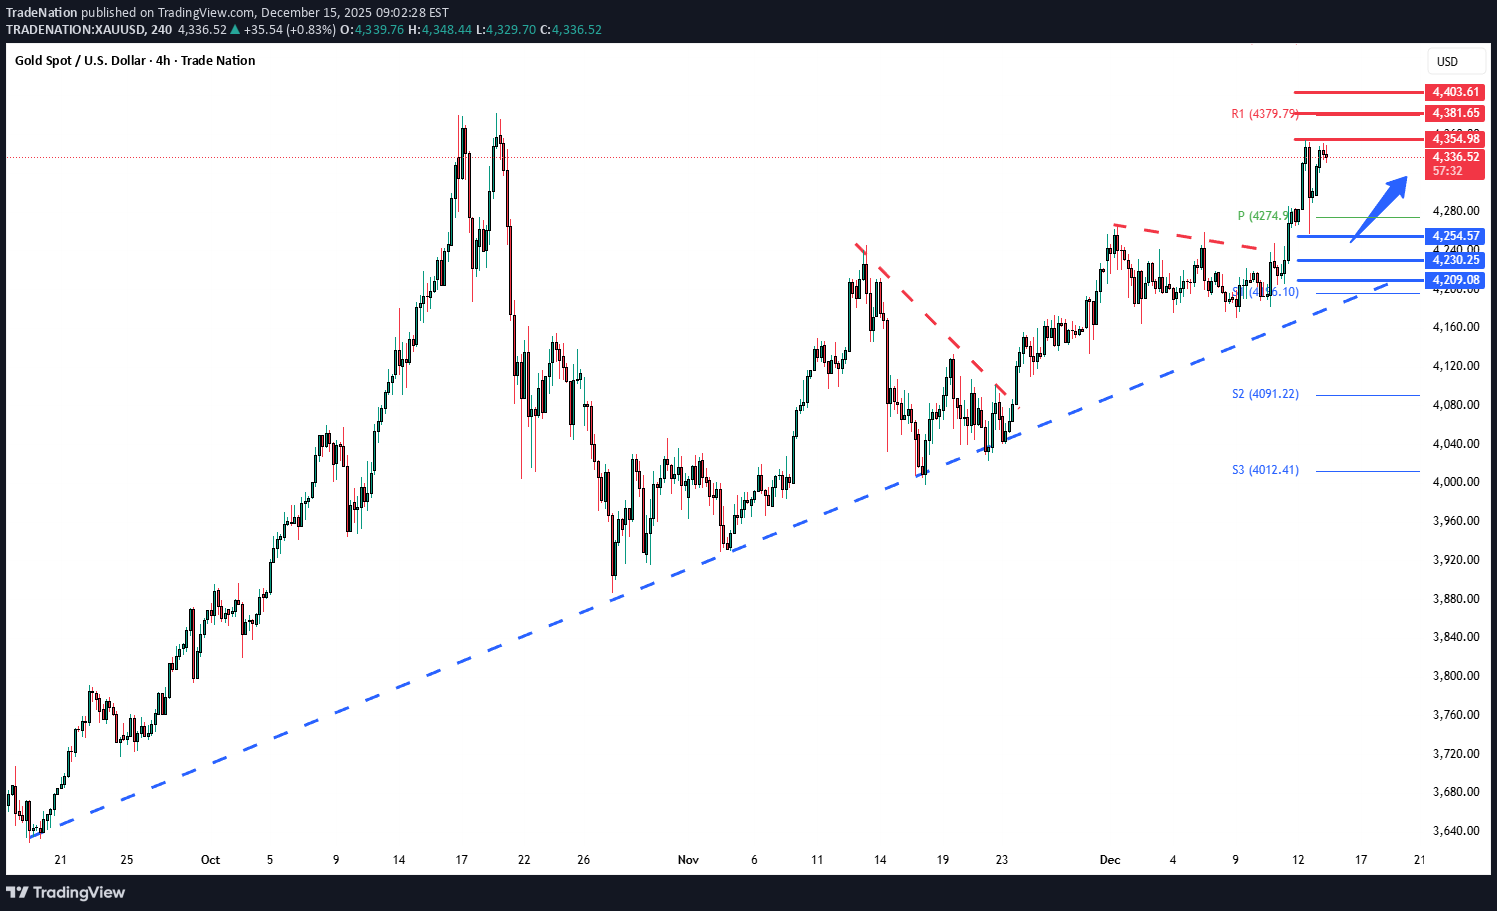
The Gold remains in a bullish trend, with recent price action showing signs of a breakout within the broader uptrend. Support Zone: 4254 – a key level from previous consolidation. Price is currently testing or approaching this level. A bullish rebound from 4254 would confirm ongoing upside momentum, with potential targets at: 4354 – initial resistance 4380 – psychological and structural level 4403 – extended resistance on the longer-term chart Bearish Scenario: A confirmed break and daily close below 4254 would weaken the bullish outlook and suggest deeper downside risk toward: 4230 – minor support 4209 – stronger support and potential demand zone Outlook: Bullish bias remains intact while the Gold holds above 4254. A sustained break below this level could shift momentum to the downside in the short term. This communication is for informational purposes only and should not be viewed as any form of recommendation as to a particular course of action or as investment advice. It is not intended as an offer or solicitation for the purchase or sale of any financial instrument or as an official confirmation of any transaction. Opinions, estimates and assumptions expressed herein are made as of the date of this communication and are subject to change without notice. This communication has been prepared based upon information, including market prices, data and other information, believed to be reliable; however, Trade Nation does not warrant its completeness or accuracy. All market prices and market data contained in or attached to this communication are indicative and subject to change without notice.
Trade Nation
ADAUSD Bearish sideways consolidation capped at 4,590
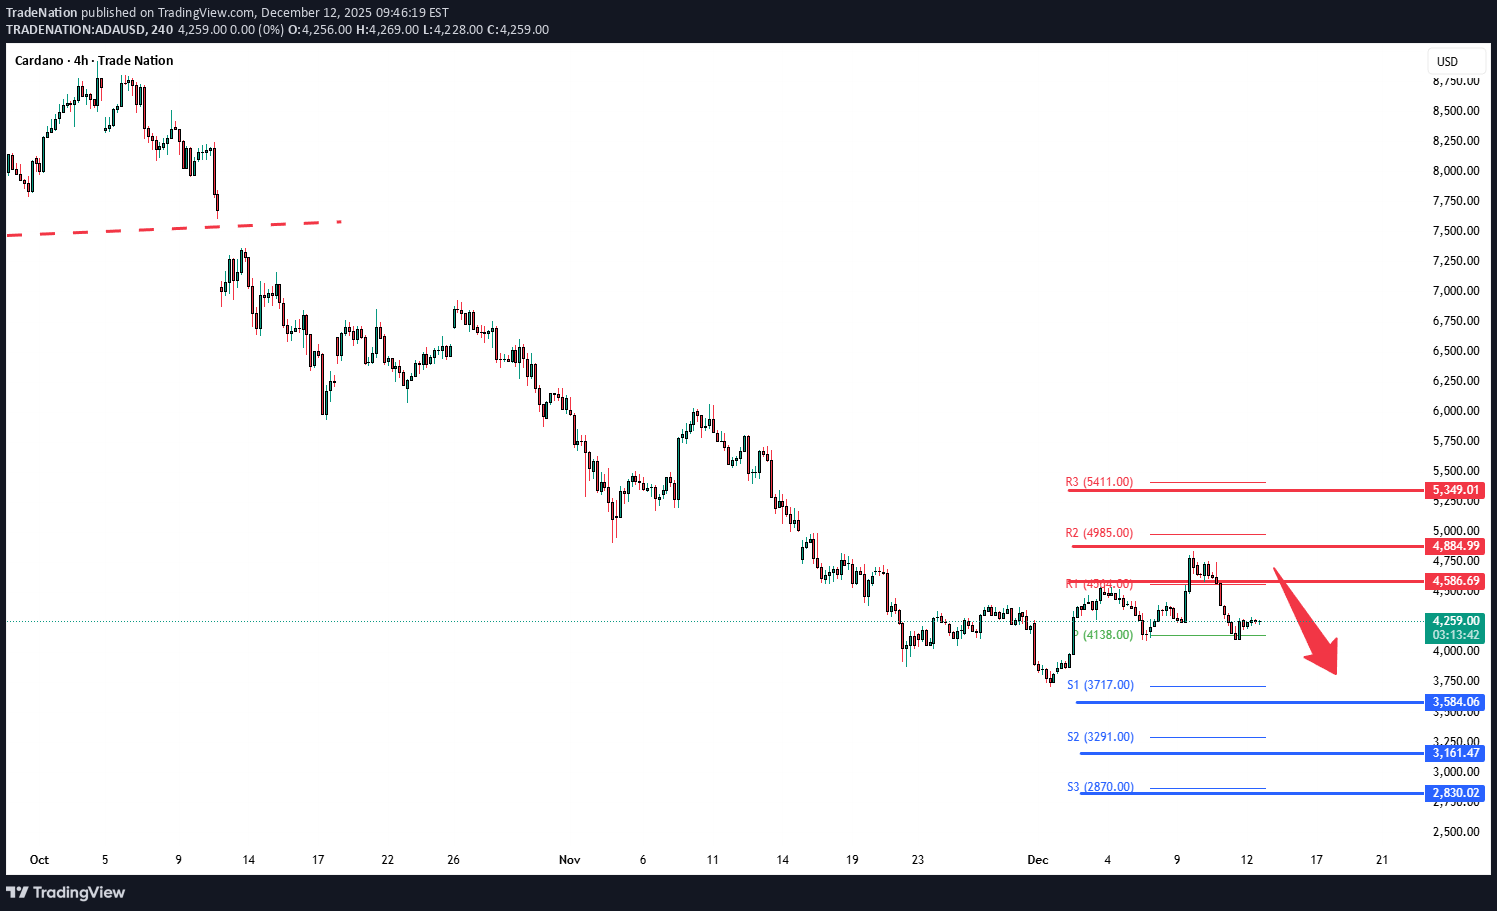
The ADAUSD pair continues to display a bearish outlook, in line with the prevailing downward trend. Recent price action suggests a corrective pullback, potentially setting up for another move lower if resistance holds. Key Level: 4,590 This zone, previously a consolidation area, now acts as a significant resistance level. A failed test and rejection at 4,590 would likely resume the bearish momentum. Downside targets include: 3,580 – Initial support 3,160 – Intermediate support 2,830 – Longer-term support level Bullish Scenario (breakout above 4,590): A confirmed breakout and daily close above 4,590 would invalidate the bearish setup. In that case, potential upside resistance levels are: 4,880 – First resistance 5,350 – Further upside target Conclusion ADAUSD remains under bearish pressure, with the 4,590 level acting as a key inflection point. As long as price remains below this level, the bias favours further downside. Traders should watch for price confirmation around that level to assess the next move. This communication is for informational purposes only and should not be viewed as any form of recommendation as to a particular course of action or as investment advice. It is not intended as an offer or solicitation for the purchase or sale of any financial instrument or as an official confirmation of any transaction. Opinions, estimates and assumptions expressed herein are made as of the date of this communication and are subject to change without notice. This communication has been prepared based upon information, including market prices, data and other information, believed to be reliable; however, Trade Nation does not warrant its completeness or accuracy. All market prices and market data contained in or attached to this communication are indicative and subject to change without notice.
Trade Nation
ETHUSD Bearish continuation below 3,409 resistance
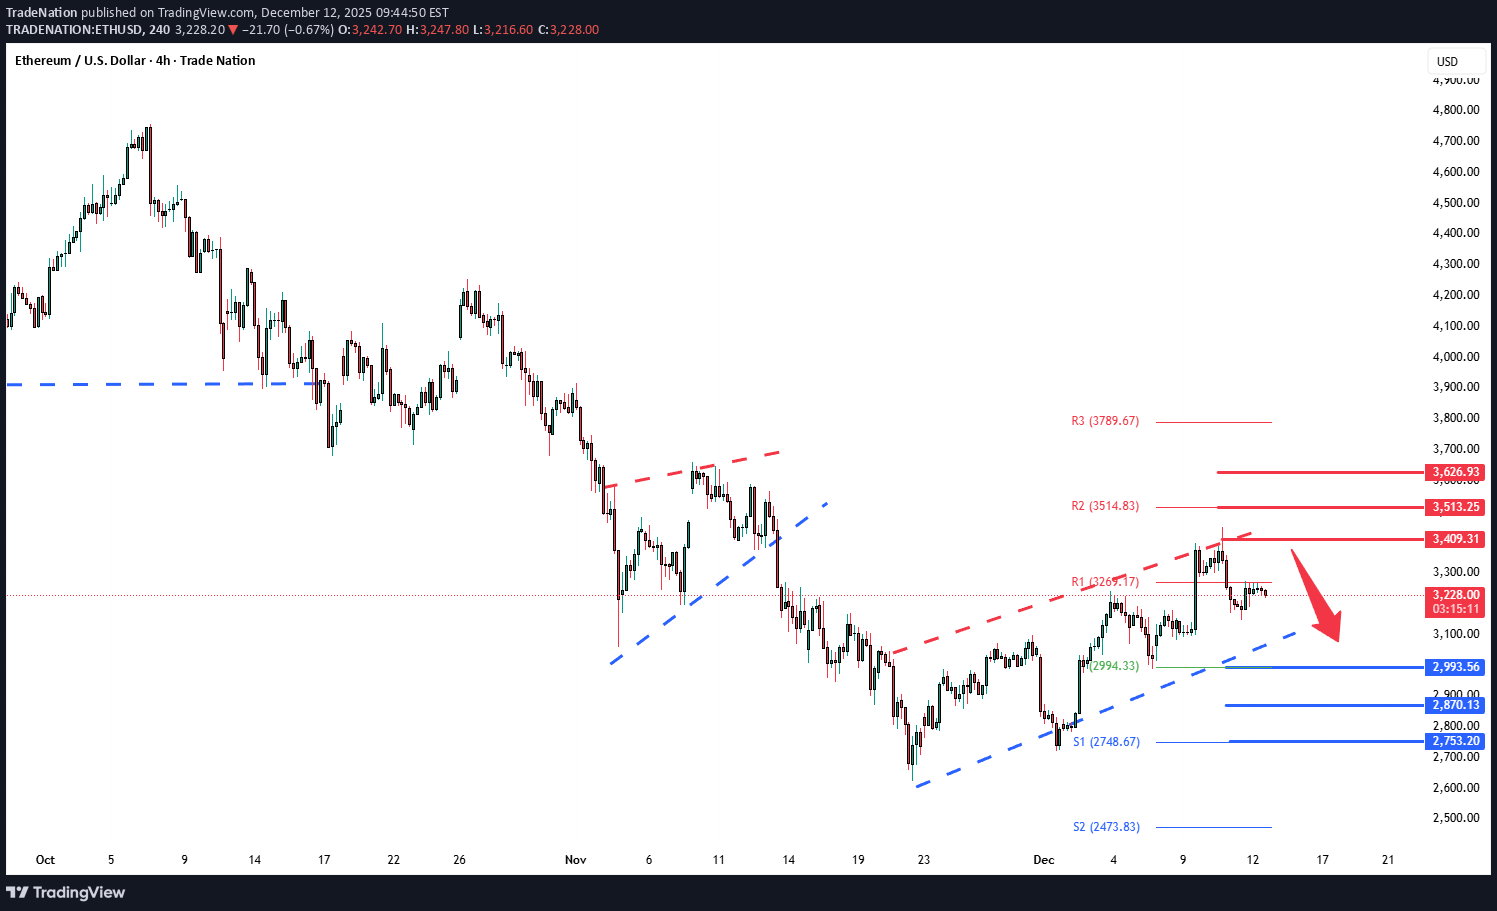
The ETHUSD pair continues to display a bearish outlook, in line with the prevailing downward trend. Recent price action suggests a corrective pullback, potentially setting up for another move lower if resistance holds. Key Level: 3,409 This zone, previously a consolidation area, now acts as a significant resistance level. A failed test and rejection at 3,409 would likely resume the bearish momentum. Downside targets include: 2,994 – Initial support 2,879 – Intermediate support 2,753 – Longer-term support level Bullish Scenario (breakout above 3,409): A confirmed breakout and daily close above 3,409 would invalidate the bearish setup. In that case, potential upside resistance levels are: 3,513 – First resistance 3,626 – Further upside target Conclusion ETHUSD remains under bearish pressure, with the 3,409 level acting as a key inflection point. As long as price remains below this level, the bias favours further downside. Traders should watch for price confirmation around that level to assess the next move. This communication is for informational purposes only and should not be viewed as any form of recommendation as to a particular course of action or as investment advice. It is not intended as an offer or solicitation for the purchase or sale of any financial instrument or as an official confirmation of any transaction. Opinions, estimates and assumptions expressed herein are made as of the date of this communication and are subject to change without notice. This communication has been prepared based upon information, including market prices, data and other information, believed to be reliable; however, Trade Nation does not warrant its completeness or accuracy. All market prices and market data contained in or attached to this communication are indicative and subject to change without notice.
Trade Nation
BTCUSD Bearish "Rising Wedge" capped at 94,900
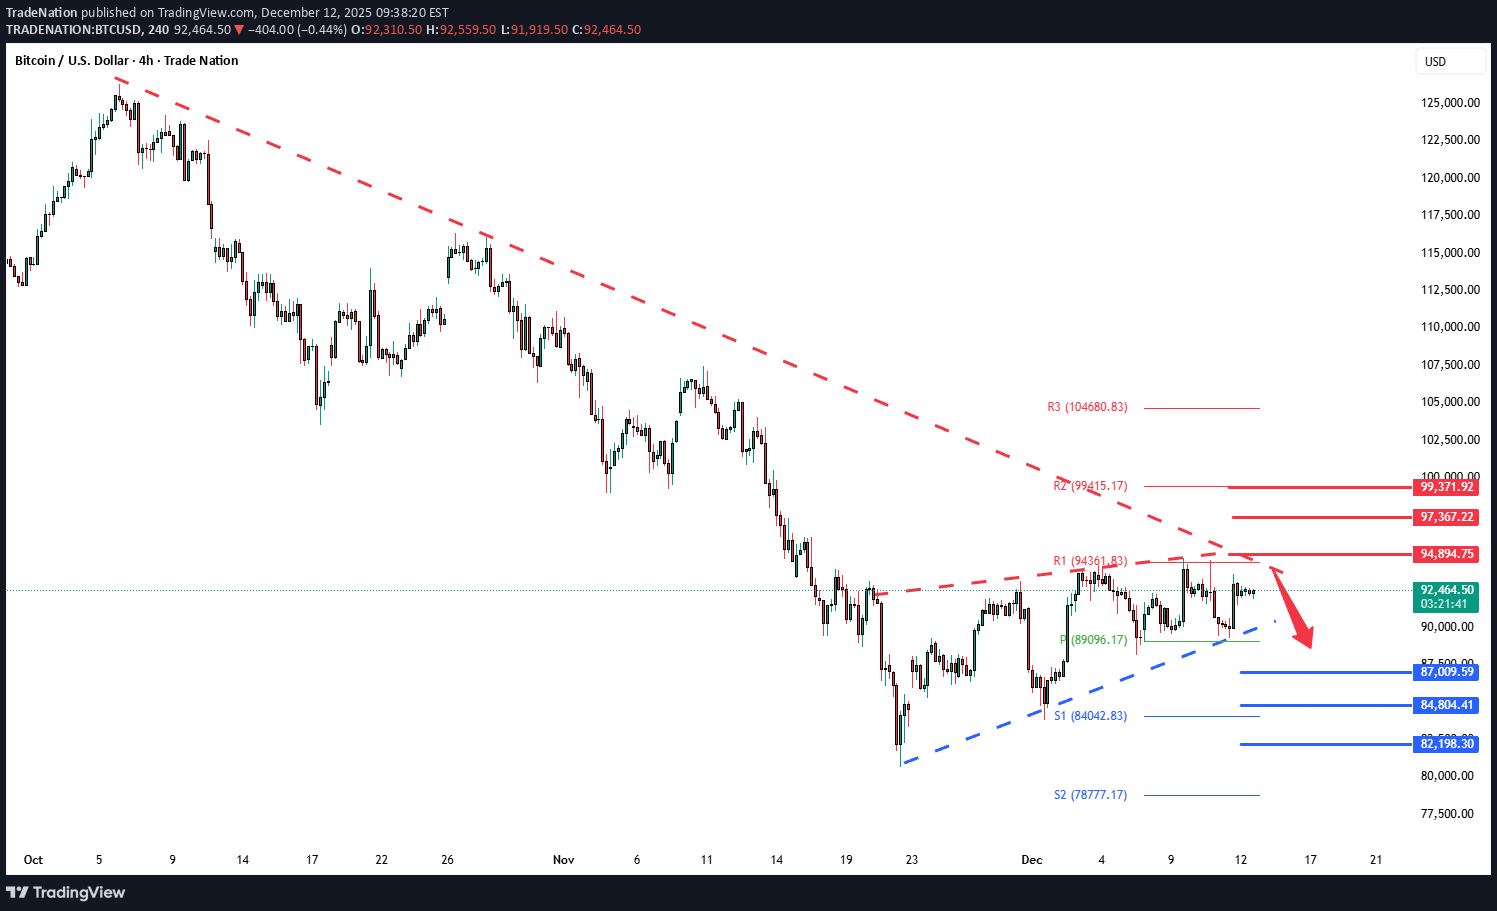
The BTCUSD currency pair continues to display a bearish outlook, in line with the prevailing downward trend. Recent price action suggests a corrective pullback, potentially setting up for another move lower if resistance holds. Key Level: 94,900 This zone, previously a consolidation area, now acts as a significant resistance level. Bearish Scenario (rejection at 94,900): A failed test and rejection at 94,900 would likely resume the bearish momentum. Downside targets include: 87,066 – Initial support 84,880 – Intermediate support 82,220 – Longer-term support level Bullish Scenario (breakout above 88,530): A confirmed breakout and daily close above 94,900 would invalidate the bearish setup. In that case, potential upside resistance levels are: 97,367 – First resistance 99,370 – Further upside target Conclusion BTCUSD remains under bearish pressure, with the 98,240 level acting as a key inflection point. As long as price remains below this level, the bias favours further downside. Traders should watch for price confirmation around that level to assess the next move. This communication is for informational purposes only and should not be viewed as any form of recommendation as to a particular course of action or as investment advice. It is not intended as an offer or solicitation for the purchase or sale of any financial instrument or as an official confirmation of any transaction. Opinions, estimates and assumptions expressed herein are made as of the date of this communication and are subject to change without notice. This communication has been prepared based upon information, including market prices, data and other information, believed to be reliable; however, Trade Nation does not warrant its completeness or accuracy. All market prices and market data contained in or attached to this communication are indicative and subject to change without notice.
Disclaimer
Any content and materials included in Sahmeto's website and official communication channels are a compilation of personal opinions and analyses and are not binding. They do not constitute any recommendation for buying, selling, entering or exiting the stock market and cryptocurrency market. Also, all news and analyses included in the website and channels are merely republished information from official and unofficial domestic and foreign sources, and it is obvious that users of the said content are responsible for following up and ensuring the authenticity and accuracy of the materials. Therefore, while disclaiming responsibility, it is declared that the responsibility for any decision-making, action, and potential profit and loss in the capital market and cryptocurrency market lies with the trader.