
ZKJ
Polyhedra Network
| تریدر | نوع سیگنال | حد سود/ضرر | زمان انتشار | مشاهده پیام |
|---|---|---|---|---|
No results found. | ||||
Price Chart of Polyhedra Network
سود 3 Months :
سیگنالهای Polyhedra Network
Filter
Sort messages by
Trader Type
Time Frame

Thebitcoin37
BE READY FOR ANOTHER PUMP OF $ZKJ.
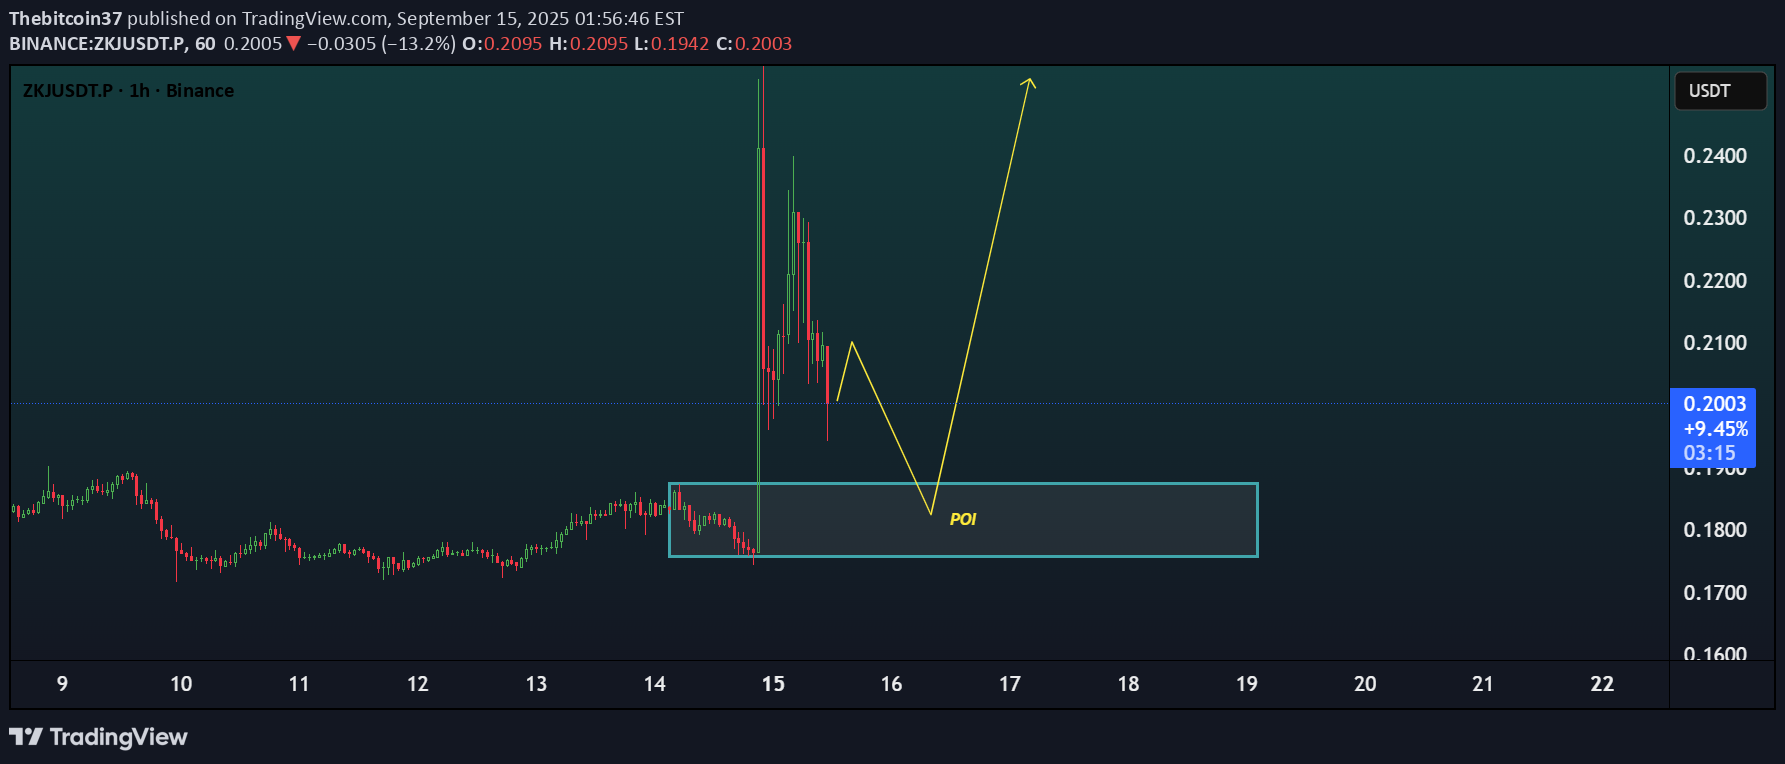
ZKJ/USDT Update Price made a sharp pump earlier and is now retracing. We are watching the POI (Point of Interest) zone around 0.18–0.19 where the pump originally started. 👉 If price returns to this zone, we will look for bullish confirmation (candle patterns or order flow shift). 👉 This level holds demand and can act as a strong base for the next leg upward. ⚡ Potential upside remains open if the POI holds.

achooooooooool
Bulish pattern on the way?

The ZKJUSDT chart on TradingView shows a clear bullish channel formation with the key support level at 0.23 USDT acting as the pivot. The price must consistently stay above this level to maintain the bullish trend, which aligns with the double bottom breakout confirmed earlier. Currently trading around 0.31 USDT, ZKJ has shown strong momentum with a recent high near 0.36 USDT, reflecting significant buying strength even in a volatile low-cap environment. Volume remains elevated, supporting the continuation of upward price action toward resistance targets near 0.36 and potentially 0.50 USDT if the bullish channel holds. A breakdown below 0.23 would signal risk of trend reversal or deeper correction. Overall, as long as price sustains above 0.23 USDT, ZKJ is positioned for further gains with strong technical support and upside potential in the near to mid term. Traders should monitor volume and retests of support for confirmation
achooooooooool
Update

The price action is unfolding as expected. After a major drop, we've now formed a higher low, which also completes a double bottom pattern — a classic bullish reversal signal. - If the price breaks above the key resistance at 0.2350, it could confirm the double bottom. - A successful breakout may open the path toward the next major target at 0.3100.
achooooooooool
The bearish trend is end?

After a significant drop in price, this is the first time we've seen a higher low in the cryptocurrency market. If this level holds through the end of the week, it would be a positive sign for the trend.

AmateurxTrader
$ZKJ Potential Bottom Detected with Bullish Divergence
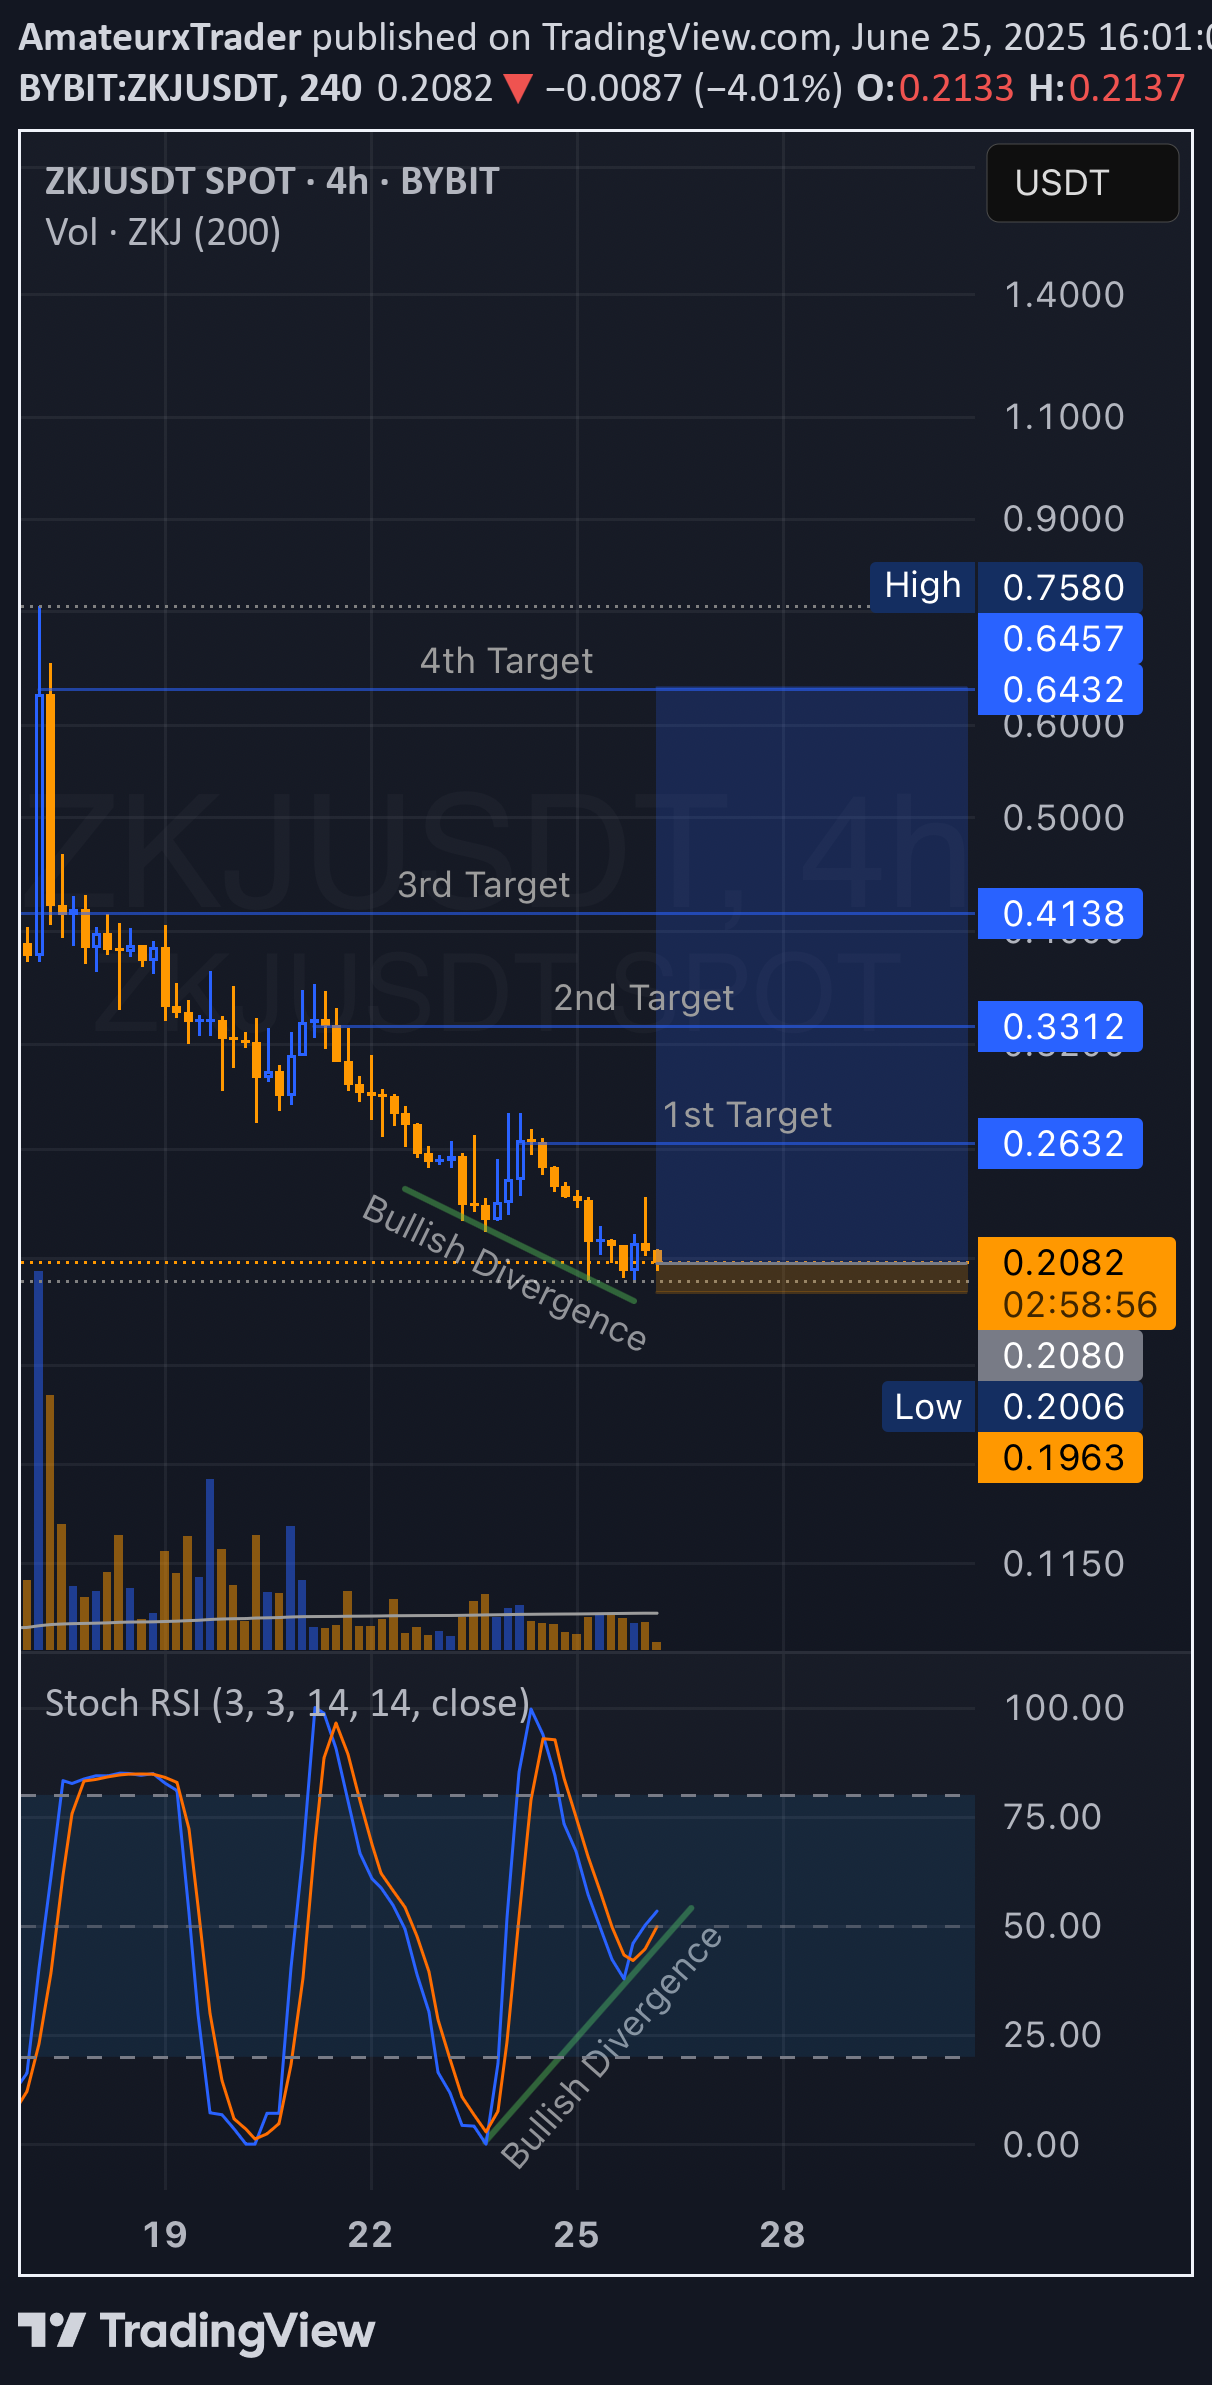
I'm observing a potential bottom formation on ZKJUSDT 4H chart, supported by a clear bullish divergence between price action and the Stochastic RSI. Price has been making lower lows, while the Stoch RSI is showing higher lows — indicating a possible momentum shift. This divergence suggests that selling pressure may be weakening and a potential reversal could be near. I've marked 4 target levels based on previous structure and Fibonacci zones: 1st Target: 0.2632 2nd Target: 0.3312 3rd Target: 0.4138 4th Target: 0.6432 - 0.6457 Key support zone lies around 0.1963 - 0.2080. Invalidation if price breaks below this support range. Not financial advice. Always do your own research!
Disclaimer
Any content and materials included in Sahmeto's website and official communication channels are a compilation of personal opinions and analyses and are not binding. They do not constitute any recommendation for buying, selling, entering or exiting the stock market and cryptocurrency market. Also, all news and analyses included in the website and channels are merely republished information from official and unofficial domestic and foreign sources, and it is obvious that users of the said content are responsible for following up and ensuring the authenticity and accuracy of the materials. Therefore, while disclaiming responsibility, it is declared that the responsibility for any decision-making, action, and potential profit and loss in the capital market and cryptocurrency market lies with the trader.