
XAI
Xai
| تریدر | نوع سیگنال | حد سود/ضرر | زمان انتشار | مشاهده پیام |
|---|---|---|---|---|
No results found. | ||||
Price Chart of Xai
سود 3 Months :
سیگنالهای Xai
Filter
Sort messages by
Trader Type
Time Frame

CryptoAnalystSignal
#XAI/USDT — Descending Triangle: Ready for Takeoff or Breakdow
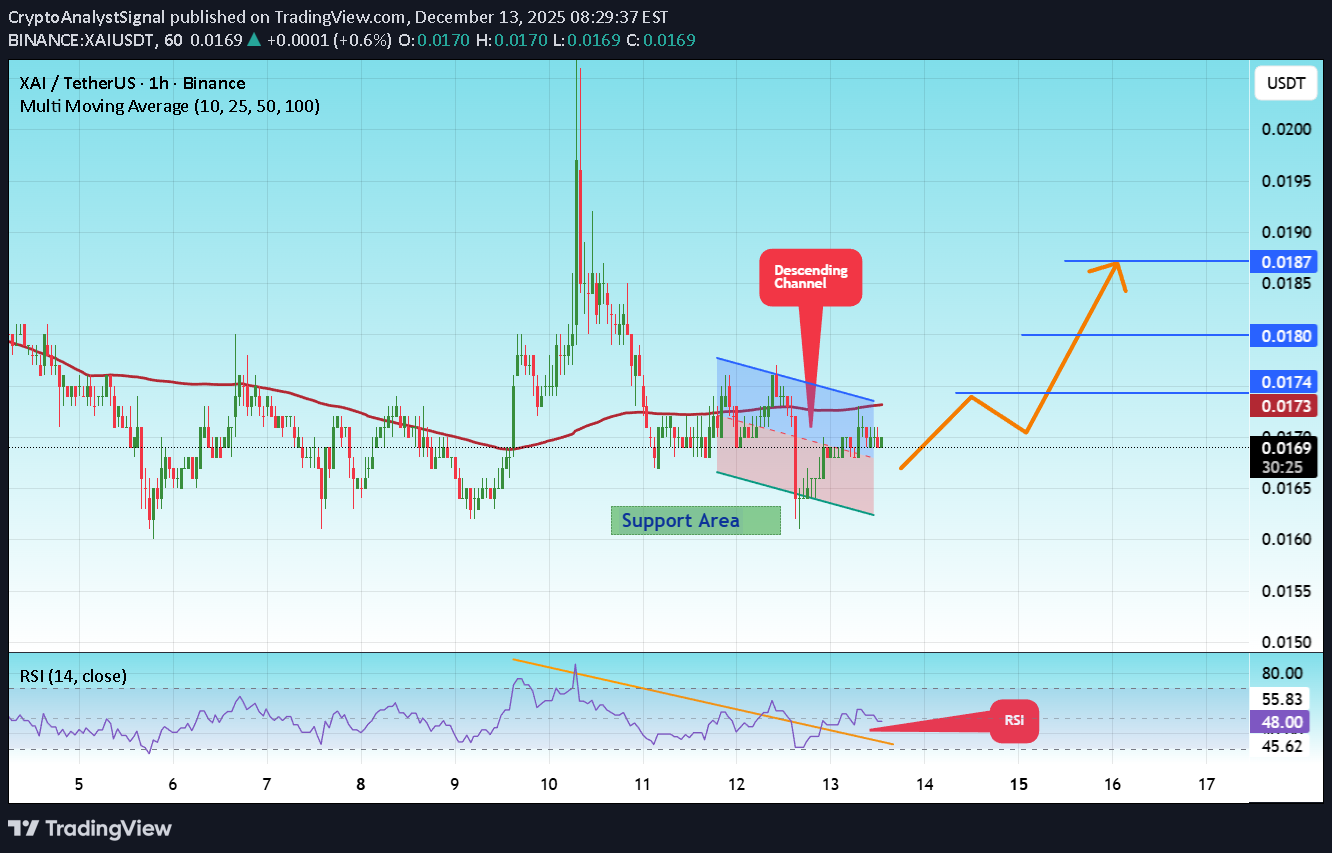
#XAI The price is moving in a descending channel on the 1-hour timeframe. It has reached the lower boundary and is heading towards a breakout, with a retest of the upper boundary expected. We are seeing a bearish bias in the Relative Strength Index (RSI), which has reached near the lower boundary, and an upward bounce is expected. There is a key support zone in green at 0.0162, and the price has bounced from this level several times. Another bounce is expected. We are seeing a trend towards stabilizing above the 100-period moving average, which we are approaching, supporting the upward trend. Entry Price: 0.0169 First Target: 0.0174 Second Target: 0.0180 Third Target: 0.0187 Remember a simple principle: Money Management. Place your stop-loss order below the green support zone. For any questions, please leave a comment. Thank you.

Bithereum_io
XAIUSDT 1D
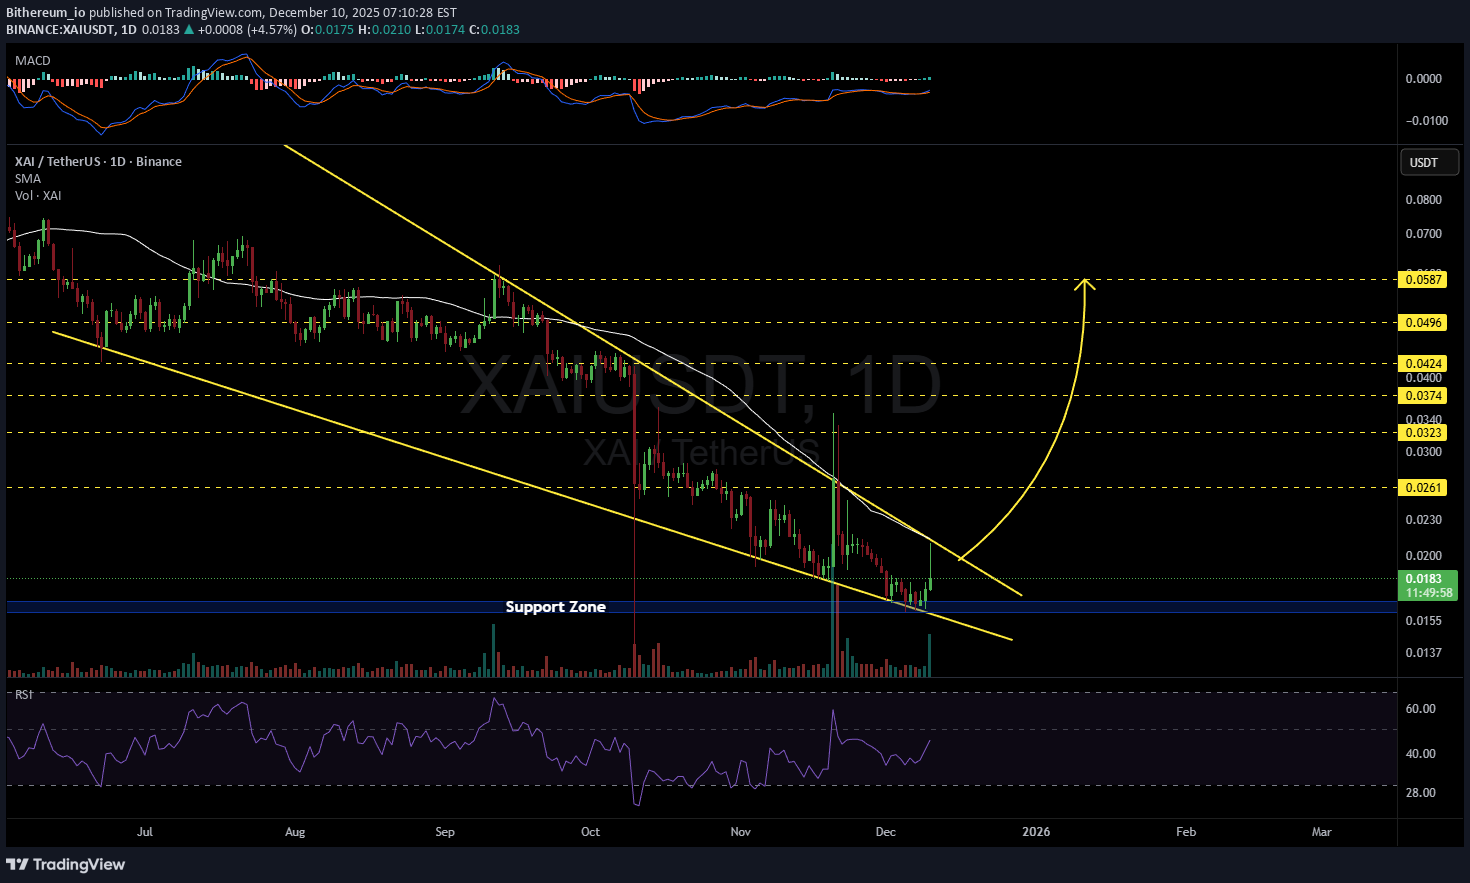
#XAI is moving inside a falling wedge pattern on the daily chart. It has bounced off the support zone with strong volume and has reached the wedge resistance and the daily SMA50. It has been rejected on the first touch, which is normal. We believe it will break above them soon. If that happens, the potential targets are: 🎯 $0.0261 🎯 $0.0323 🎯 $0.0374 🎯 $0.0424 🎯 $0.0496 🎯 $0.0587 ❌ Invalidation: a daily candle closing below the wedge. ⚠️ Always remember to use a tight stop-loss and maintain proper risk management.
CryptoAnalystSignal
تحلیل فوری XAI/USDT: مثلث نزولی؛ آماده صعود انفجاری یا سقوط نهایی؟

#XAI The price is moving in a descending channel on the 1-hour timeframe. It has reached the lower boundary and is heading towards a breakout, with a retest of the upper boundary expected. We are seeing a bearish bias in the Relative Strength Index (RSI), which has reached near the lower boundary, and an upward bounce is expected. There is a key support zone in green at 0.0167. The price has bounced from this level several times and is expected to bounce again. We are seeing a trend towards stabilizing above the 100-period moving average, which we are approaching, supporting the upward trend. Entry Price: 0.0172 First Target: 0.0180 Second Target: 0.0185 Third Target: 0.0191 Remember a simple principle: Money Management. Place your stop-loss order below the green support zone. For any questions, please leave a comment. Thank you.#XAI First Target: 0.0180 Reached Second Target: 0.0185 Reached Third Target: 0.0191 Reached
CryptoAnalystSignal
XAI/USDT: آیا مثلث نزولی در آستانه انفجار صعودی است؟ (تحلیل قیمت و سیگنال خرید)
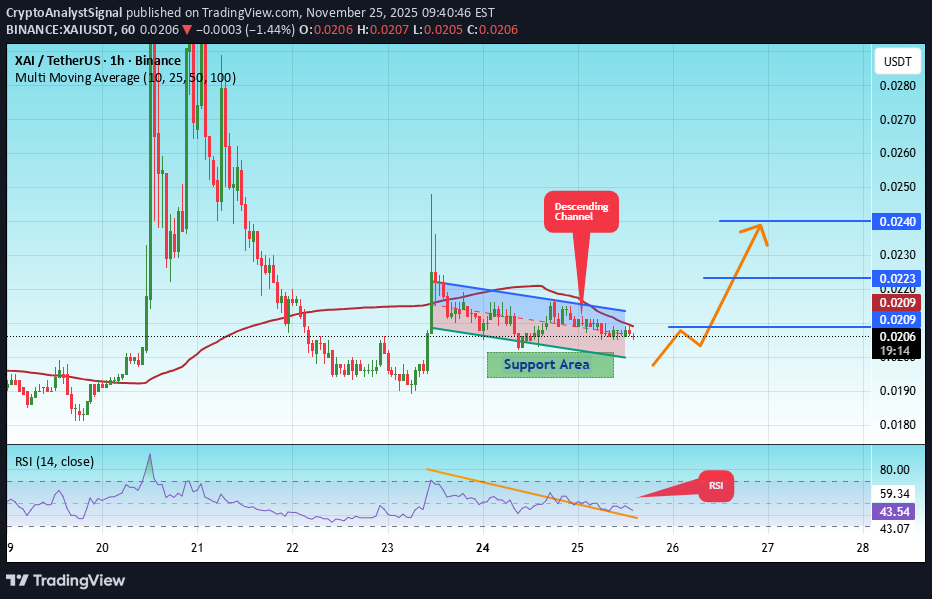
#XAI The price is moving within an ascending channel on the 1-hour timeframe and is adhering to it well. It is poised to break out strongly and retest the channel. We have a downtrend line on the RSI indicator that is about to break and retest, which supports the upward move. There is a key support zone in green at the price of 0.0198, representing a strong support point. We have a trend of consolidation above the 100-period moving average. Entry price: 0.0206 First target: 0.0209 Second target: 0.0223 Third target: 0.0240 Don't forget a simple money management rule: Place your stop-loss order below the support zone in green. Once you reach the first target, save some money and then change your stop-loss order to an entry order. For any questions, please leave a comment. Thank you.
CryptoAnalystSignal
تحلیل XAI/USDT: مثلث نزولی آماده پرواز است یا سقوط؟ (پیشبینی قیمت و اهداف خرید)
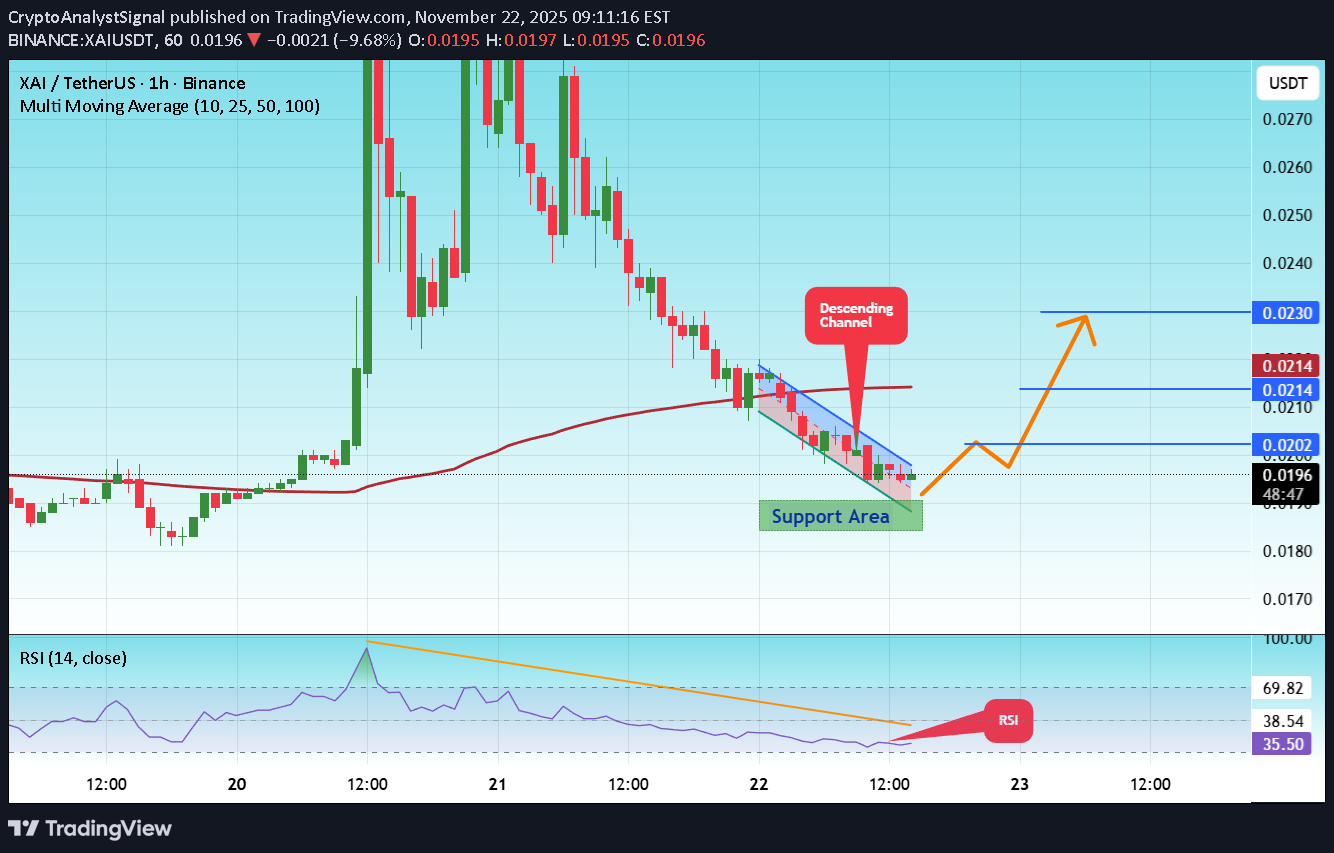
#XAI The price is moving in a descending channel on the 1-hour timeframe and is expected to break out and continue upwards. We have a trend to stabilize above the 100-period moving average again. We have a downtrend on the RSI indicator, which supports an upward move if it breaks above it. We have a key support zone in green that pushed the price higher at 0.0186. Entry price: 0.0196 First target: 0.0202 Second target: 0.0214 Third target: 0.0230 For risk management, don't forget your stop-loss and money management. The stop-loss is below the support zone in green. Upon reaching the first target, take some profit and then change your stop-loss order to an entry order. For any questions, please comment. Thank you.#XAI First target: 0.0202 Reached Second target: 0.0214 Reached Third target: 0.0230 Reached

Literaryflavus
سقوط آزاد یا پامپ نهایی؟ پیشبینی سرنوشت بیت کوین (XAI/BTC)

I'm waiting for exit pump at the bottom. It is not investment advice. DYOR
CryptoAnalystSignal
آینده XAI/USDT: آیا مثلث نزولی آماده پرواز است یا سقوط؟ (تحلیل قیمت و اهداف جدید)

#XAI The price is moving in a descending channel on the 1-hour timeframe and is expected to break out and continue upwards. We have a trend to stabilize above the 100-period moving average again. We have a downtrend on the RSI indicator, which supports an upward move if it breaks above it. We have a key support zone in green that pushed the price higher at 0.0193. Entry price: 0.0198 First target: 0.0203 Second target: 0.0210 Third target: 0.0220 For risk management, don't forget your stop-loss and capital management. The stop-loss is below the support zone in green. Upon reaching the first target, take some profit and then change your stop-loss order to an entry order. For any questions, please comment. Thank you.#XAI First target: 0.0203 Reached Second target: 0.0210 Reached Third target: 0.0220 Reached
CryptoAnalystSignal
تحلیل XAI/USDT: سقوط یا اوجگیری بزرگ؟ نقاط کلیدی ورود و خروج!
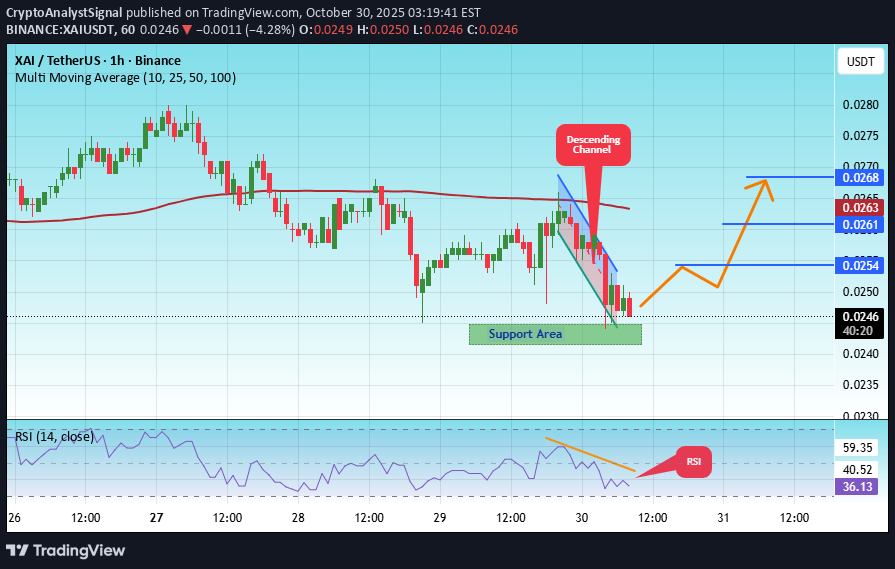
#XAI The price is moving within an ascending channel on the 1-hour timeframe and is adhering to it well. It is poised to break out strongly and retest the channel. We have a downtrend line on the RSI indicator that is about to break and retest, which supports the upward move. There is a key support zone in green at the price of 0.0243, representing a strong support point. We have a trend of consolidation above the 100-period moving average. Entry price: 0.0247 First target: 0.0254 Second target: 0.0261 Third target: 0.0268 Don't forget a simple point: capital management. Upon reaching the first target, save some money and then change your stop-loss order to an entry order. For any questions, please leave a comment. Thank you.#XAI First target: 0.0254 Reached Second target: 0.0261 Reached Third target: 0.0268 Reached
Literaryflavus
تحلیل شوکهکننده XAI: سقوط به زیر حمایت حیاتی ۰.۳۸۴؛ آیا زمان بازگشت است یا فاجعه؟

With a disgraceful October, XAI broke below the 0384 area, where it had been supporting for a long time. The graph looked a little vague to me. It can go to the bottom of the channel and make a death, or it can regain the support and start to rise. As a 0455 cost, I wish peace, sanity and minimum hair loss to all of us. YTD is not financial or investment advice. It is a note to time and to myself.
CryptoAnalystSignal
تحلیل XAI/USDT: مثلث نزولی، منتظر انفجار صعودی یا سقوط؟

#XAI The price is moving in a descending channel on the 1-hour frame and is expected to break and continue upward. We have a trend to stabilize above the 100 moving average once again. We have a downtrend on the RSI indicator that supports the upward move with a breakout. We have a major support area in green that pushed the price higher at 0.0274. Entry price: 0.0292. First target: 0.0308. Second target: 0.0326. Third target: 0.0346. To manage risk, don't forget stop loss and capital management. When you reach the first target, save some profits and then change the stop order to an entry order. For inquiries, please comment. Thank you.#XAI First target: 0.0308. Reached Second target: 0.0326. Reached Third target: 0.0346. Reached
Disclaimer
Any content and materials included in Sahmeto's website and official communication channels are a compilation of personal opinions and analyses and are not binding. They do not constitute any recommendation for buying, selling, entering or exiting the stock market and cryptocurrency market. Also, all news and analyses included in the website and channels are merely republished information from official and unofficial domestic and foreign sources, and it is obvious that users of the said content are responsible for following up and ensuring the authenticity and accuracy of the materials. Therefore, while disclaiming responsibility, it is declared that the responsibility for any decision-making, action, and potential profit and loss in the capital market and cryptocurrency market lies with the trader.