
VTHO
VeThor Token
| تریدر | نوع سیگنال | حد سود/ضرر | زمان انتشار | مشاهده پیام |
|---|---|---|---|---|
No results found. | ||||
Price Chart of VeThor Token
سود 3 Months :
سیگنالهای VeThor Token
Filter
Sort messages by
Trader Type
Time Frame

Crypto_alphabit
VITHO
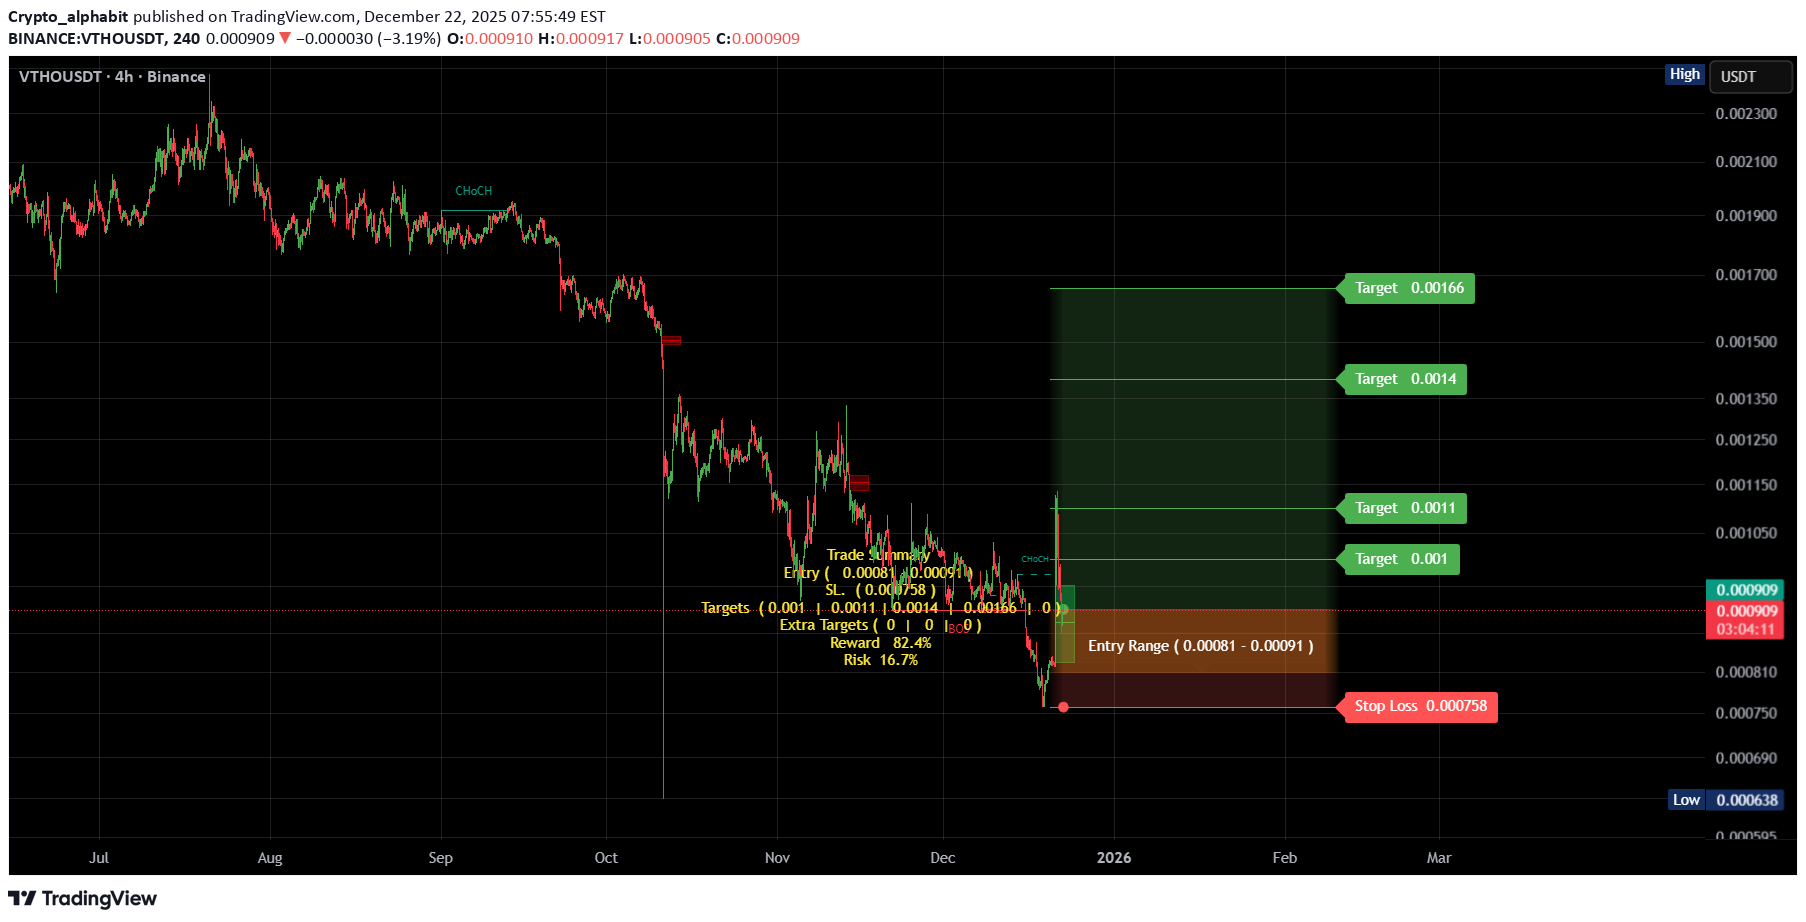
VTHOUSDT VITHO/ USDT Entry range (0.00081- 0.00091) SL 4H close below 0.000758 T1 0.00100 T2 0.00110 T3 0.00140 T4 0.00166 _______________________________________________________ Golden Advices. ******************** * collect the coin slowly in the entry range. * Please calculate your losses before the entry. * Do not enter any trade you find it not suitable for you. * No FOMO - No Rush , it is a long journey.

CryptoNuclear
VTHO در آستانه انفجار قیمتی: آیا کفسازی نهایی است یا سقوط بزرگ در راه؟
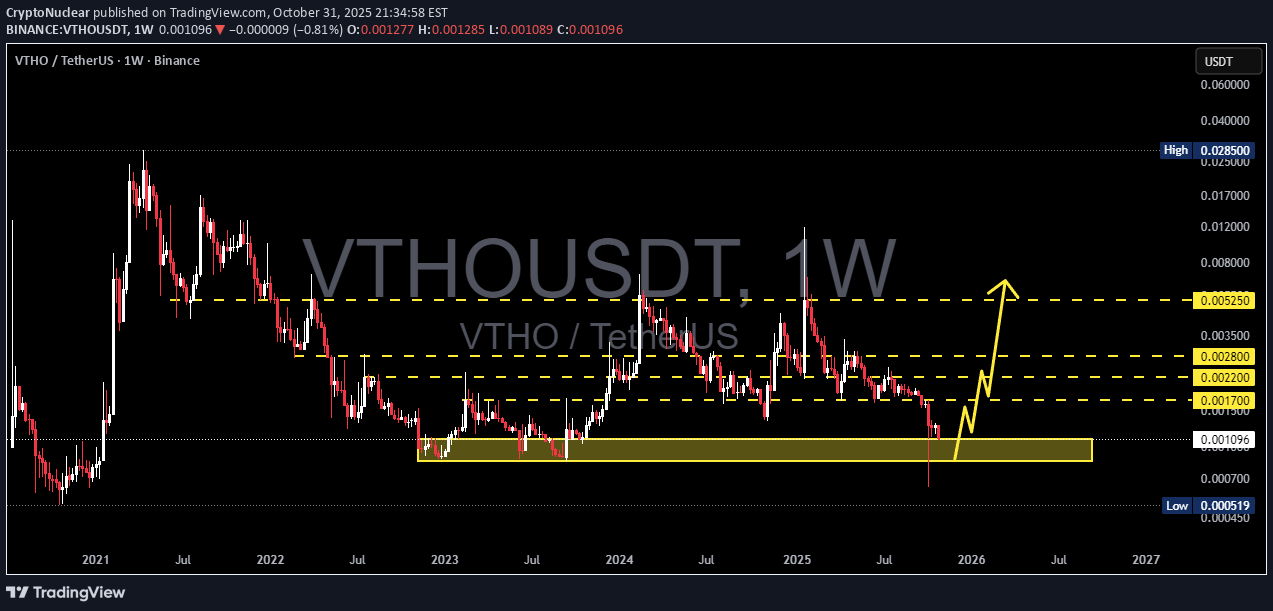
After nearly four years of continuous decline, VTHO has once again returned to a make-or-break zone — a strong demand area between 0.00109 – 0.00085. This zone isn’t just a price range; it’s the final line of defense for buyers, which previously saved the market from a major breakdown in mid-2023 and early 2024. But this time looks different — the latest weekly candle shows a deep wick below support, signaling a massive liquidity sweep and a possible re-accumulation phase if price manages to hold. If not, the next scenario could be a final capitulation toward the all-time low around 0.00052. --- Structure & Pattern Primary Trend: Persistent bearish since 2021, though price now sits within a macro support zone. Major Pattern: Potential double bottom / accumulation base if price closes above 0.00085 with a strong weekly candle. Previous Price Behavior: Several strong rallies (+100–200%) have started from this same zone, but each failed to break through the 0.0022–0.0028 resistance range. --- Bullish Scenario (Potential Reversal) Weekly candle holds and closes above 0.00109, showing that buyers are defending the zone. Rising volume confirms accumulation and may trigger a relief rally toward: Target 1: 0.00170 — minor resistance & initial reaction zone. Target 2: 0.00220 — light distribution area. Target 3: 0.00280 — confirmation of a local trend reversal. Final target: 0.00525 — key profit-taking zone if the macro reversal unfolds. If the double bottom pattern confirms, VTHO could enter a mid-term recovery phase, pushing above the psychological 0.003 level. --- Bearish Scenario (Further Breakdown) A weekly close below 0.00085 would confirm that the long-term support has failed. The yellow zone then flips into a supply zone (retest resistance). Downside continuation would likely target 0.00052, the historical low and final support line. A breakdown below 0.00052 would mark total capitulation, opening the door to new price discovery to the downside. --- Market Outlook & Perspective VTHO stands in a high-stakes phase, where a single weekly candle could decide the direction of the next several months. The long wick below support suggests that the market is testing the conviction of long-term holders. If the zone holds — the strongest hands will be rewarded. But if it breaks, the market will write a new chapter in VTHO’s long downtrend. --- #VTHO #VTHOUSDT #CryptoAnalysis #TechnicalAnalysis #SupportAndResistance #CryptoUpdate #CryptoReversal #PriceAction #MarketStructure #SwingTrade #CryptoChart

aet61
VTHOUSDT //

As long as we stay on the green line, the direction is up. The first target is Fibo 1.414, which is 0.002212, the main target is 0.002453. Cut losses when closing below the green line.
CryptoNuclear
VTHO/USDT Reversal Zone? Weekly Demand Area Holds the Key!
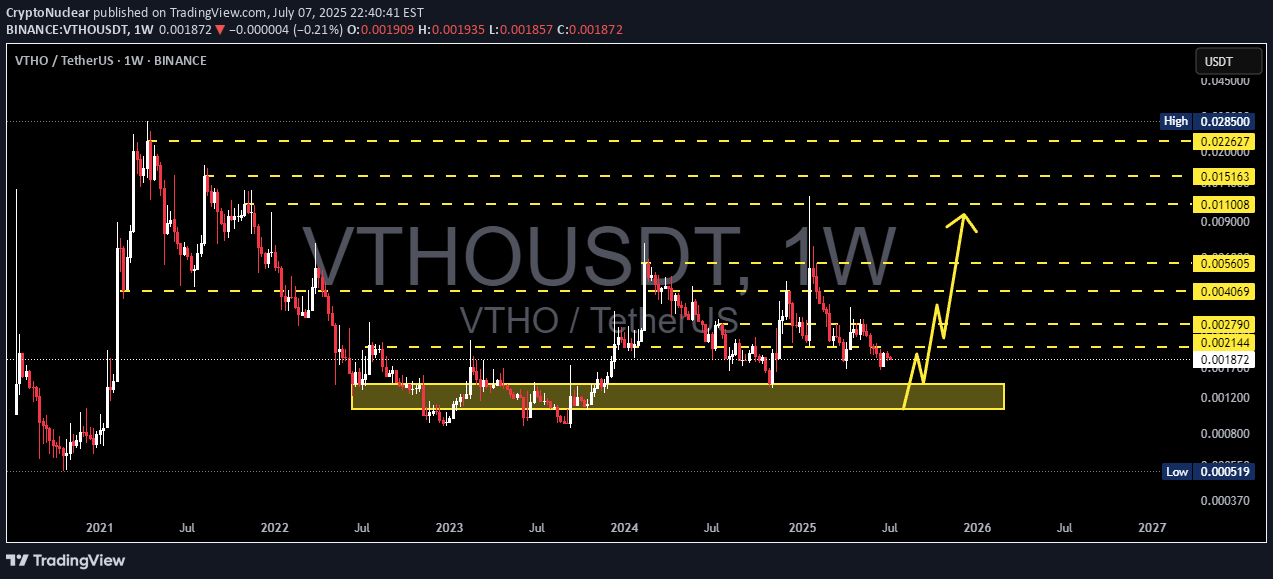
📊 Full Analysis of VTHO/USDT (1W Timeframe):📌 Overview:VTHO/USDT is currently sitting at a critical level after revisiting a strong historical demand zone around 0.0012–0.0018 USDT. This support zone has been respected multiple times since mid-2022 and has acted as a key reversal point in the past.📈 Bullish Scenario:✅ Support Zone HoldingThe price is holding within the yellow support box, indicating active buyers and potential accumulation.✅ Possible Reversal PatternIf the price forms a higher low or a clear rejection here, there’s potential for a Double Bottom or even an Adam & Eve reversal pattern.✅ Potential Upside Targets:Minor Resistance: 0.00214 – 0.00279Intermediate Target: 0.00406Major Resistance: 0.0056 – 0.011Higher Target: 0.015 – 0.022 USDTUltimate Long-Term Target: 0.0285 USDT (historical high)📌 Bullish confirmation can come from: a strong bounce with volume, VeChain/VTHO ecosystem news, or general crypto market strength.📉 Bearish Scenario:❌ Breakdown from Key SupportIf price breaks down below 0.0012, it opens the risk of a further drop toward 0.00052 USDT, which is the multi-year low last seen in 2020.📉 Bearish signs to watch:Weekly candle close below supportIncreasing sell volumeWeak buyer reaction near support🔍 Pattern Analysis:📌 Potential Double Bottom ZoneThe highlighted yellow zone may form the base for a double bottom reversal pattern—a bullish setup if confirmed.📌 Range-Bound StructurePrice has been consolidating in a wide horizontal range between 0.0018 – 0.0056. A breakout from this range will determine the next long-term direction.📢 Conclusion:VTHO is at a critical accumulation zone. If the demand zone holds, a bullish reversal may unfold with significant upside potential. However, a breakdown below the zone would invalidate the bullish setup and signal deeper downside.#VTHO #VTHOUSDT #CryptoAnalysis #AltcoinSeason #TechnicalAnalysis #BullishSetup #BearishScenario #CryptoTrading #SupportZone #ReversalPattern

Filnft
vtho scalp long to $0.002572

#vtho long Stop: $0.002485 or lowerTarget: $0.002572Time sensitiveRoughly 2RRClosed
Filnft
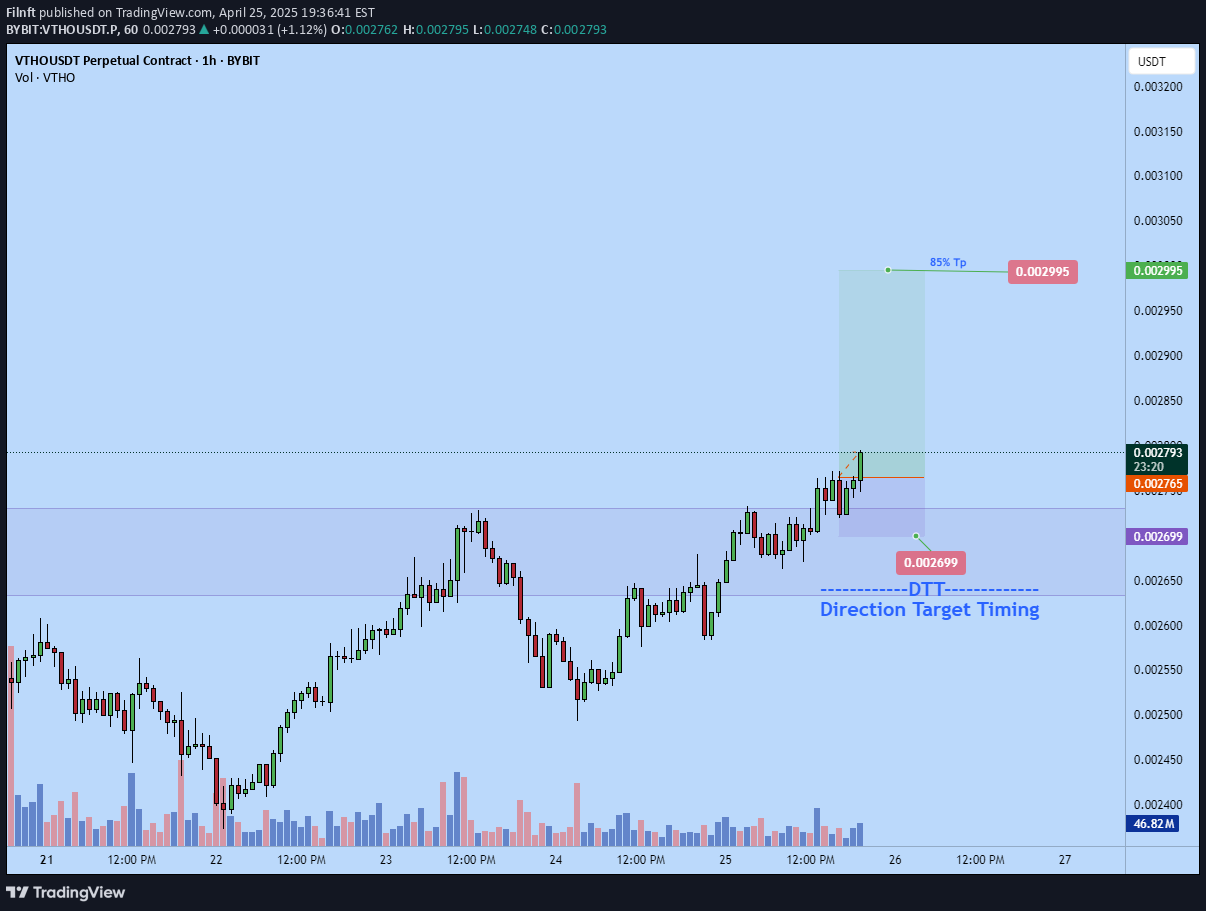
Vtho short

Vtho shortTarget: $0.002349Stop: $0.002437Roughly 2RRPrice rejecting daily resistance, flipped bearish on lower tf. Buyers getting exhausted, supply increasing.Dtt strategy applied Manage risk if following
Filnft
vtho long to 0.003

Filnft
VTHo long to $0.003
I just opened a long position on vtho. Targeting $0.03 areaIts primed for a breakout and as am typing looks likely to break now. Times sentive !!Woke up in draw down with market almost hitting stoploss and decided to close all my positions including this
Filnft
VTHO long to $0.002947

This is an optimistic trade. I do see potential for a pump all the way to that point but would need some strong bullish move for that to happen. For today main trget is around the $0.002728 area but I'll be monitoring to potentially take profit earlier if see the need if am available.Based on my analysis, longs are more probable at the moment.Not he perfect DTT setup but odds still in my favor.Continuation of trend
Filnft
VTHO short to $0.002490

Just set a limit order to short vthoTargeting $0.0024902RR + trade.Stop: $0.002591DTT setupWill probably scale in later to improve RR if tp not hitIs this valuable info? Comment below
Disclaimer
Any content and materials included in Sahmeto's website and official communication channels are a compilation of personal opinions and analyses and are not binding. They do not constitute any recommendation for buying, selling, entering or exiting the stock market and cryptocurrency market. Also, all news and analyses included in the website and channels are merely republished information from official and unofficial domestic and foreign sources, and it is obvious that users of the said content are responsible for following up and ensuring the authenticity and accuracy of the materials. Therefore, while disclaiming responsibility, it is declared that the responsibility for any decision-making, action, and potential profit and loss in the capital market and cryptocurrency market lies with the trader.