
USUAL
Usual
| تریدر | نوع سیگنال | حد سود/ضرر | زمان انتشار | مشاهده پیام |
|---|---|---|---|---|
No results found. | ||||
Price Chart of Usual
سود 3 Months :
سیگنالهای Usual
Filter
Sort messages by
Trader Type
Time Frame

salahuddin20041
آخرین بهروزرسانی موقعیتهای خرید (Long) جفت ارز USUAL/USDT: ورود جدید با قیمت $0.0265!
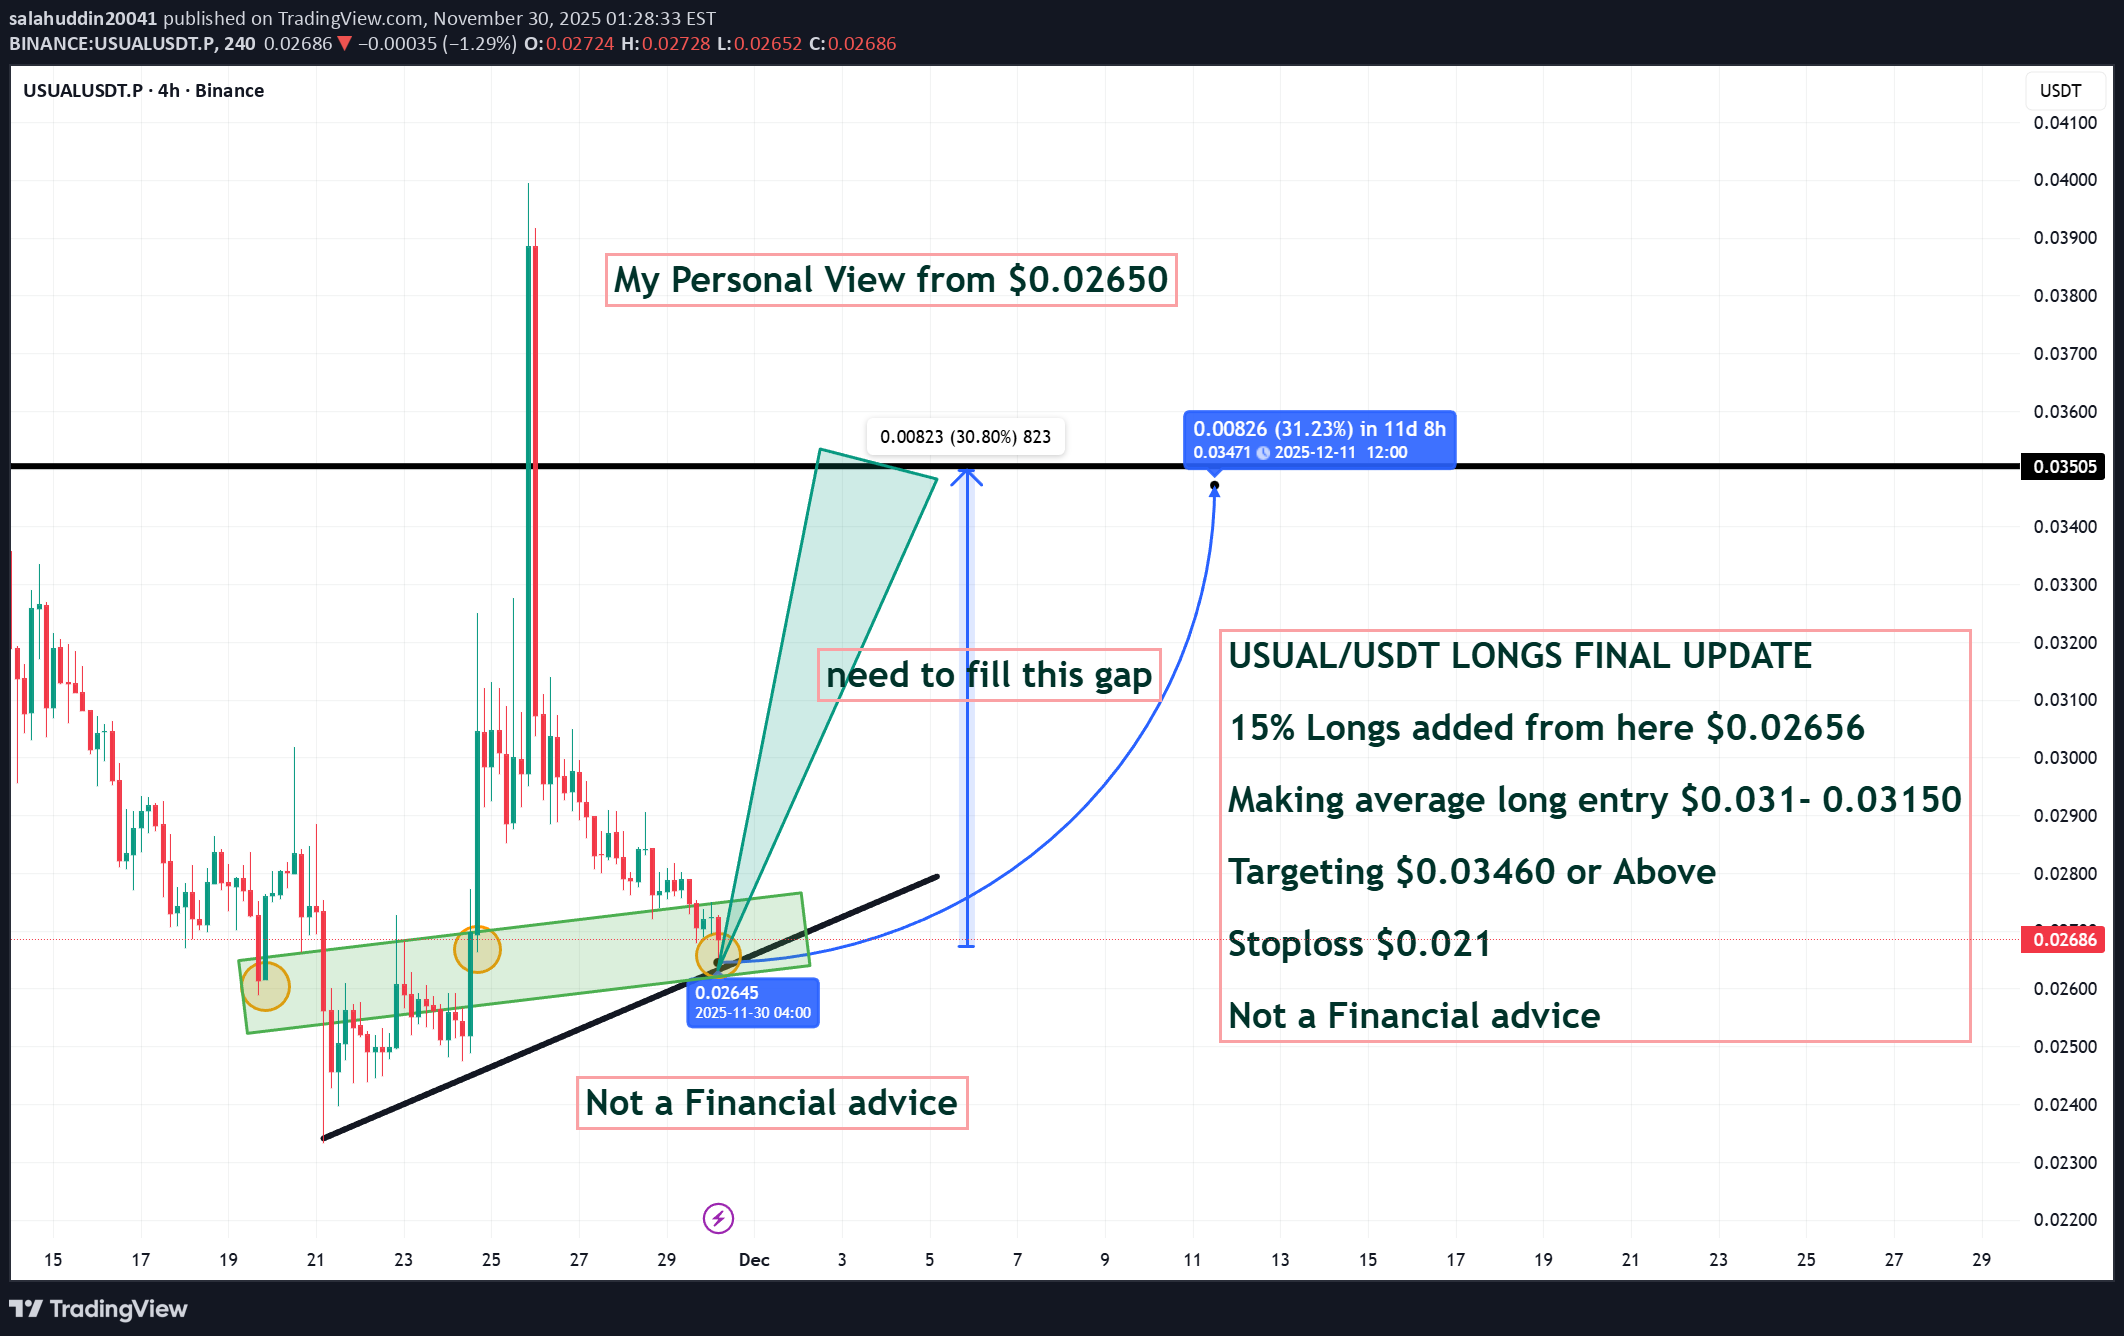
USUAL/USDT LONGS FINAL UPDATE 15% Longs added from here $0.02656 Making average long entry $0.031- 0.03150 Targeting $0.03460 or Above Stoploss $0.021 Not a Financial adviceAccording to TA (USUAL all closed at $0.02630) Trade Unsuccessful
salahuddin20041
فرصت خرید طلایی ارز دیجیتال زیر قیمت ۰.۰۳۱ دلار: حمایت اصلی و اهداف جدید
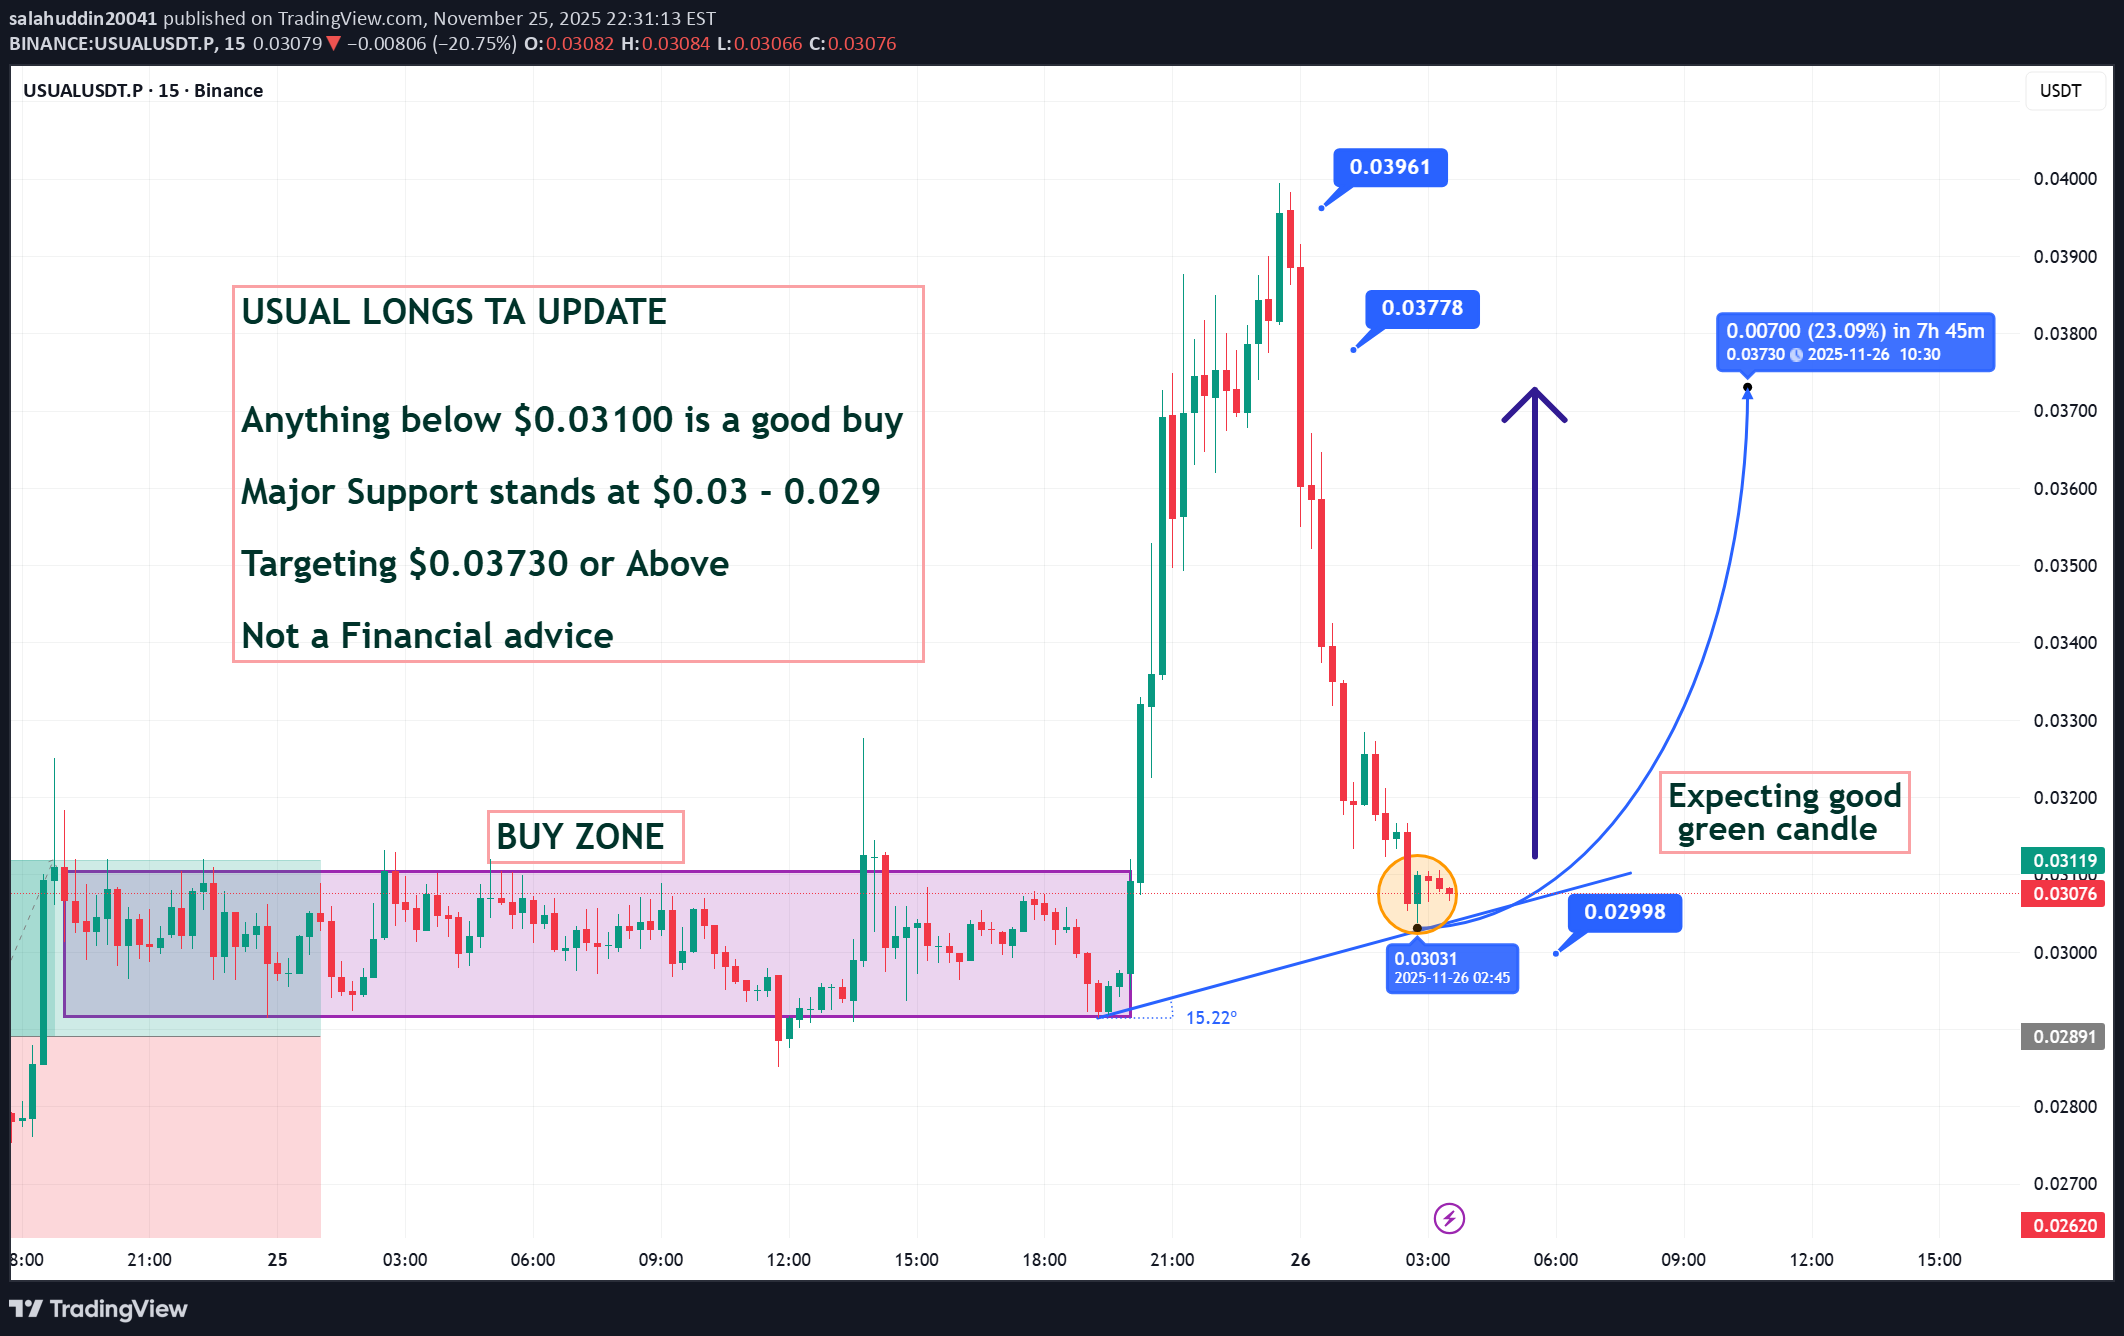
USUAL LONGS TA UPDATE Anything below $0.03100 is a good buy Major Support stands at $0.03 - 0.029 Targeting $0.03730 or Above Not a Financial adviceUSUAL/USDT LONGS FINAL UPDATE 15% Longs added from here $0.02656 Making average long entry $0.031- 0.03150 Targeting $0.03460 or Above Stoploss $0.021 Not a Financial adviceAccording to TA (USUAL all closed at $0.02630) Trade Unsuccessful
salahuddin20041
سیگنال خرید همیشگی: نقطه ورود ایدهآل و اهداف هیجانانگیز برای ترید پرپچوال!
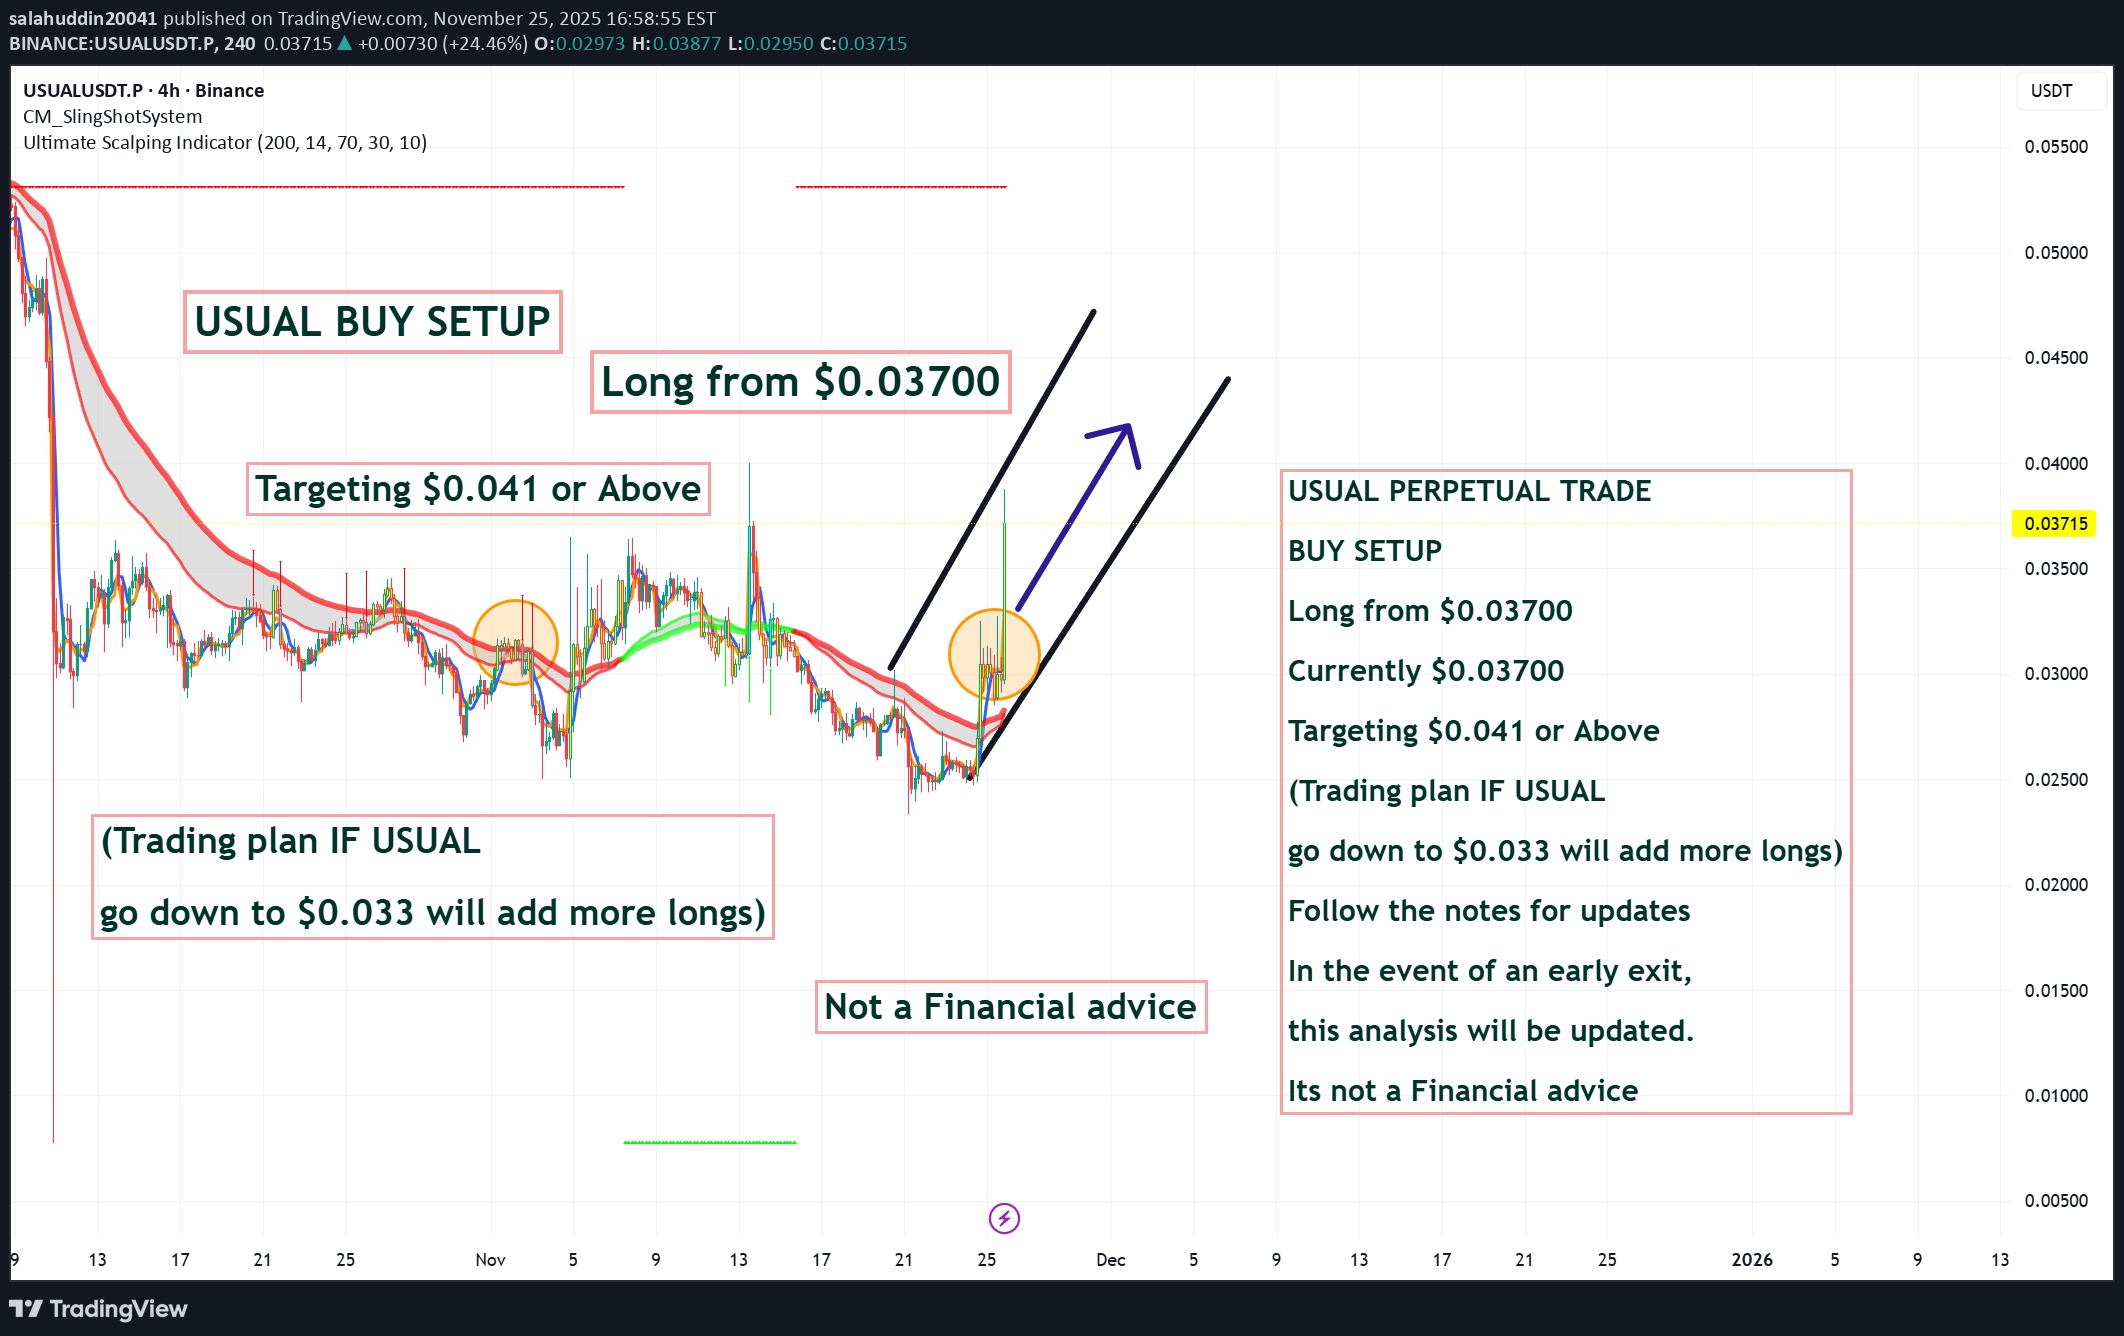
USUAL PERPETUAL TRADE BUY SETUP Long from $0.03700 Currently $0.03700 Targeting $0.041 or Above (Trading plan IF USUAL go down to $0.033 will add more longs) Follow the notes for updates In the event of an early exit, this analysis will be updated. Its not a Financial adviceAccording to TA (20% longs added from here $0.03360) New target $0.03930 or Above Not a Financial adviceUSUAL LONGS TA UPDATE Anything below $0.03100 is a good buy Anything below $0.03100 is a good buy Major Support stands at $0.03 - 0.029 Targeting $0.03730 or Above Not a Financial adviceUSUAL/USDT LONGS FINAL UPDATE 15% Longs added from here $0.02656 Making average long entry $0.031- 0.03150 Targeting $0.03460 or Above Stoploss $0.021 Not a Financial adviceAccording to TA (USUAL all closed at $0.02630) Trade Unsuccessful

Alpha-GoldFX
هشدار: سیگنال صعودی بزرگ در USUALUSDT! الگوی گُوِه نزولی نویدبخش جهش ۹۰ درصدی!
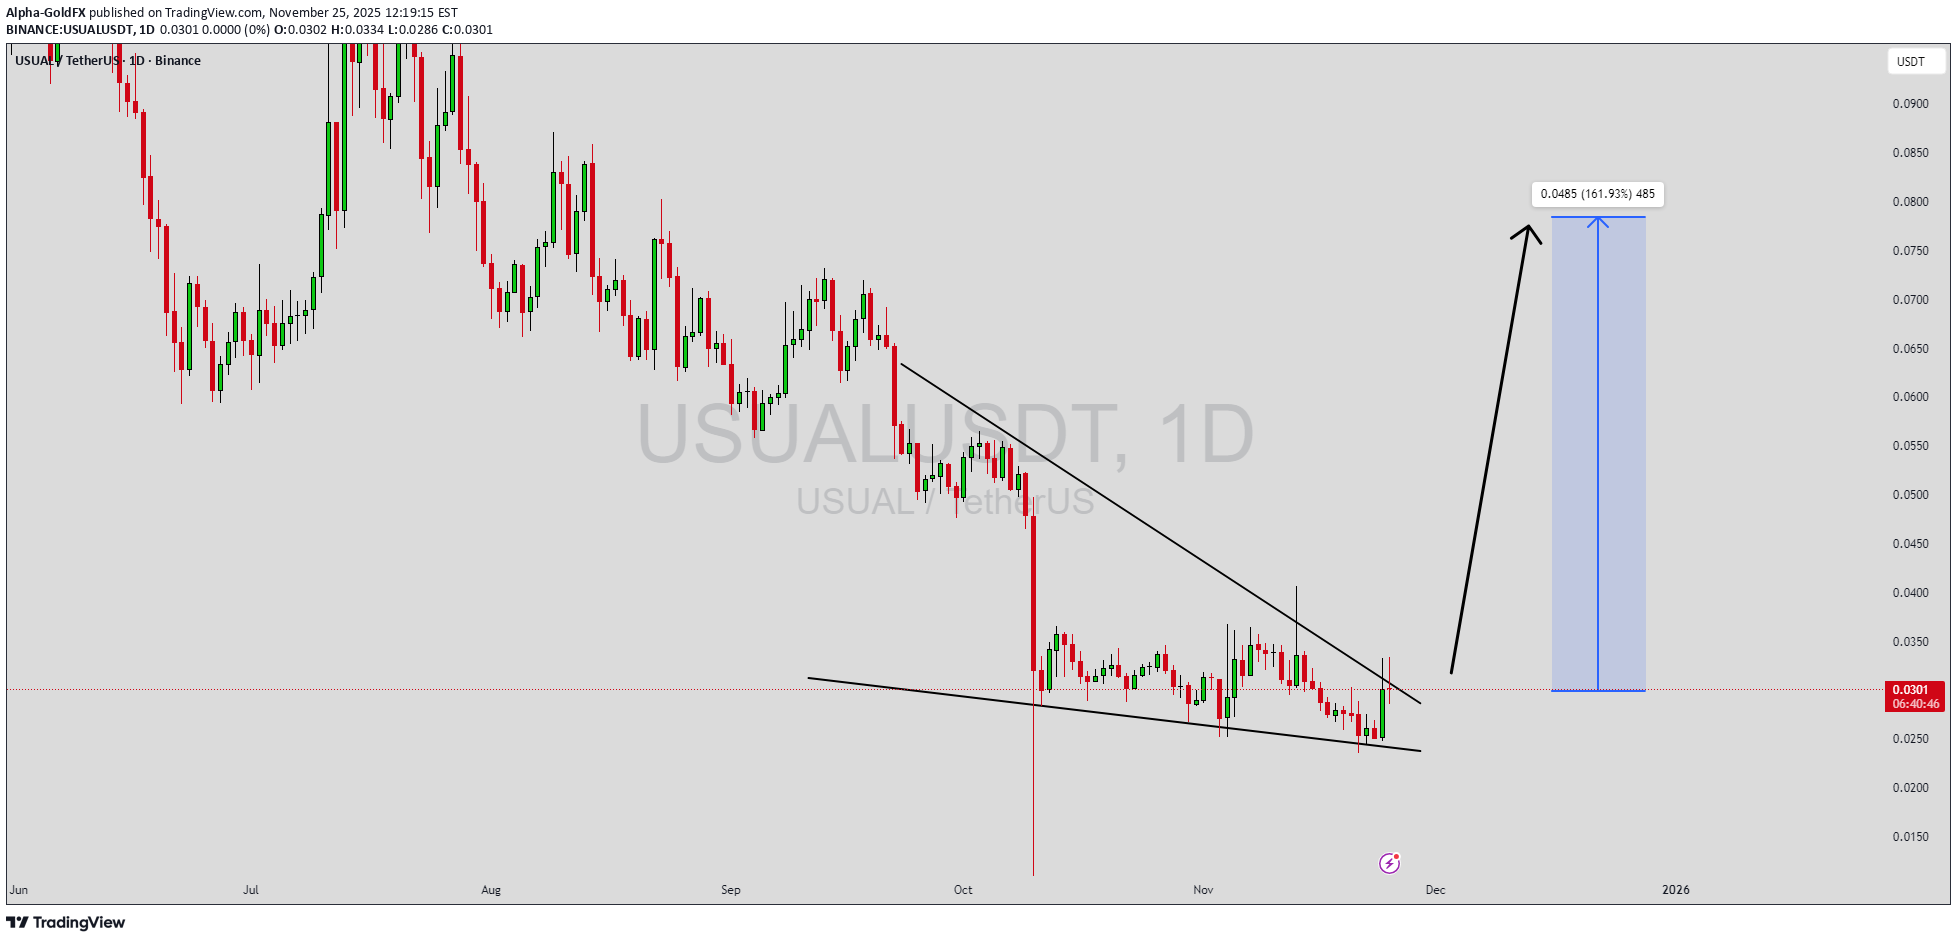
USUALUSDT is forming a clear falling wedge pattern, a classic bullish reversal signal that often indicates an upcoming breakout. The price has been consolidating within a narrowing range, suggesting that selling pressure is weakening while buyers are beginning to regain control. With consistent volume confirming accumulation at lower levels, the setup hints at a potential bullish breakout soon. The projected move could lead to an impressive gain of around 90% to 100% once the price breaks above the wedge resistance. This falling wedge pattern is typically seen at the end of downtrends or corrective phases, and it represents a potential shift in market sentiment from bearish to bullish. Traders closely watching USUALUSDT are noting the strengthening momentum as it nears a breakout zone. The good trading volume adds confidence to this pattern, showing that market participants are positioning early in anticipation of a reversal. Investors’ growing interest in USUALUSDT reflects rising confidence in the project’s long-term fundamentals and current technical strength. If the breakout confirms with sustained volume, this could mark the start of a fresh bullish leg. Traders might find this a valuable setup for medium-term gains, especially as the wedge pattern completes and buying momentum accelerates. ✅ Show your support by hitting the like button and ✅ Leaving a comment below! (What is your opinion about this Coin?) Your feedback and engagement keep me inspired to share more insightful market analysis with you!
Alpha-GoldFX
سیگنال انفجاری USUALUSDT: تشکیل گُوِه نزولی آماده پرش 50 درصدی!
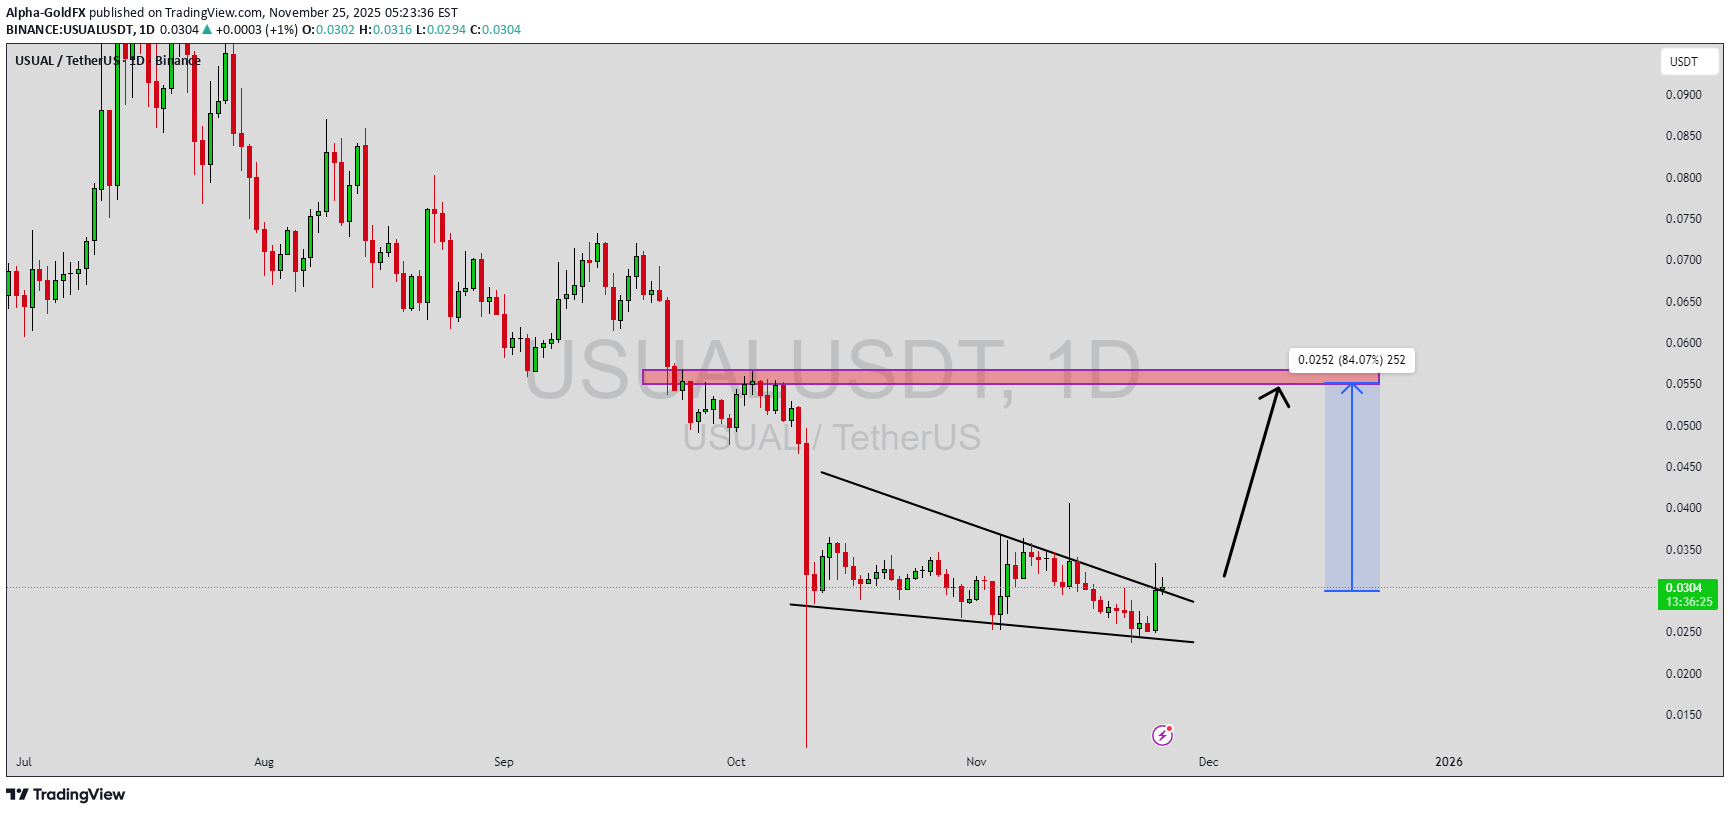
USUALUSDT is forming a clear falling wedge pattern, a classic bullish reversal signal that often indicates an upcoming breakout. The price has been consolidating within a narrowing range, suggesting that selling pressure is weakening while buyers are beginning to regain control. With consistent volume confirming accumulation at lower levels, the setup hints at a potential bullish breakout soon. The projected move could lead to an impressive gain of around 40% to 50% once the price breaks above the wedge resistance. This falling wedge pattern is typically seen at the end of downtrends or corrective phases, and it represents a potential shift in market sentiment from bearish to bullish. Traders closely watching USUALUSDT are noting the strengthening momentum as it nears a breakout zone. The good trading volume adds confidence to this pattern, showing that market participants are positioning early in anticipation of a reversal. Investors’ growing interest in USUALUSDT reflects rising confidence in the project’s long-term fundamentals and current technical strength. If the breakout confirms with sustained volume, this could mark the start of a fresh bullish leg. Traders might find this a valuable setup for medium-term gains, especially as the wedge pattern completes and buying momentum accelerates. ✅ Show your support by hitting the like button and ✅ Leaving a comment below! (What is your opinion about this Coin?) Your feedback and engagement keep me inspired to share more insightful market analysis with you!
Alpha-GoldFX
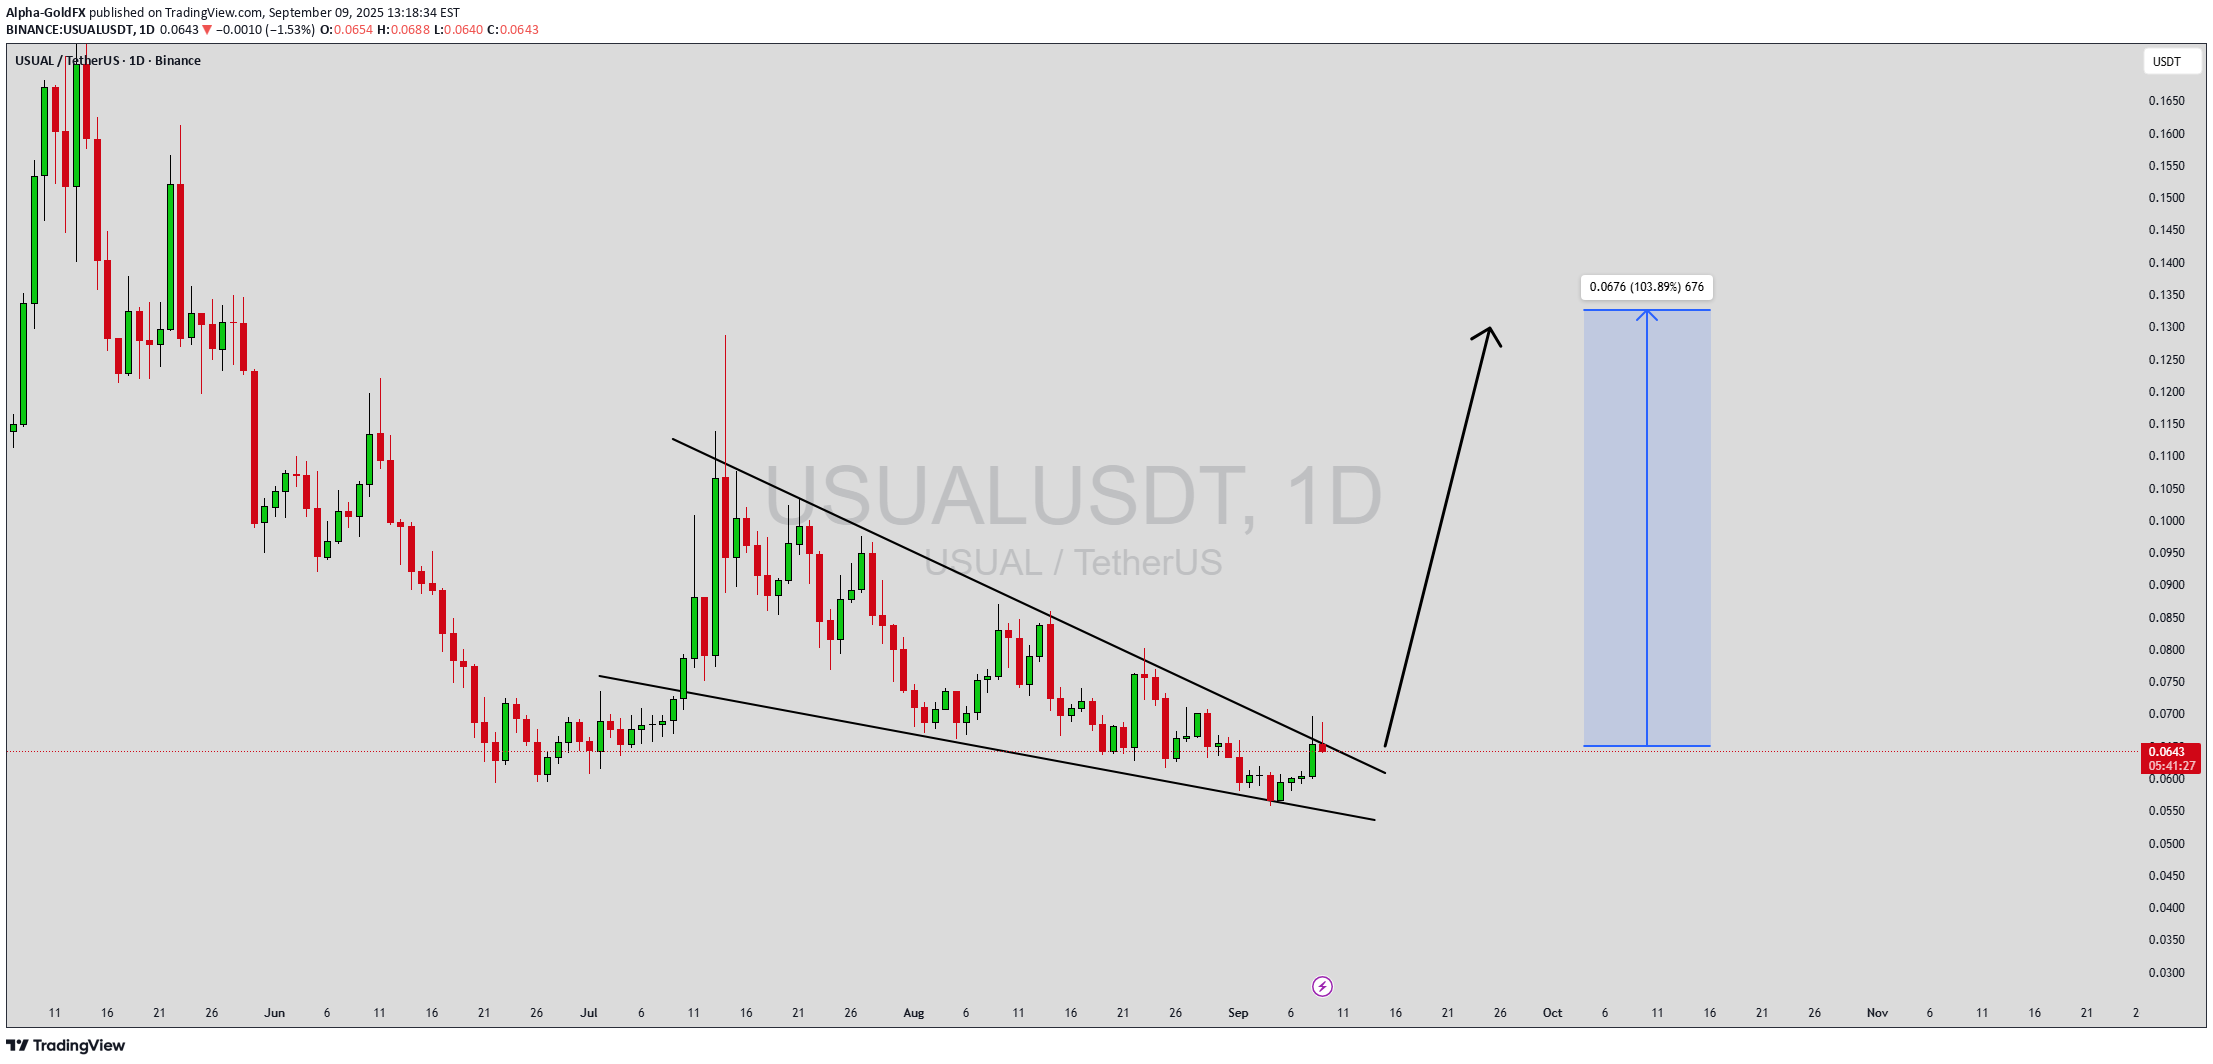
الگوی "گوه نزولی" در USUALUSDT: آیا پامپ صعودی 150 درصدی در راه است؟

USUALUSDT is forming a strong falling wedge pattern, which is widely recognized as a bullish reversal setup in technical analysis. This pattern occurs when price consolidates within narrowing trendlines, eventually leading to a breakout to the upside. The current structure indicates that selling pressure is weakening, while buying momentum is gradually building. With solid trading volume supporting this move, the breakout potential looks very promising. The falling wedge pattern here suggests that USUALUSDT could soon witness a powerful upward surge, potentially delivering gains of 140% to 150%+. Such a setup is attractive to traders and investors who closely follow breakout strategies, as the reward-to-risk ratio looks highly favorable. The volume confirmation adds further confidence, showing that accumulation is already underway in this pair. Market sentiment also appears to be turning positive as more investors are beginning to take interest in this project. If momentum continues in line with technical signals, USUALUSDT may see significant upside in the near term, making it an appealing candidate for both short-term trading opportunities and long-term investment positioning. ✅ Show your support by hitting the like button and ✅ Leaving a comment below! (What is You opinion about this Coin) Your feedback and engagement keep me inspired to share more insightful market analysis with you!

Morningtsar
$USUAL
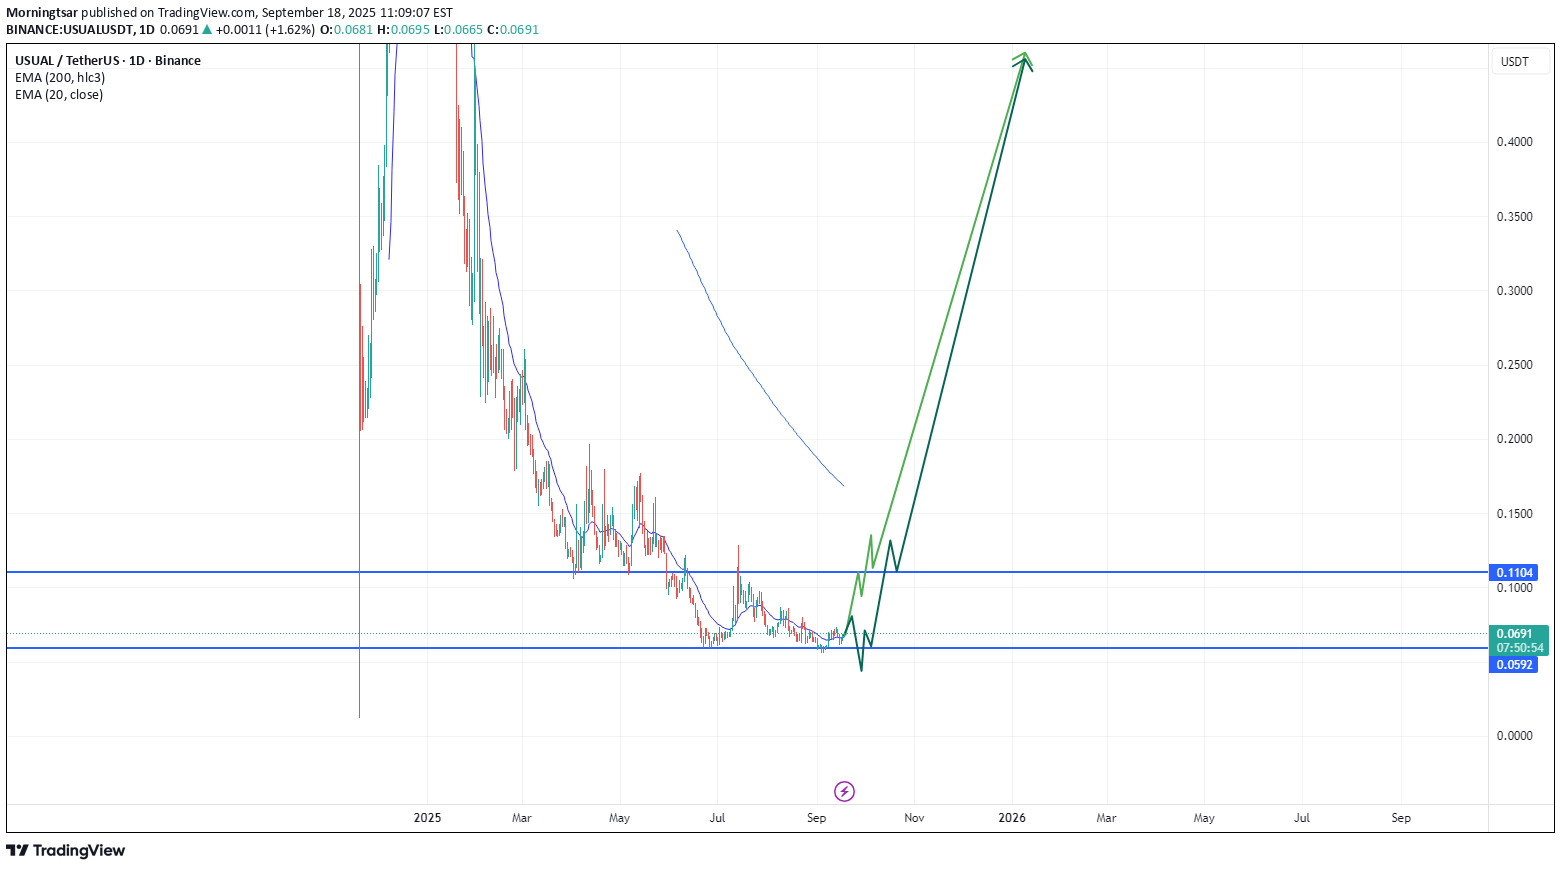
i THINK THIS MAYUBE you know how to take it away from our souls just to see beyond our strength
Alpha-GoldFX
USUALUSDT Forming Falling Wedge
USUALUSDT is currently displaying a falling wedge pattern, one of the most reliable bullish reversal signals in technical analysis. The narrowing price action indicates that selling pressure is fading, while buyers are gradually gaining strength. With trading volume remaining healthy, the setup points toward a potential breakout, with expected gains in the range of 90% to 100% once momentum fully shifts to the upside. This structure often precedes strong rallies as it reflects accumulation by investors who anticipate significant upward movement. In the case of USUALUSDT, market participants are increasingly taking interest, positioning themselves ahead of a potential breakout. The wedge formation highlights the compression of price before expansion, which can fuel rapid gains when resistance is broken. Investor sentiment around this project continues to improve, supported by consistent volume and growing market activity. This alignment of technical signals and investor participation strengthens the likelihood of a bullish move. Traders who monitor this setup closely may find a high-probability opportunity as the breakout level approaches. In conclusion, USUALUSDT has all the elements of a bullish setup, with the falling wedge pattern pointing toward a breakout rally of 90% to 100%. Strong volume support and increasing investor confidence could push this pair into a powerful upward trajectory in the near term. ✅ Show your support by hitting the like button and ✅ Leaving a comment below! (What is You opinion about this Coin) Your feedback and engagement keep me inspired to share more insightful market analysis with you!

Bithereum_io
USUALUSDT 1D
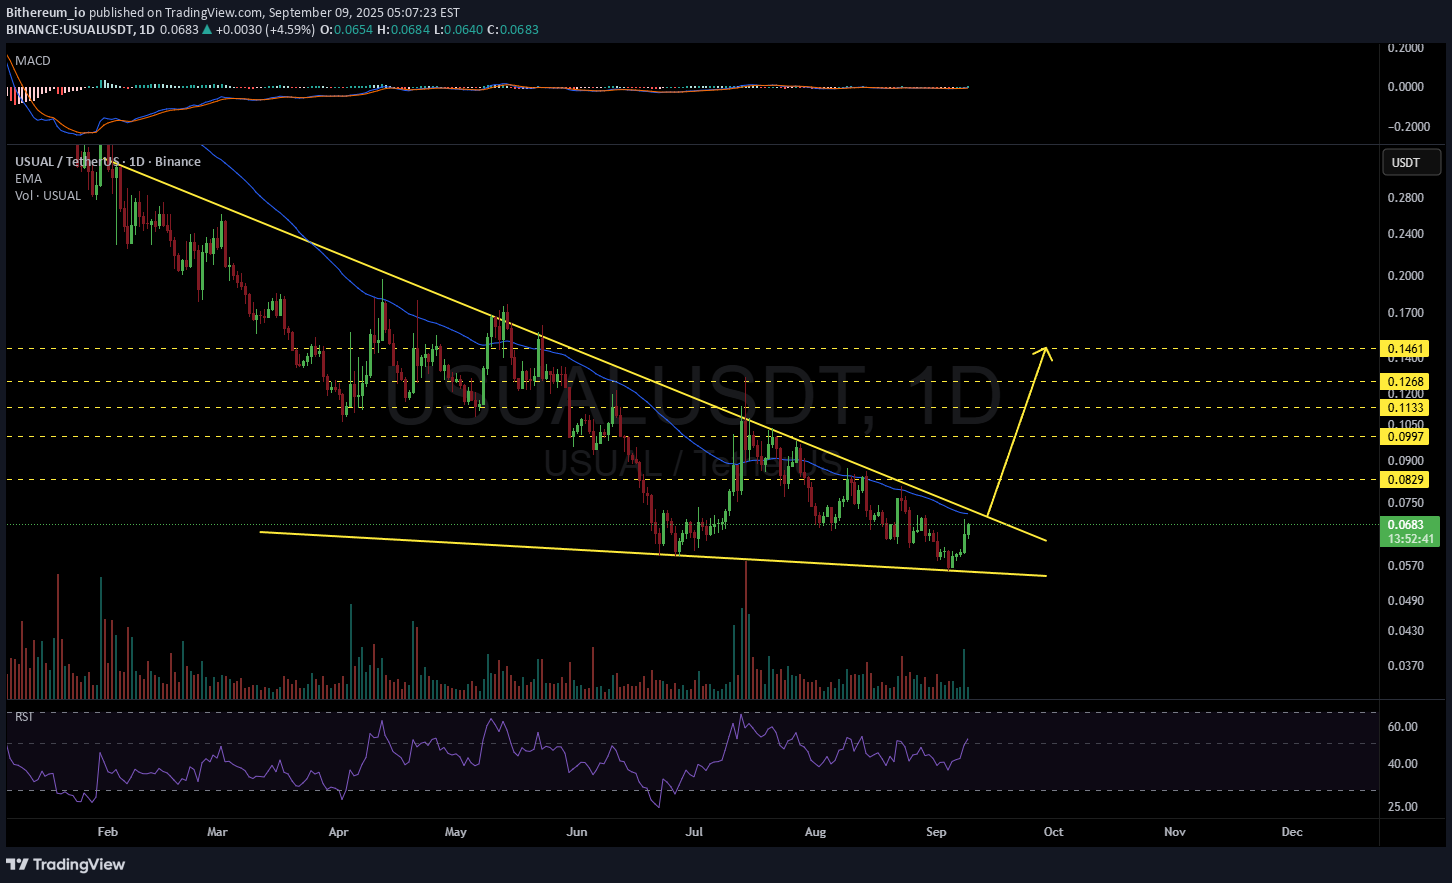
#USUAL is moving within a falling wedge pattern on the daily chart. If it breaks out above the pattern resistance and the daily EMA50, the potential targets are: 🎯 $0.0829 🎯 $0.0997 🎯 $0.1133 🎯 $0.1268 🎯 $0.1461 ⚠️ Always remember to use a tight stop-loss and follow proper risk management.

bakbak88
As usual Another counter is ready
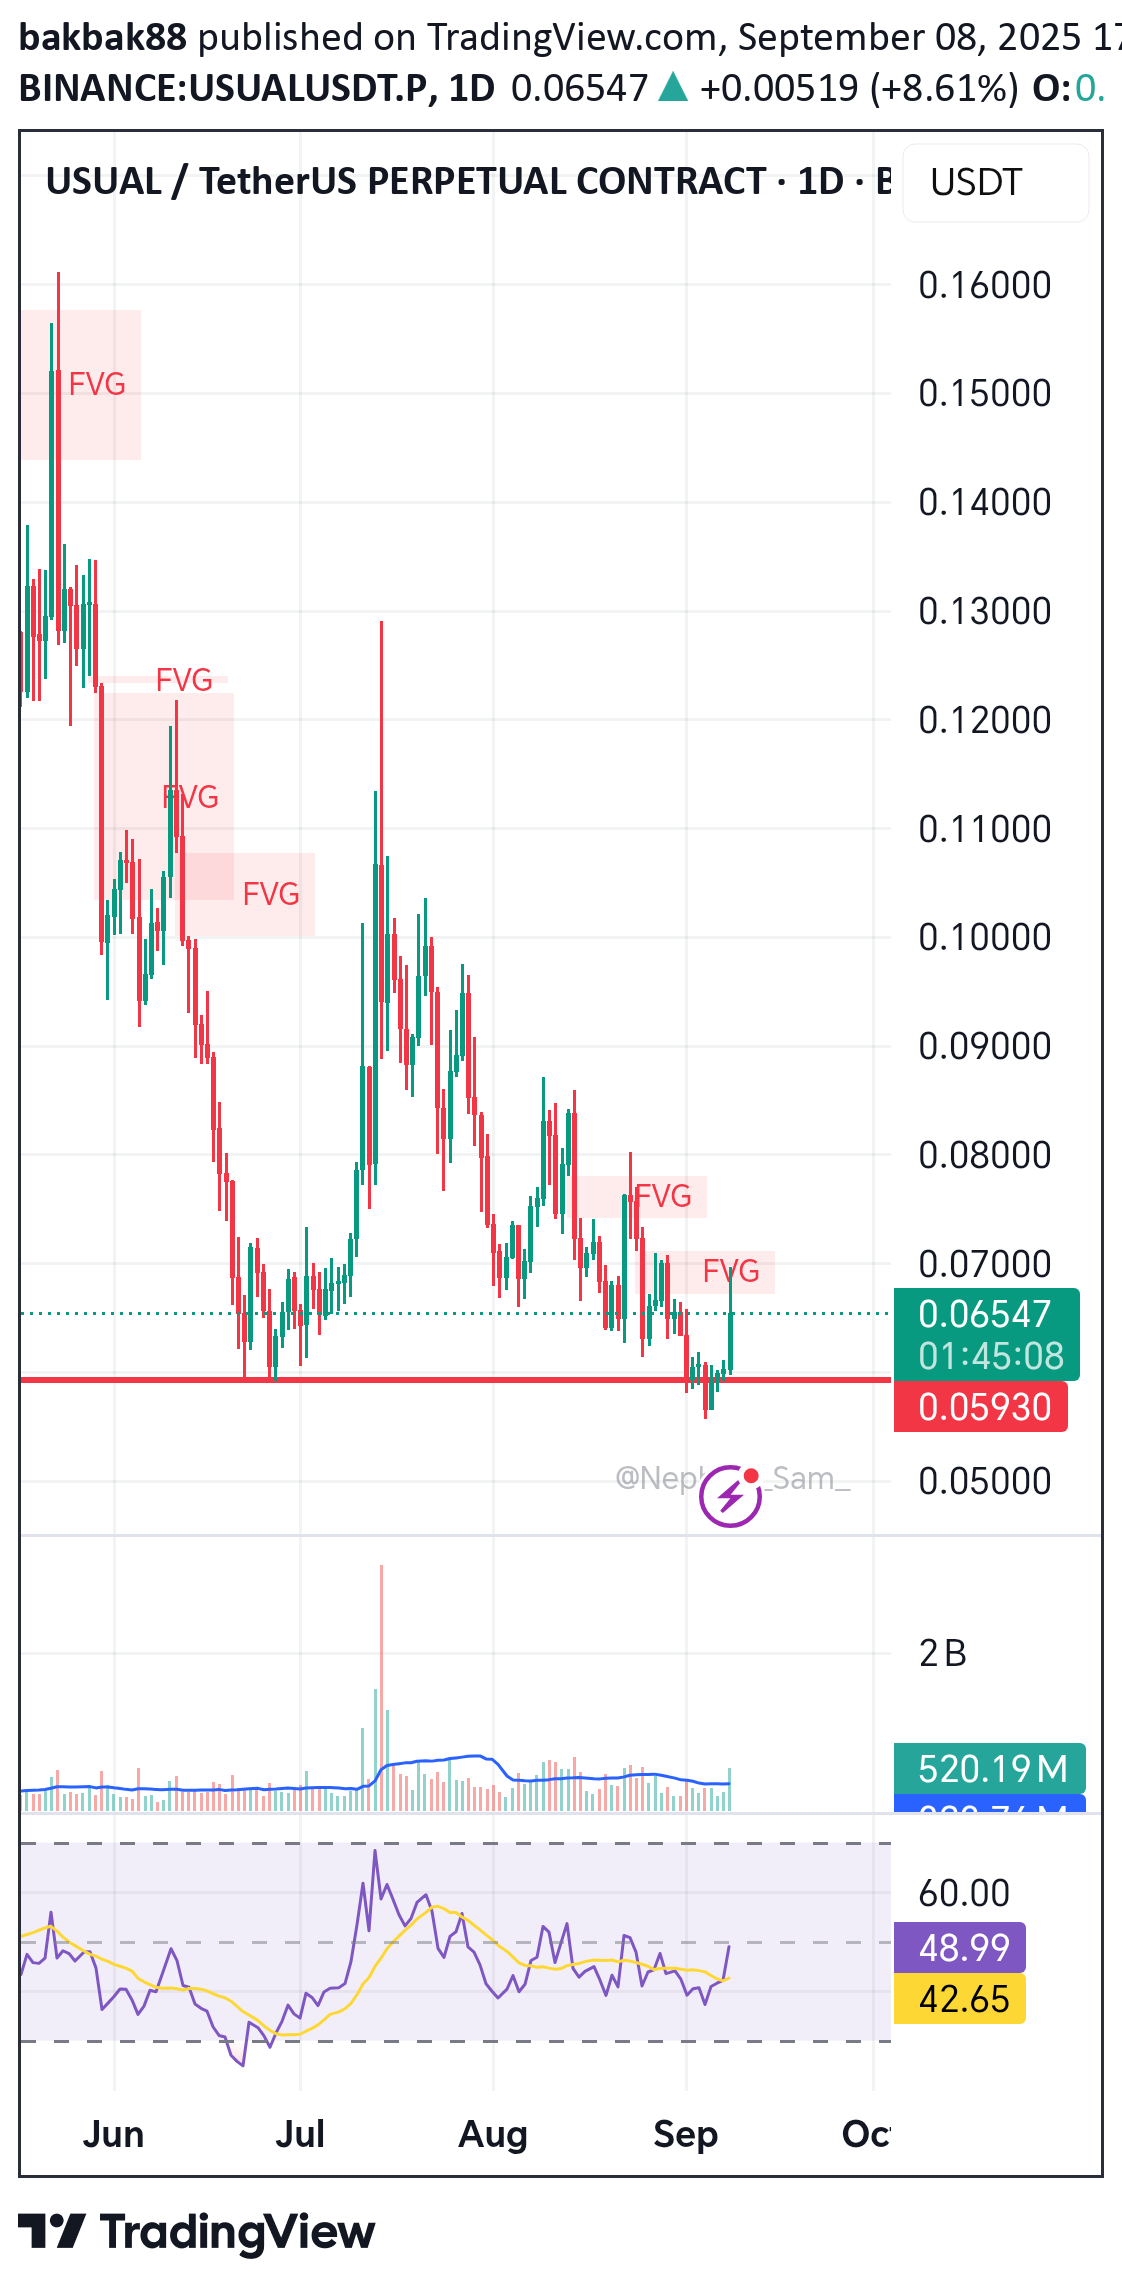
Just completed liquidity sweep. If u missed xny, myx, pengu on last month for wave 1 in elliot wave theory. U should not miss this counter too.
Disclaimer
Any content and materials included in Sahmeto's website and official communication channels are a compilation of personal opinions and analyses and are not binding. They do not constitute any recommendation for buying, selling, entering or exiting the stock market and cryptocurrency market. Also, all news and analyses included in the website and channels are merely republished information from official and unofficial domestic and foreign sources, and it is obvious that users of the said content are responsible for following up and ensuring the authenticity and accuracy of the materials. Therefore, while disclaiming responsibility, it is declared that the responsibility for any decision-making, action, and potential profit and loss in the capital market and cryptocurrency market lies with the trader.