
TRB
Tellor
| تریدر | نوع سیگنال | حد سود/ضرر | زمان انتشار | مشاهده پیام |
|---|---|---|---|---|
No results found. | ||||
Price Chart of Tellor
سود 3 Months :
سیگنالهای Tellor
Filter
Sort messages by
Trader Type
Time Frame

آیا TRB دوباره منفجر میشود؟ تحلیل نمودار و شانس صعود ۵۰ برابری!

There is another possibility... If the crypto is not completely finished and the surprises continue, coins such as COAI, AIA, MYX have reached 50 100 x levels soon. trb Won't an old-established token repeat its old movements once again? graphically possible? We'll see.. It's definitely not investment advice.... It could be a rocket after 50 dollars, in my opinion..

CryptoAnalystSignal
تربیت (TRB/USDT) در آستانه انفجار قیمتی یا فریب بزرگ دیگر؟ تحلیل تکنیکال و اهداف خرید!

#TRB The price is moving within a descending channel on the 1-hour frame, adhering well to it, and is heading for a strong breakout and retest. We have a bearish trend on the RSI indicator that is about to be broken and retested, which supports the upward breakout. There is a major support area in green at 30.00, representing a strong support point. We are heading for consolidation above the 100 moving average. Entry price: 32.00 First target: 33.28 Second target: 34.50 Third target: 36 Don't forget a simple matter: capital management. When you reach the first target, save some money and then change your stop-loss order to an entry order. For inquiries, please leave a comment. Thank you.#TRB First target: 33.28 Reached Second target: 34.50 Reached

Bithereum_io

#TRB is moving inside a falling wedge pattern on the daily chart. We can be bullish if it manages to hold the support zone and break above the wedge resistance and the daily SMA200. In that case, the potential targets are: 🎯 $37.02 🎯 $41.48 🎯 $45.08 🎯 $48.68 🎯 $53.81 🎯 $60.35 ⚠️ Always remember to use a tight stop-loss and follow proper risk management.

CryptoNuclear

TRB (Tellor) is now entering a crucial phase. After the massive rally in 2024, the market has pushed TRB into a structured correction forming a clear descending channel on the weekly timeframe. This chart reflects the ongoing battle between long-term accumulation and medium-term selling pressure. --- 🔎 Technical Structure 1. Descending Channel (Bearish Structure): Price continues to form lower highs & lower lows, confirming sellers remain dominant. The channel can act either as a distribution phase before further breakdown, or a long-term accumulation phase before reversal. 2. Historical Support Zone (13 – 19 USDT): This area has served as a major turning point multiple times since 2021. A breakdown below this level could trigger a capitulation move toward the channel bottom near 9 USDT. 3. Key Resistance (39 – 51 USDT): This is the “first gateway” for bullish validation. A strong breakout here with volume could unlock a rally toward 95 – 124 USDT. 4. Fibonacci / Historical Levels: 95.16 → Strong psychological resistance. 124.00 → Potential major profit-taking zone. 193.51 → Long-term target if a full bullish trend resumes. --- 🚀 Bullish Scenario (Potential Reversal) Confirmation: Weekly close above the descending channel with a successful retest. Targets (Stage 1): 39.07 → 51.53. Targets (Stage 2): 95.16 → 124.00. Narrative: A breakout from the channel signals the end of the long correction, opening the door for buyers to step in aggressively above 51 USDT. --- 📉 Bearish Scenario (Continuation) Confirmation: Strong rejection at the channel upper boundary + breakdown below 30 USDT. Targets (Stage 1): 19 USDT (minor support). Targets (Stage 2): 13 USDT → 9 USDT (channel bottom). Narrative: As long as price remains within the channel, bearish sentiment dominates. A breakdown of historical support means a potential capitulation before the next accumulation cycle. --- 🧭 Trading Strategy Conservative Traders: Wait for a weekly breakout + retest before going long (low risk – high reward). Aggressive Traders: Scale into the 13 – 19 zone with tight stops below 13. Short Traders: Look for rejection at the upper/midline channel for swing shorts targeting support zones. Risk Management: TRB is highly volatile (as seen in 2024) — always cap risk at 1–3% per position. --- 📌 Conclusion TRB is at a major crossroads. While the descending channel still favors the bearish trend, a confirmed breakout would be a game-changer, signaling the end of correction and opening the way toward 95–124 USDT. On the flip side, failure to hold above 30 could drag price back to 13–19 or even 9 USDT. This setup is not just about chart patterns, but also about market psychology: Is TRB ready for long-term accumulation, or is one more leg down still ahead? --- #TRB #TRBUSDT #Crypto #Altcoin #PriceAction #TechnicalAnalysis #DescendingChannel #Breakout #SwingTrading #SupportResistance
Bithereum_io
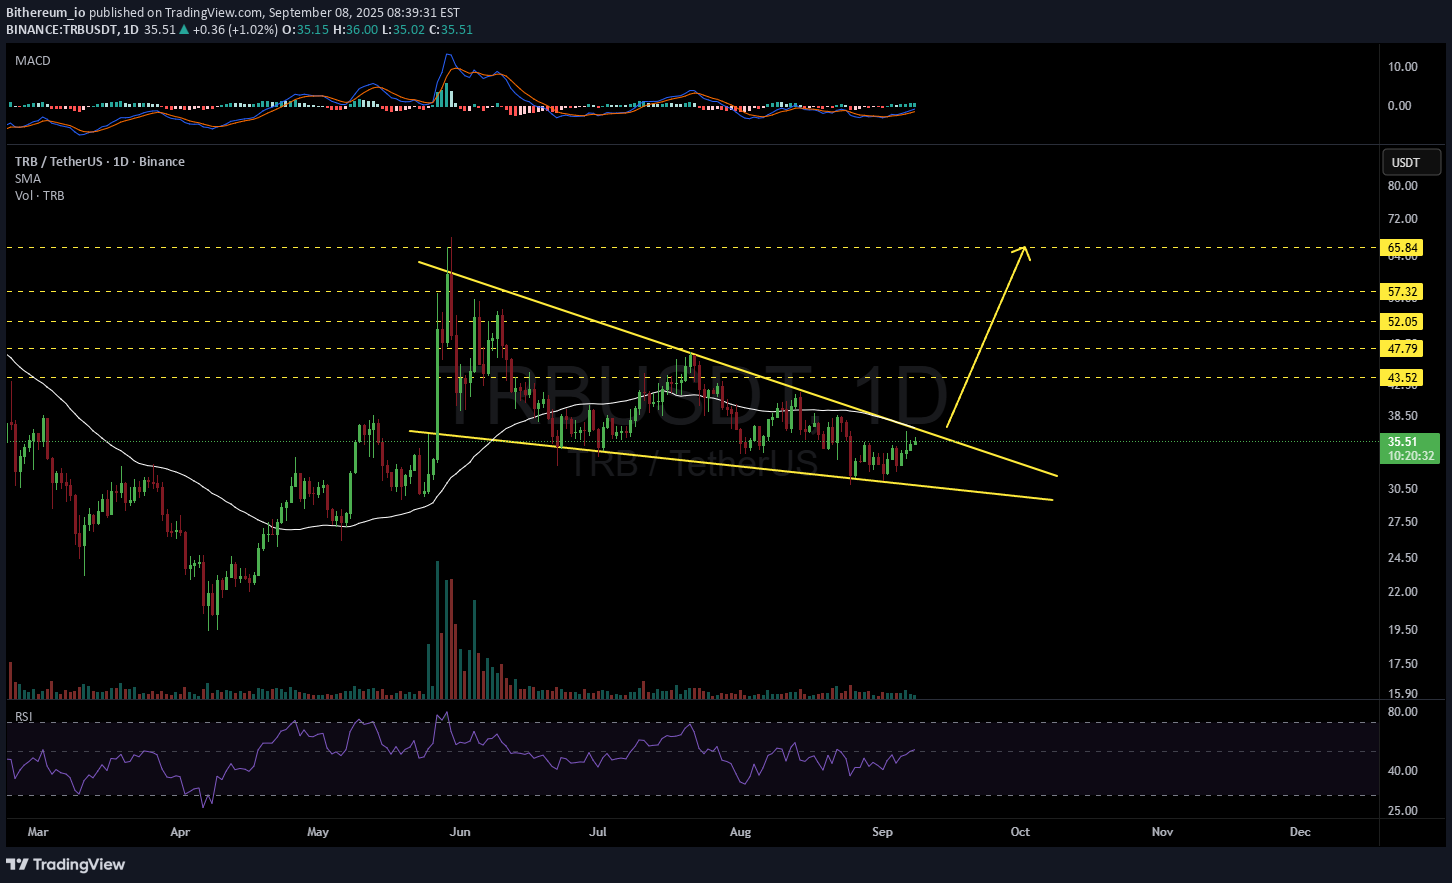
#TRB has formed a falling wedge pattern on the daily chart. If it breaks out above the wedge resistance and the daily SMA50, the targets are: 🎯 $43.52 🎯 $47.79 🎯 $52.05 🎯 $57.32 🎯 $65.84 ⚠️ Always remember to use a tight stop-loss and follow proper risk management.
Bithereum_io
#TRB has formed a falling wedge pattern on the daily chart. If it breaks out above the wedge resistance and the daily SMA50, the targets are: 🎯 $43.52 🎯 $47.79 🎯 $52.05 🎯 $57.32 🎯 $65.84 ⚠️ Always remember to use a tight stop-loss and follow proper risk management.

MyCryptoParadise
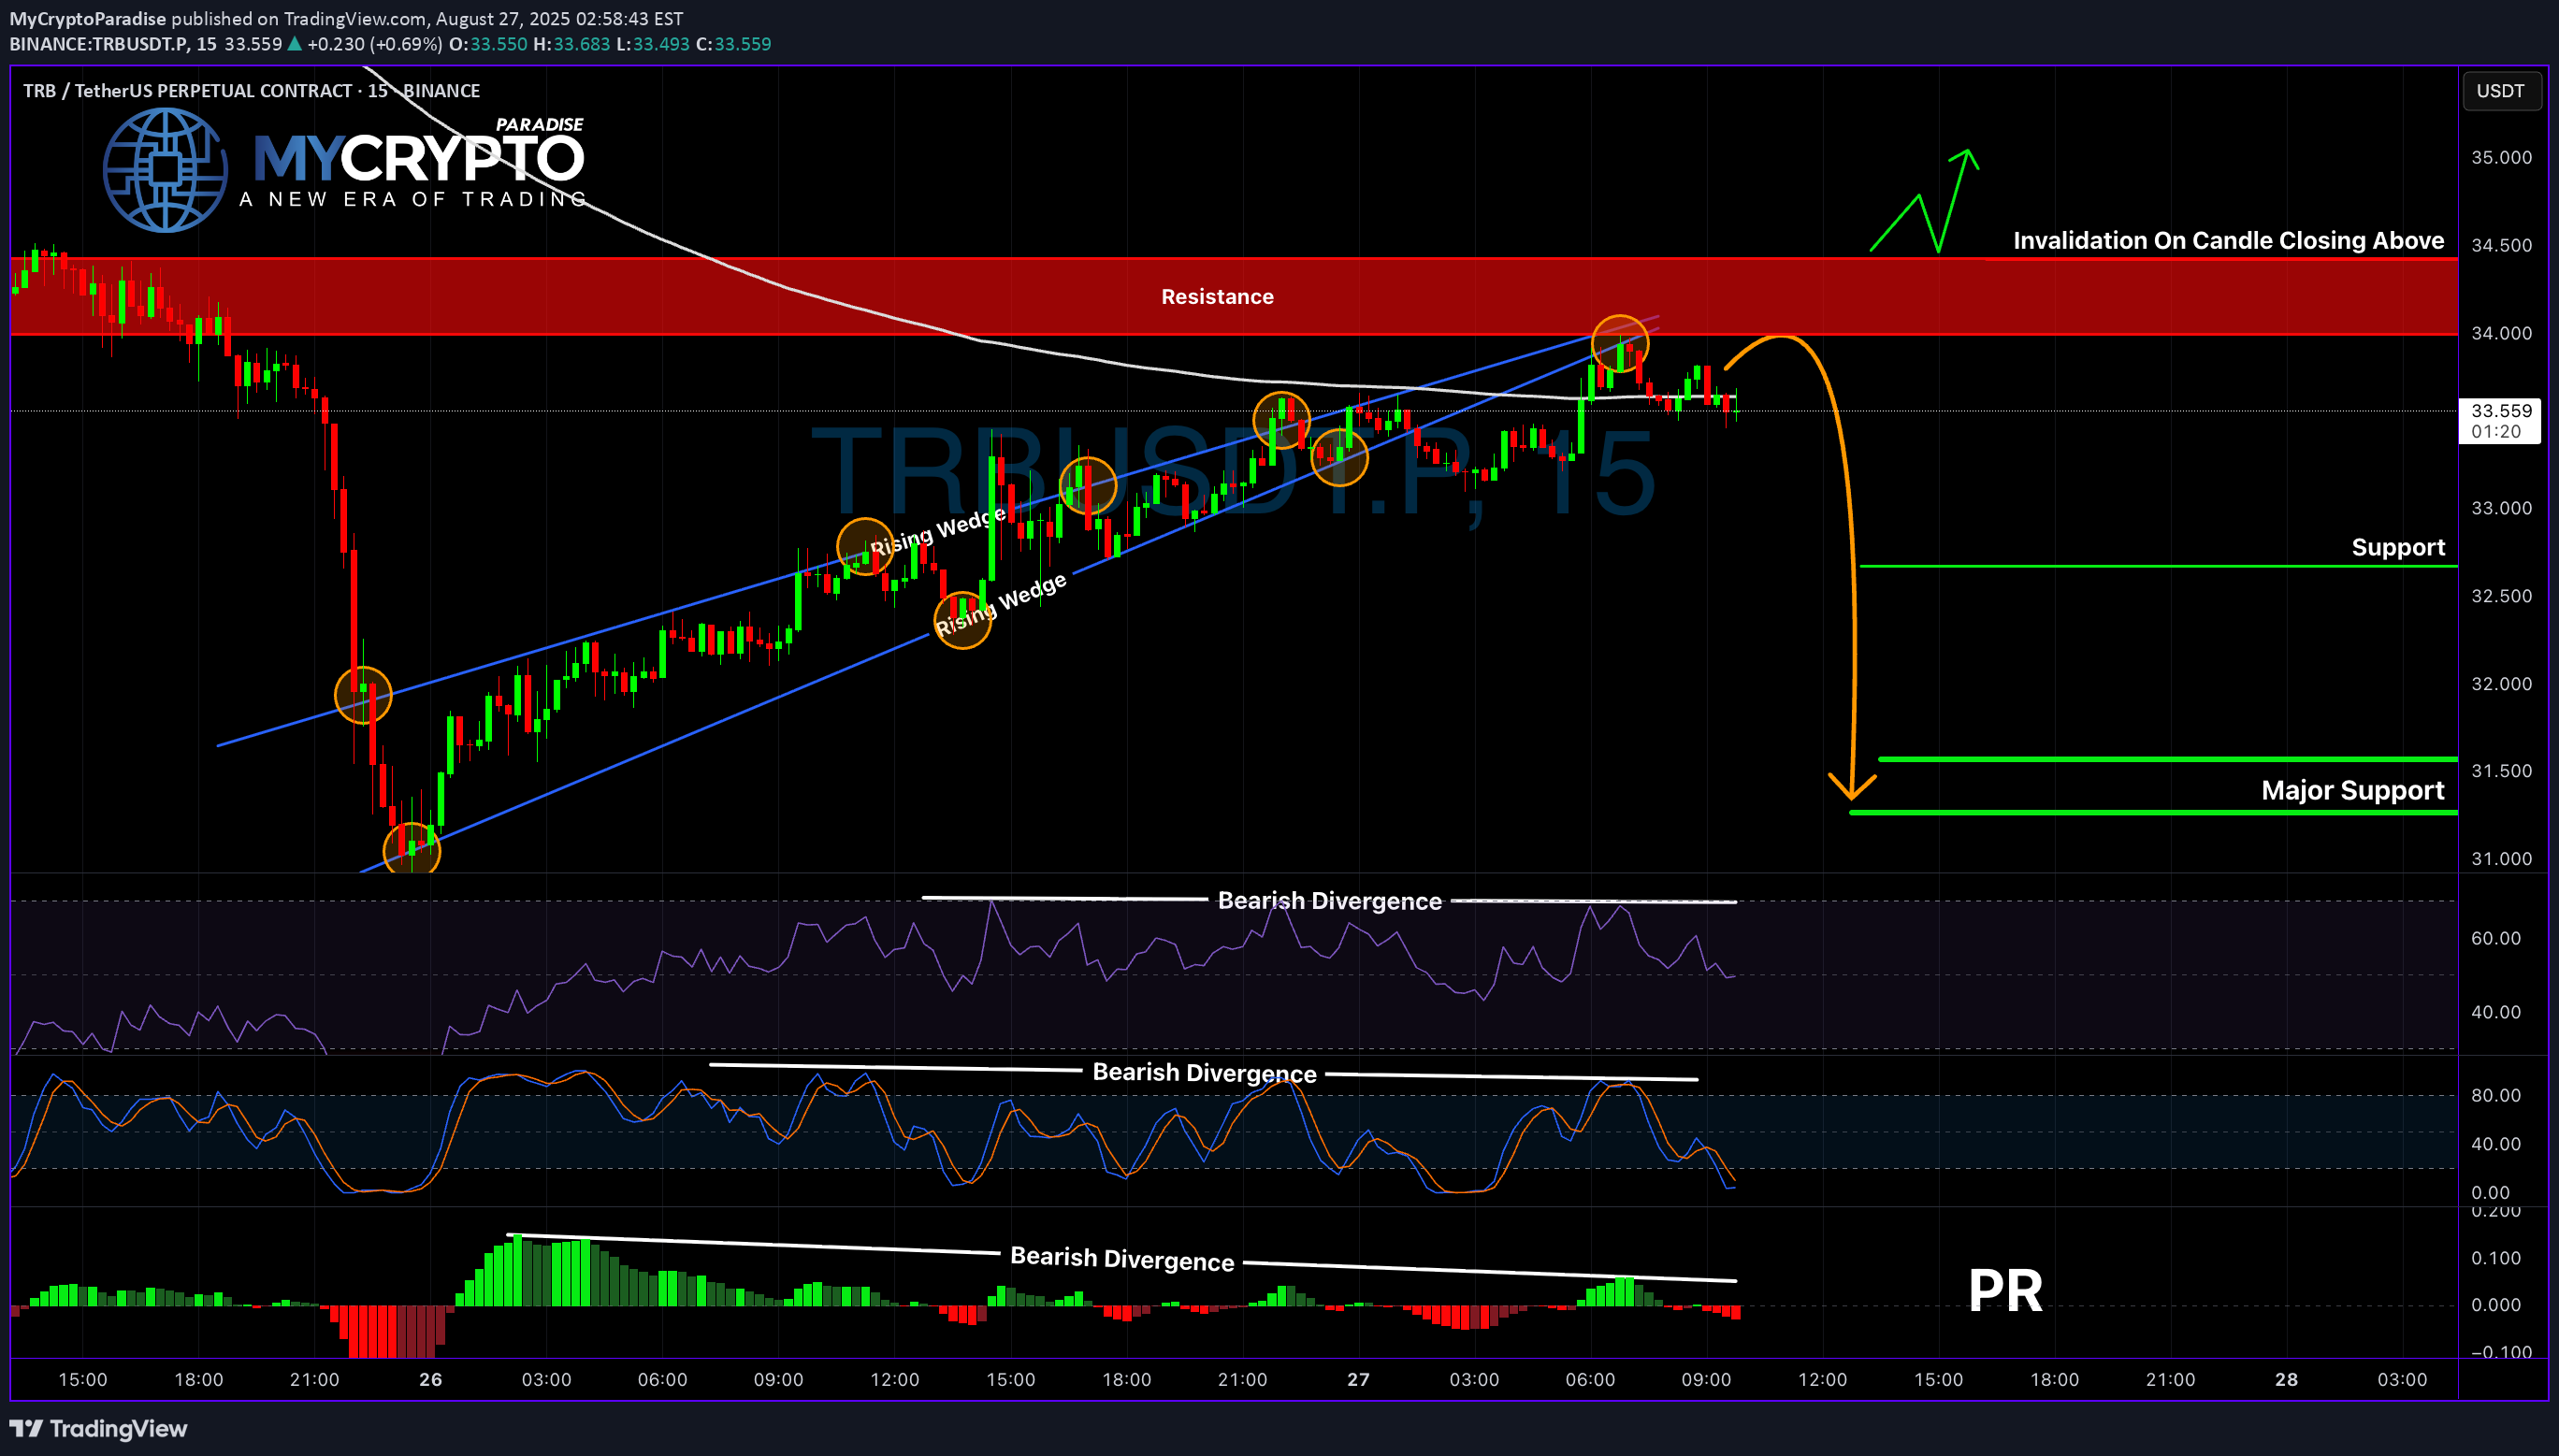
Yello Paradisers, are you ready for the next big move on TRB? This chart is flashing some serious warning signs that most traders will completely ignore until it’s too late. Let’s break it down before the market makes its move. 💎TRBUSDT has broken down from a rising wedge pattern and retested the resistance zone near the 200 EMA. At the same time, there are bearish divergences showing on the Stoch RSI, RSI, and the MACD histogram. When these signals align, the probability of a bearish move increases significantly, and traders need to be extra cautious. 💎Aggressive traders could already be thinking about entering from the current levels. However, this setup only offers a 1:1 risk-to-reward ratio, which is not ideal for long-term consistent profitability. Entering too early without a solid edge often leads to frustration and unnecessary losses. 💎For those aiming to trade more safely, it is better to wait for a pullback followed by confirmation from a bearish candle. This will provide a stronger risk-to-reward profile and also help maintain discipline in the long run. Protecting capital and choosing only high-quality setups is what separates professionals from amateurs. 💎That being said, if the price breaks out and closes above the invalidation level, then the bearish outlook will be completely invalidated. In that case, flexibility is key, and adjusting to what the market gives us is the only way to stay ahead. 🎖Patience and discipline remain the foundation of trading success. Avoid the temptation of low-probability trades, think strategically, and always protect your capital. This is the only way to last long enough in the market to reap the real rewards. MyCryptoParadise iFeel the success🌴
MyCryptoParadise

Yello Paradisers! Is TRBUSDT quietly setting up for a bullish breakout, or is it luring in early buyers before a harsh reversal? With price action unfolding near a key support zone, hidden bullish divergence forming, and the structure still technically intact, it’s time we pay close attention before making any decisions. 💎Currently, TRBUSDT remains in a bullish market structure and is trading near an important support area. Price action is also following a well-defined resistance trendline, which continues to limit upside moves. The presence of hidden bullish divergence suggests potential underlying strength, and this area could act as a springboard for the next move up. However, the lack of volume and broader market indecision means this is a zone where both opportunity and risk are high. 💎Given this context, consolidation is very likely here. For more conservative traders, it would be wise to stay patient and let the structure play out before entering. This is not the time to rush into trades without confirmation. For more aggressive traders, there may be intraday opportunities around this support zone, particularly on lower timeframes, but this approach requires strict risk management. Beginners are strongly advised to avoid trading on lower timeframes at this stage, as the price action remains highly reactive and misleading moves can occur easily. 💎If the price builds a fresh bullish structure from this level, it would significantly increase the probability of continued upside. The current zone also offers favorable risk-to-reward potential, with setups delivering more than a 1:3 ratio. That said, if the price breaks down and closes candle below the defined invalidation zone, our bullish outlook becomes invalid. In that case, the best course of action would be to step aside and wait for a new structure to form, rather than trying to force entries in uncertain conditions. 🎖Strive for consistency, not quick profits. Treat the market as a businessman, not as a gambler. Stay focused on high-probability setups, protect your capital, and let the market come to you. That’s the only path to long-term success in this game. MyCryptoParadise iFeel the success🌴
MyCryptoParadise
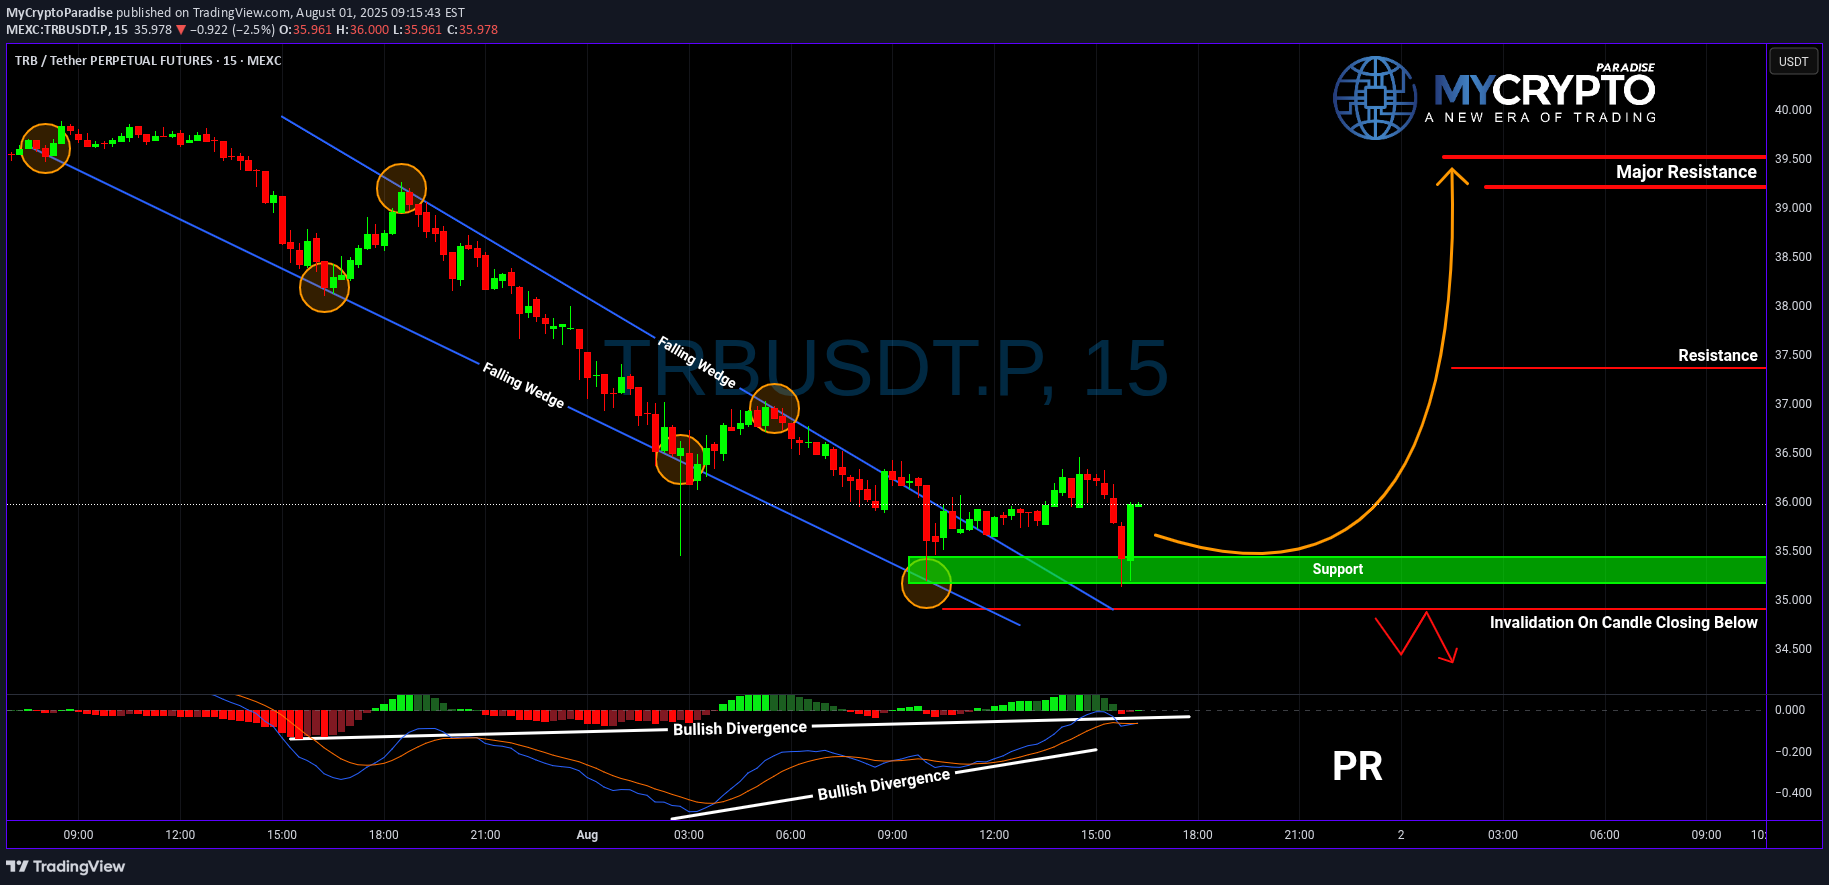
Yello Paradisers! After weeks of quiet price action, is TRBUSDT finally gearing up for a real breakout—or is this just another trap before the next leg down? Let’s break it all down, because the next move could catch many traders on the wrong side. 💎TRBUSDT has recently broken out of a falling wedge pattern, accompanied by a clear bullish divergence—an encouraging sign that momentum may be shifting in favor of buyers. This type of setup historically carries a higher probability of a bullish move, especially if the breakout holds above key support levels. However, the entry strategy here is critical. 💎Ideally, we want to see a minor pullback. If that happens, it could offer a solid bounce opportunity from well-defined support zones, giving a favorable risk-to-reward setup. This is the scenario where patient traders will find the highest probability entries. On the other hand, aggressive traders might consider entering from current levels, but they must understand that doing so offers a less favorable risk-to-reward ratio. Jumping in too early without a clear confirmation could expose you to unnecessary risk, especially if the market reverses quickly. 💎More importantly, we have a clearly defined invalidation level. If TRBUSDT breaks below that level and closes a candle beneath it, this would invalidate the current bullish setup completely. In such a case, the best course of action would be to step aside and wait for a new structure or more reliable price action to form. Forcing trades in uncertain territory is how capital is lost and confidence shaken. Strive for consistency, not quick profits. Treat the market as a businessman, not as a gambler. Protecting your capital and waiting for high-probability opportunities is what separates professional traders from the rest. Patience here could be the difference between a calculated win and a costly mistake. MyCryptoParadise iFeel the success🌴
Disclaimer
Any content and materials included in Sahmeto's website and official communication channels are a compilation of personal opinions and analyses and are not binding. They do not constitute any recommendation for buying, selling, entering or exiting the stock market and cryptocurrency market. Also, all news and analyses included in the website and channels are merely republished information from official and unofficial domestic and foreign sources, and it is obvious that users of the said content are responsible for following up and ensuring the authenticity and accuracy of the materials. Therefore, while disclaiming responsibility, it is declared that the responsibility for any decision-making, action, and potential profit and loss in the capital market and cryptocurrency market lies with the trader.