
SLP
Smooth Love Potion
| تریدر | نوع سیگنال | حد سود/ضرر | زمان انتشار | مشاهده پیام |
|---|---|---|---|---|
 MadWhaleRank: 30076 | خرید | حد سود: تعیین نشده حد ضرر: تعیین نشده | 1/6/2026 | |
 MMBTtraderRank: 31478 | خرید | حد سود: تعیین نشده حد ضرر: تعیین نشده | 1/6/2026 |
Price Chart of Smooth Love Potion
سود 3 Months :
سیگنالهای Smooth Love Potion
Filter
Sort messages by
Trader Type
Time Frame
MadWhale
SLP to the mooooon 50% gain toward 0.0013$

hi soon the SLPUSDT will breakout the descending channel to the upside and explosion will come true i can see at least 50% gain toward 0.0013$ for the price
MMBTtrader
SLP Warning: the channel is broken heavy pump soon

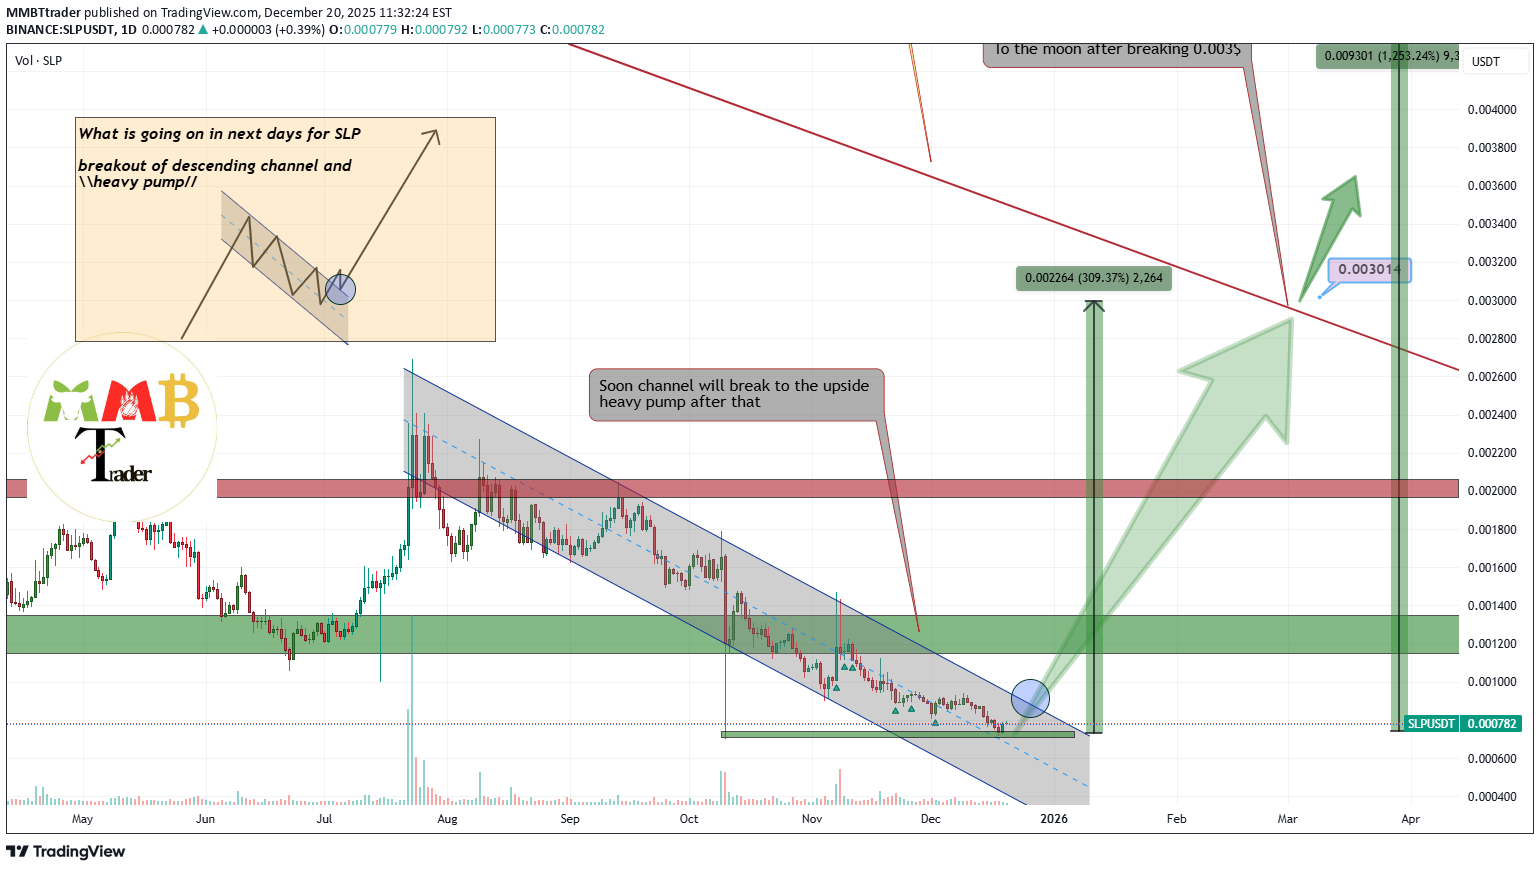
Market Analysis: Breakout Confirmation & Reversal Thesis
The technical structure has undergone a significant shift. As observed, the major resistance on the daily timeframe has now been decisively broken.
The preceding move to a new All-Time Low (ATL) is now interpreted as a conclusive liquidity sweep and stop-hunting event. This action likely flushed out weak longs and trapped overly eager shorts, creating a vacuum for a powerful reversal.
With this validated breakout from a major compression zone and the likely exhaustion of sell-side liquidity, the conditions are set for a strong counter-trend rally. The measured move from the breakout point suggests a technical objective with a potential magnitude of +300% is now in play, targeting the next major resistance confluence.
DISCLAIMER: ((trade based on your own decision))
<
MMBTtrader
سیگنال انفجار قیمت SLPUSDT: آیا رشد 3 برابری در راه است؟

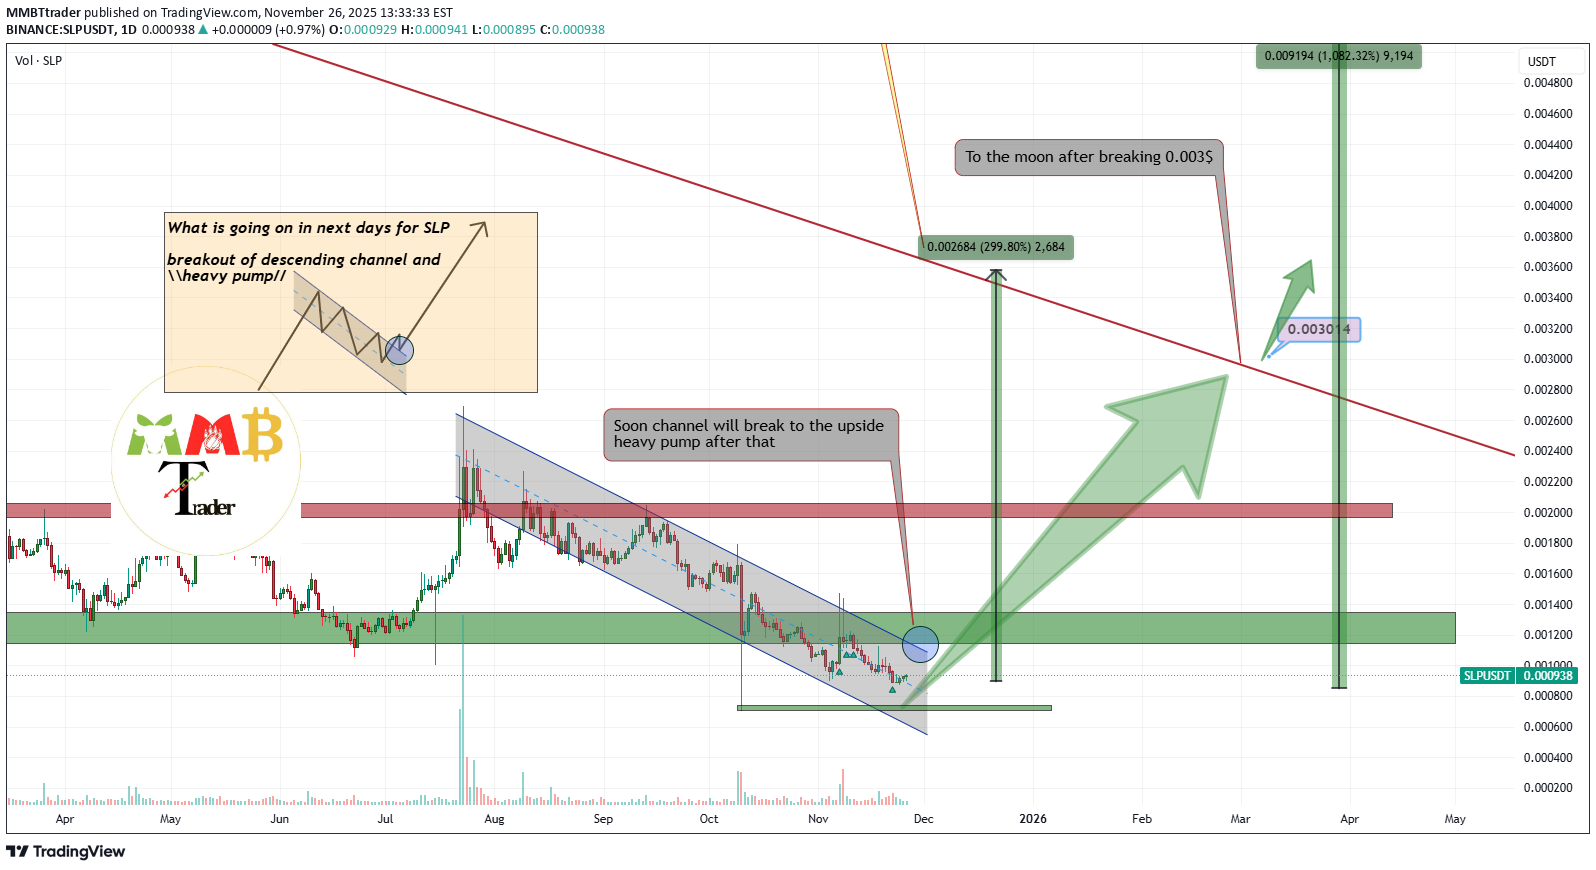
SLPUSDT is currently trading near a major daily support zone while simultaneously approaching a significant resistance confluence, consisting of both the upper channel boundary and a key descending trendline. A decisive daily close above this combined resistance zone, particularly with a noticeable increase in trading volume, would signal a strong bullish breakout.
In such a scenario, the measured move from the breakout level could project an initial upside target in the range of a 2x–3x advance, with potential for further continuation depending on sustained momentum and market structure alignment.
DISCLAIMER: ((trade based on your own decision))
<
MMBTtrader
فوری: سیگنال انفجار قیمت SLP؛ آیا پامپ 300 درصدی در راه است؟
The current price action of SLP reflects a prolonged bearish trend, with the token consistently establishing new all-time lows—a dynamic that has understandably resulted in a significant portion of holders facing unrealized losses. From a technical perspective, this extended decline may also be viewed as a potential basing or accumulation phase, often preceding a strong reversal.
The key technical development to monitor is a decisive
breakout above the prevailing descending trendline
. Such a breakout, confirmed by a sustained increase in buying volume, would be the first strong signal of a
potential trend reversal
.
In this scenario, the initial measured move could project a rally in the vicinity of +300%. Should momentum accelerate further following a successful breakout, the structure of such a basing pattern could support longer-term projections of
5x to 6x gains
. However, these more ambitious targets are contingent on a sustained shift in market structure and continued strong buyer participation.
DISCLAIMER: ((trade based on your own decision))
<
MMBTtrader
SLPUSDT: پتانسیل انفجاری ۱۰ برابری از کف قیمت؛ فرصتی که نباید از دست داد!

As consistently highlighted in previous analyses, the current price zone near the all-time low of $0.0008 represents what we assess to be a long-term accumulation area for SLPUSDT. This level is further supported by the token’s extended basing structure and historically oversold conditions.
A decisive breakout above the prevailing channel resistance would signal the completion of this accumulation phase and likely initiate a strong bullish impulse. Given the depth and duration of the historical basing pattern, a measured upside projection suggests the potential for a 10x appreciation from current levels, aligning with the scale of momentum typically observed after prolonged consolidation in low-market-cap assets.
DISCLAIMER: ((trade based on your own decision))
<
MadWhale
انفجار SLP در راه است: ۳۰٪ سود تا رسیدن به ۰.۰۰۱۱۶۵ دلار!

Hi the support and resistances on the chart are based on the previous data and weekly candlesticks if SLPUSDT holds this last support the potential of 30% gain is logical toward 0.001165$
MMBTtrader
پمپ انفجاری ۳۰۰ درصدی SLPUSDT در راه است؛ تحلیل تکنیکال غافلگیرکننده!
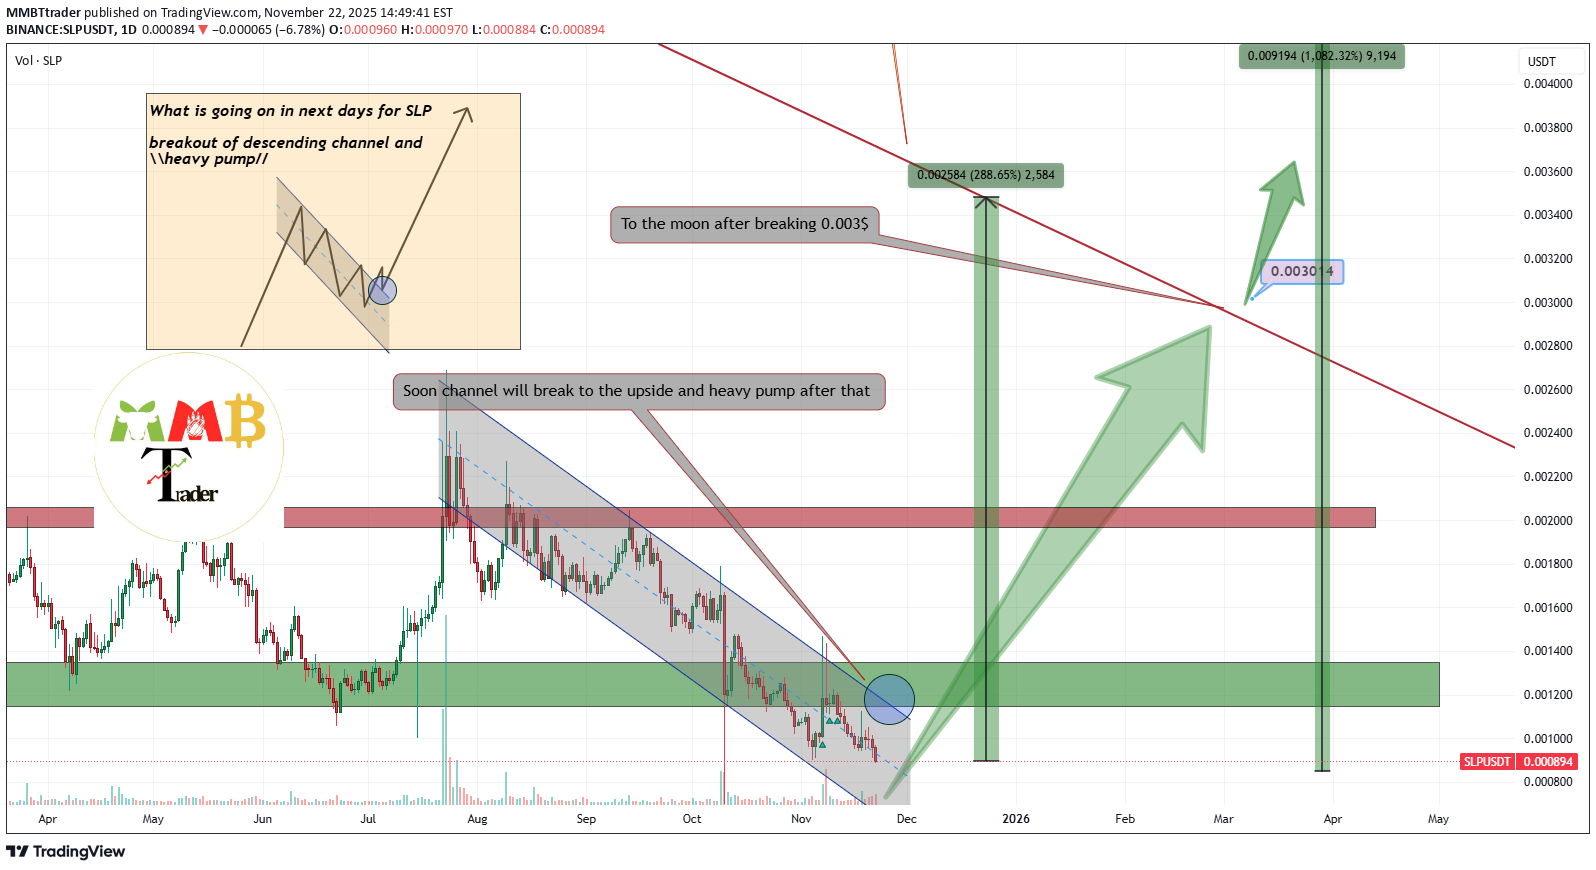
As previously outlined in our technical analysis, SLPUSDT is demonstrating strength at a significant confluence zone, combining both a major daily support level and the lower boundary of its prevailing trading channel. The current bullish reaction from this strategic area suggests a potential reversal of prior downward momentum.
We are now monitoring for a decisive breakout above the channel's resistance, which would signal a structural shift in market dynamics. Should this occur with supporting volume, it could initiate a substantial upward impulse. Based on the technical structure, our initial projected target represents approximately 300% appreciation from current levels, with potential for extended gains should momentum persist beyond this initial objective.
DISCLAIMER: ((trade based on your own decision))
<

Bithereum_io
تحلیل SLP/USDT: آیا طلسم گوه صعودی شکسته میشود؟ (اهداف جدید مشخص شد)
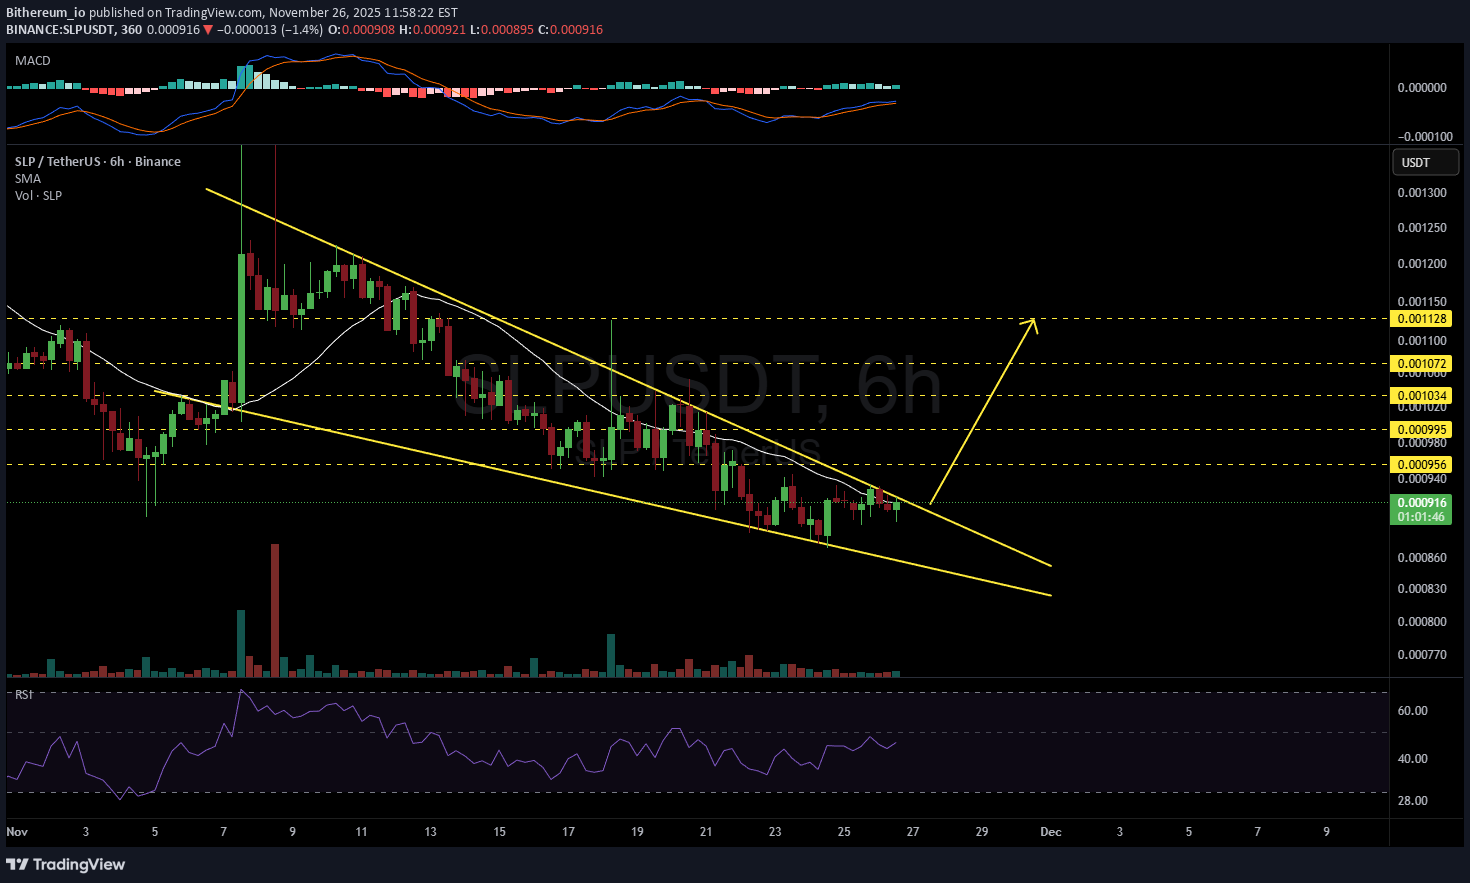
#SLP is moving inside a falling wedge on the 6H timeframe and is currently facing both the SMA21 and the wedge resistance. Consider entering this coin only after a solid breakout above both resistance levels. If that breakout confirms, the potential targets are: 🎯 $0.000956 🎯 $0.000995 🎯 $0.001034 🎯 $0.001072 🎯 $0.001128 ⚠️ Always remember to protect your capital with a proper stop-loss and disciplined risk management.
MMBTtrader
آماده پامپ 300 درصدی SLPUSDT؟ شکست خط مقاومت چند ساله!
SLPUSDT presents a compelling technical setup with significant potential. After an extended bearish period spanning multiple years, the token is now approaching a critical technical juncture. The daily chart shows the asset consolidating near the upper boundary of its long-term trading channel.
A decisive breakout above this channel resistance, particularly when accompanied by substantial volume confirmation, could signal the completion of the accumulation phase and mark the beginning of a new bullish cycle. Based on the depth and duration of the preceding basing pattern, technical projections suggest a potential appreciation target of 300% or more upon successful channel breakout validation.
DISCLAIMER: ((trade based on your own decision))
<

ICTTRADER2024
تحلیل SLP/USDT با پرایس اکشن ICT: منتظر نقدینگی بازار در قیمت ۰.۰۰۶۵۵ دلار بمانید!

Against the buyside liquidity on the top price 0.00655$ the price going on to market makers reaching to the liquidity of slp please wait and be patient to get to a good profit 🙏 The market is a space that money moving from Hasty person's to patient person's....good luck..
Disclaimer
Any content and materials included in Sahmeto's website and official communication channels are a compilation of personal opinions and analyses and are not binding. They do not constitute any recommendation for buying, selling, entering or exiting the stock market and cryptocurrency market. Also, all news and analyses included in the website and channels are merely republished information from official and unofficial domestic and foreign sources, and it is obvious that users of the said content are responsible for following up and ensuring the authenticity and accuracy of the materials. Therefore, while disclaiming responsibility, it is declared that the responsibility for any decision-making, action, and potential profit and loss in the capital market and cryptocurrency market lies with the trader.