
SKL
SKALE Network
| تریدر | نوع سیگنال | حد سود/ضرر | زمان انتشار | مشاهده پیام |
|---|---|---|---|---|
 Alpha-GoldFXRank: 2237 | خرید | حد سود: ۰٫۰۳۱۳۹ حد ضرر: تعیین نشده | 10/15/2025 |
Price Chart of SKALE Network
سود 3 Months :
سیگنالهای SKALE Network
Filter
Sort messages by
Trader Type
Time Frame

god_of_robots
توزیع باورنکردنی توکن SKL: چه کسی مالک اصلی است و چرا این خوب است؟
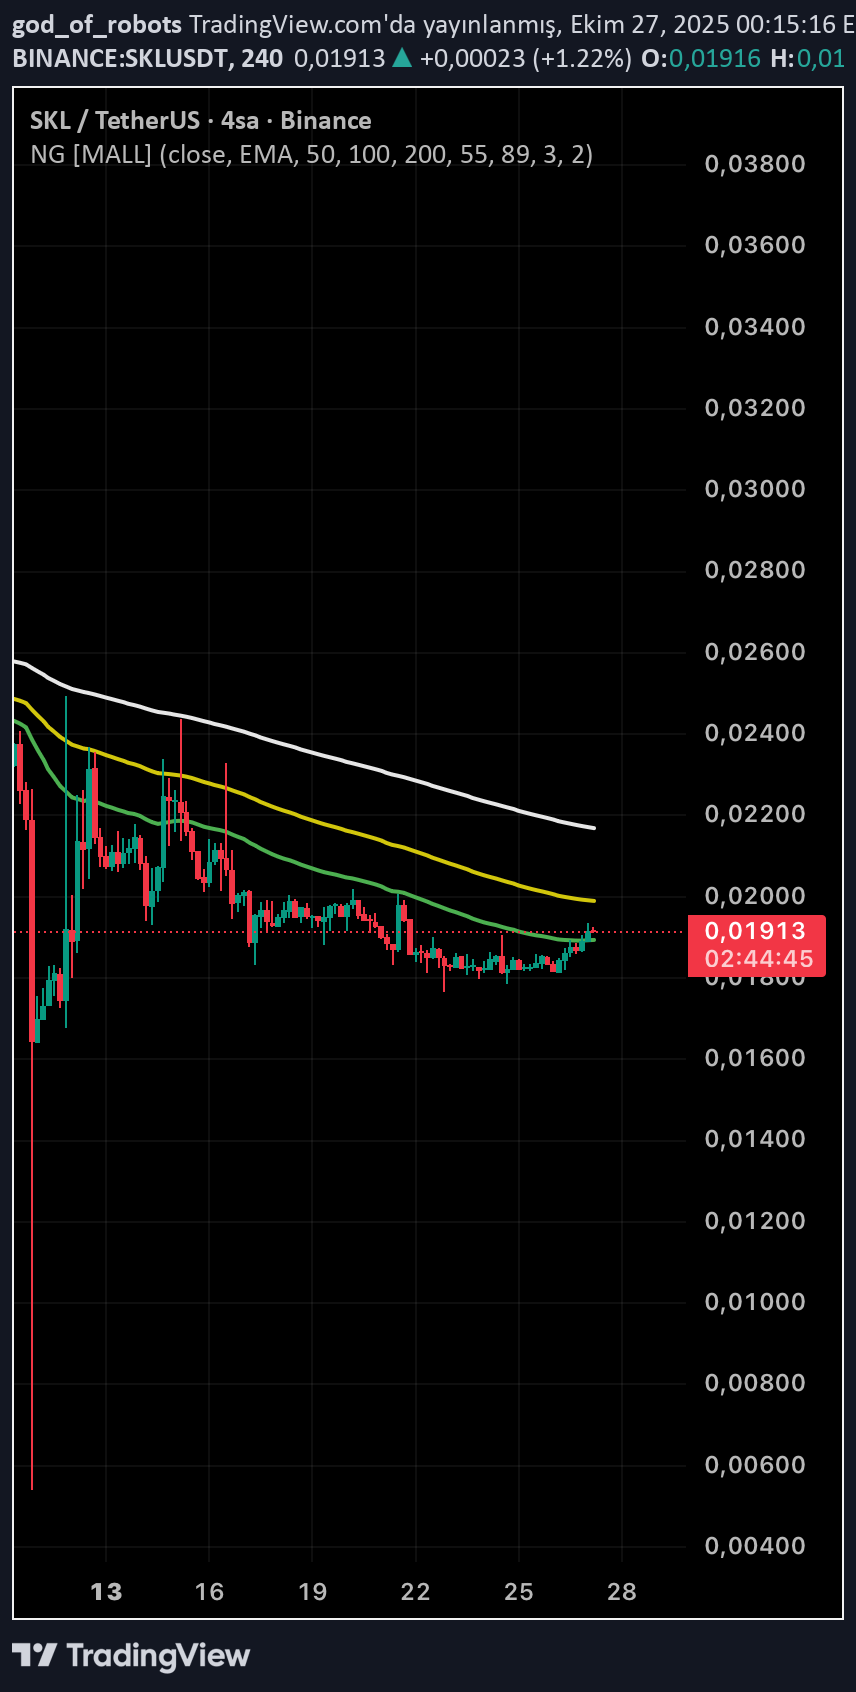
Ownership distribution of SKL (SKALE) token According to the data: •Total number of owners: 30,102 •Total share of the top 10 wallets: 30.49% •All other owners (small investors): 69.50% That is, approximately two-thirds of the SKL token is in the hands of the public, and the rest is in the accounts of large investors (whale or project wallet). Total share of the top 3 wallets: •7.17% + 3.69% + 3.59% = 14.45% This means that only the top 3 wallets control approximately 15% of the SKL supply. In general, concentration below 30% is considered quite balanced; In this case, SKL's ownership distribution is not bad, it can be considered moderately centralized
Alpha-GoldFX
سیگنال انفجاری SKL: الگوی گوه نزولی نویدبخش رشد ۹۰ درصدی!
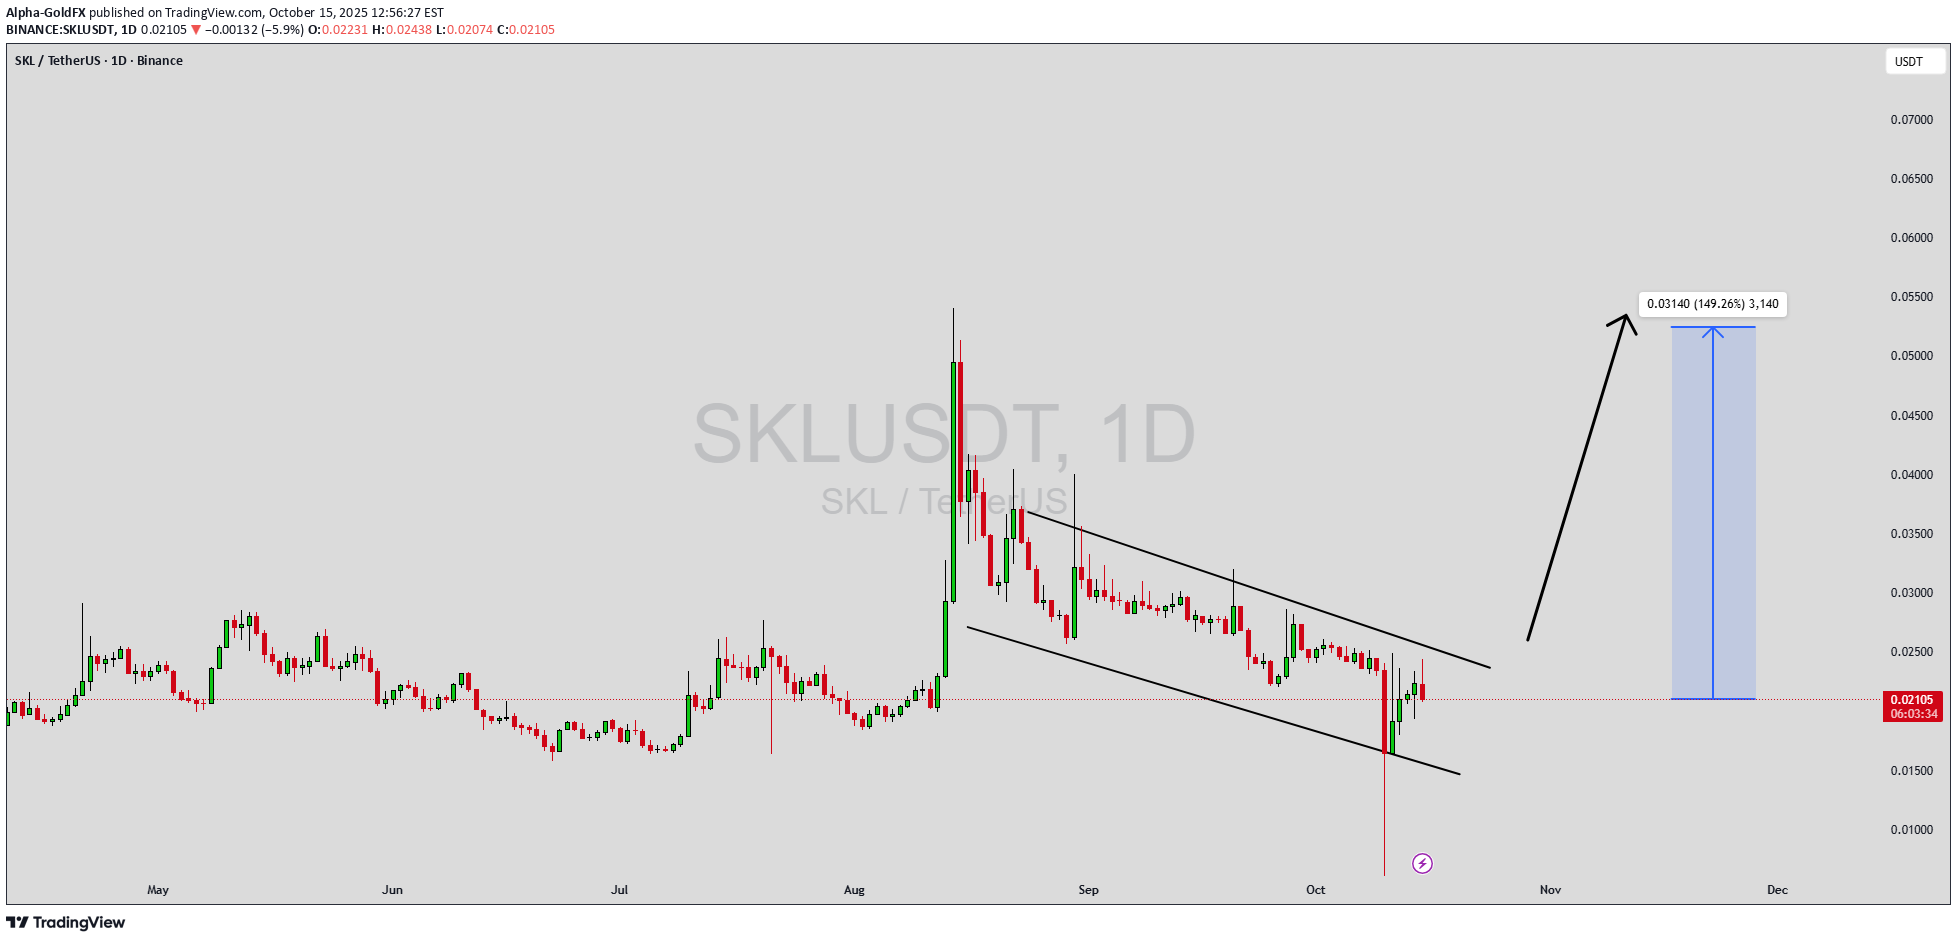
SKLUSDT is forming a falling wedge patter, a classic bullish reversal setup that signals potential trend change after a sustained downtrend. The pattern is tightening, showing that selling pressure is weakening while buyers are gradually stepping in. The good trading volume further supports the likelihood of a strong breakout ahead. Based on current technical structure and investor sentiment, SKLUSDT holds an expected gain potential of 90% to 100%+, making it an attractive opportunity for traders looking for momentum-based setups. This falling wedge formation indicates that the market is approaching a breakout zone where bulls are likely to regain control. The price compression within the wedge pattern suggests accumulation by stronger hands, while short-term traders may be waiting for confirmation before entering. A decisive breakout above the upper trendline could trigger a sharp upward move, potentially aligning with broader market recovery trends across the altcoin sector. Investors’ growing interest in SKLUSDT adds further confidence to the technical outlook. With volume confirming accumulation and sentiment leaning bullish, the coin could soon see increased volatility to the upside. Traders are watching closely for a breakout confirmation, as the next leg up could deliver substantial gains once momentum shifts decisively. ✅ Show your support by hitting the like button and ✅ Leaving a comment below! (What is You opinion about this Coin) Your feedback and engagement keep me inspired to share more insightful market analysis with you!

سفر اقتصاد جهانی: از مبادله کالا تا هوش مصنوعی

Introduction: The Pulse of Civilization The story of the world economy is, in many ways, the story of human progress itself — a journey from barter to blockchain, from localized trade to globalized finance. Every era of history — from the ancient Silk Road to the digital highways of the 21st century — has shaped how nations produce, distribute, and consume wealth. The evolution of the global economy is not merely an economic tale; it is a social, political, and cultural transformation that reflects the very essence of humanity’s pursuit of growth and stability. This comprehensive narrative explores the journey of the world economy, tracing its transformation through centuries — highlighting its major milestones, challenges, and the forces that continue to redefine it in the modern era. 1. The Dawn of Trade: Barter Systems and Early Economies In the earliest human societies, there was no formal concept of money or global trade. People survived through barter systems, exchanging goods and services based on need. A farmer might trade grain for tools made by a blacksmith, or wool for pottery. This system worked in small, self-sufficient communities but faced limitations as societies expanded — differences in value, perishability, and coincidence of wants made trade cumbersome. The first real economic revolution began with the invention of money — shells, metal coins, and later, paper notes — which enabled standardized exchange. Ancient civilizations like Mesopotamia, Egypt, and the Indus Valley established structured economies where trade routes linked distant lands. The Silk Road connected Asia to Europe, allowing not just the flow of goods like silk, spices, and gold, but also the spread of knowledge, religion, and technology. This early phase laid the foundation of what would eventually become the global economy — an interconnected web of production and exchange that transcended borders. 2. The Age of Empires: Expansion, Colonization, and Mercantilism From the 15th to 18th centuries, global trade was dominated by European powers seeking wealth through colonization and mercantilism. Nations like Britain, Spain, Portugal, France, and the Netherlands established colonies across Asia, Africa, and the Americas. The mercantilist theory of this era believed that a nation’s wealth was measured by its stockpile of gold and silver. This drove colonial expansion as European powers exploited resources and labor from their colonies to fuel their own industrial and military growth. The triangular trade system between Europe, Africa, and the Americas epitomized this global economic structure — with raw materials flowing from colonies, manufactured goods from Europe, and enslaved labor from Africa. This period brought immense wealth to Europe but at a devastating human cost. Yet, mercantilism also laid the groundwork for capitalism, as trade, finance, and innovation flourished. The establishment of joint-stock companies like the British East India Company and Dutch VOC introduced the concept of corporate capitalism, where investments and profits were shared among shareholders — a precursor to the modern stock market. 3. The Industrial Revolution: The Birth of Modern Economics The late 18th and 19th centuries marked the Industrial Revolution, a turning point that transformed the economic fabric of the world. Britain led this transformation, powered by technological innovations such as the steam engine, textile machinery, and railways. Factories replaced workshops, and production shifted from manual labor to machine-driven efficiency. Urbanization surged as people moved to cities for work. Productivity soared, and with it, global trade expanded exponentially. The revolution also birthed the modern capitalist system theorized by economists like Adam Smith, whose 1776 work “The Wealth of Nations” introduced the idea of free markets and the “invisible hand.” Capitalism emphasized private property, competition, and profit — principles that shaped economic policy for centuries to come. However, industrialization also deepened class divides, giving rise to socialist ideologies and labor movements. Thinkers like Karl Marx criticized capitalism for exploiting workers and creating inequality — debates that still resonate in modern policy discussions. 4. The Age of Global Conflict and Recovery (1914–1945) The early 20th century tested the global economy with unprecedented crises. The First World War (1914–1918) devastated Europe, draining resources and collapsing trade networks. The interwar years saw unstable financial systems, culminating in the Great Depression of 1929, one of the darkest economic periods in history. Unemployment, deflation, and bankruptcies spread worldwide. The U.S. stock market crash exposed the fragility of the global financial system, leading to the rise of protectionism — countries imposed tariffs, restricting trade in a desperate attempt to save domestic industries. As if that weren’t enough, the world plunged again into World War II (1939–1945). Economies were redirected toward military production, and destruction swept across continents. Yet, out of this devastation emerged the seeds of modern economic cooperation. The Bretton Woods Conference (1944) laid the foundation for a new global economic order. Institutions like the International Monetary Fund (IMF) and World Bank were created to promote stability, reconstruction, and development — ushering in the post-war economic era. 5. The Post-War Boom: The Golden Age of Capitalism (1945–1973) The period following World War II was one of unprecedented economic growth. The United States emerged as the global economic leader, while Europe and Japan rebuilt through programs like the Marshall Plan. This era witnessed the rise of consumer economies, with booming industries, suburbanization, and technological innovation. The Bretton Woods system pegged currencies to the U.S. dollar, establishing global financial stability. Trade liberalization under organizations like the General Agreement on Tariffs and Trade (GATT) encouraged global commerce. Living standards rose dramatically, and the middle class expanded. However, the system began to strain by the early 1970s as inflation, oil shocks, and currency imbalances emerged. The collapse of the Bretton Woods system in 1971, when the U.S. abandoned the gold standard, marked the beginning of floating exchange rates and a more volatile financial environment. 6. The Era of Globalization: Technology, Trade, and Transformation (1980–2008) From the 1980s onward, the world entered an era of hyper-globalization. Technological revolutions in computing, telecommunications, and the internet transformed production, communication, and finance. Policies of economic liberalization, led by figures like Ronald Reagan and Margaret Thatcher, encouraged privatization, deregulation, and free-market capitalism. Global institutions such as the World Trade Organization (WTO) promoted open trade and reduced barriers between nations. Emerging economies — particularly China and India — became key players. China’s market reforms under Deng Xiaoping and India’s 1991 liberalization opened new frontiers for global investment and manufacturing. The European Union (EU) and the rise of multinational corporations deepened global integration. Outsourcing, global supply chains, and financial markets connected the world more tightly than ever before. Yet, this period also created inequality and financial bubbles, culminating in the Global Financial Crisis of 2008, which exposed the vulnerabilities of unregulated markets and excessive debt. 7. The Post-Crisis Rebalancing: A New Global Reality (2008–2020) After 2008, the world economy underwent significant restructuring. Governments and central banks implemented massive stimulus programs, including quantitative easing, to revive growth. The crisis led to introspection — the need for sustainable, inclusive, and resilient economies became central to global policy. Emerging markets continued to rise, shifting the economic balance toward Asia. Meanwhile, technological disruption accelerated. The rise of digital economies, fintech, and artificial intelligence transformed how people work, invest, and consume. Platforms like Amazon, Google, and Alibaba redefined commerce and competition. At the same time, new challenges — climate change, automation, and inequality — demanded global cooperation. The United Nations’ Sustainable Development Goals (SDGs) emerged as a blueprint for balanced economic progress. However, by 2020, the world faced another major disruption — the COVID-19 pandemic, which shook the foundations of global trade, travel, and supply chains. 8. The Pandemic Era and the Road Ahead (2020–Present) The COVID-19 pandemic triggered one of the largest economic contractions since World War II. Lockdowns, factory closures, and disrupted logistics paralyzed industries. Global GDP fell sharply in 2020, and unemployment soared. Yet, the crisis also accelerated digital transformation and remote work, while governments launched unprecedented fiscal and monetary interventions. Stock markets rebounded quickly, fueled by liquidity and innovation in sectors like technology, healthcare, and renewable energy. The pandemic revealed the fragility of global supply chains, prompting countries to rethink economic self-reliance and strategic manufacturing. It also intensified discussions around de-globalization, climate finance, and digital currencies. As nations recovered, attention shifted toward green economies, AI-driven productivity, and de-dollarization — as countries sought alternatives to U.S. financial dominance. The rise of BRICS nations, especially with China and India at the forefront, marked a multipolar shift in global power dynamics. 9. The Future of the World Economy: Innovation, Sustainability, and Inclusion Looking ahead, the global economy is entering a transformational phase. Several key trends are shaping its trajectory: Technological Revolution – AI, blockchain, and quantum computing are redefining industries, from finance to manufacturing. Green Transition – Renewable energy, carbon markets, and sustainable finance are becoming economic cornerstones. Geopolitical Realignment – The U.S.-China rivalry, de-dollarization, and regional trade blocs (like RCEP) are reshaping global alliances. Digital Currencies & Fintech – Central Bank Digital Currencies (CBDCs) and decentralized finance (DeFi) are revolutionizing monetary systems. Inclusive Growth – Nations are emphasizing equity, social welfare, and education as pillars of future prosperity. The new world economy will be digital, decentralized, and data-driven — but its success will depend on how humanity balances innovation with inclusion and sustainability. Conclusion: A Journey Without an End The journey of the world economy is far from over. From primitive bartering to algorithmic trading, from local markets to the metaverse, each phase of economic evolution has mirrored humanity’s endless quest for growth, efficiency, and fairness. Today, as we stand at the crossroads of technology, climate change, and geopolitics, the world economy is being rewritten once again — not by conquest or colonization, but by collaboration, innovation, and consciousness. The next chapter will not just measure wealth in GDP, but in sustainability, resilience, and shared prosperity. The global economy’s true strength will lie not in how fast it grows, but in how well it uplifts humanity as a whole.

CryptoAnalystSignal
پیشبینی انفجاری SKL/USDT: آماده باشید، شورتگیرها در خطرند!

#SKL The price is moving within a descending channel on the 1-hour frame, adhering well to it, and is heading for a strong breakout and retest. We have a bearish trend on the RSI indicator that is about to be broken and retested, which supports the upward move. There is a major support area in green at 0.02412, representing a strong support point. We are heading for consolidation above the 100 moving average. Entry price: 0.02545 First target: 0.02660 Second target: 0.02781 Third target: 0.02950 Don't forget a simple matter: capital management. When you reach the first target, save some money and then change your stop-loss order to an entry order. For inquiries, please leave a comment. Thank you.
چرا پول شما در بازارهای جهانی قابل تبدیل نیست؟ راهنمای کامل مشکلات نرخ ارز

1. Introduction to Currency Convertibility Currency convertibility is critical for the functioning of international markets. A convertible currency allows: Trade Facilitation: Businesses can pay and receive foreign currencies without restrictions. Investment Flexibility: Investors can freely move capital across borders. Economic Integration: Countries with convertible currencies can participate fully in the global economy. Key terms: Fully Convertible Currency: Freely exchangeable for any other currency without restrictions (e.g., US Dollar, Euro). Partially Convertible Currency: Exchange is allowed for some transactions (like trade), but restricted for others (like capital account transactions). Non-Convertible Currency: Cannot be freely exchanged; transactions require government approval or are prohibited (e.g., North Korean Won, Cuban Peso). 2. Historical Background Historically, currency convertibility has evolved with global trade and economic integration: Bretton Woods Era (1944-1971): Fixed exchange rates linked major currencies to the US Dollar, which was convertible to gold. Developing countries often had non-convertible currencies to protect domestic economies. Post-Bretton Woods (1970s onwards): Shift to floating exchange rates increased currency convertibility, but capital controls remained in many emerging markets. Modern Era: Globalization has pushed most developed nations toward full convertibility, while many emerging and frontier economies maintain partial restrictions to manage volatility and capital flight. 3. Types of Currency Convertibility Issues Currency convertibility issues arise when restrictions impede the free exchange of a currency. They can be classified as follows: 3.1. Trade Convertibility Issues Restrictions on import/export payments. Limits on foreign exchange availability for international trade. Common in countries with balance-of-payments crises. Example: In India during the 1970s, foreign exchange allocation for imports was tightly controlled to manage reserves. 3.2. Capital Account Convertibility Issues Restrictions on investment flows: foreign direct investment (FDI), portfolio investment, and lending. Countries impose these to prevent sudden capital flight and speculative attacks. Impact: While protective, it limits access to global finance. Example: China maintains controlled capital account convertibility despite having a largely trade-convertible currency. 3.3. Dual Exchange Rate Systems Countries maintain official vs. market exchange rates. Official rate often underestimates currency value, creating incentives for black markets. These systems arise due to currency overvaluation or limited reserves. Example: Venezuela’s dual exchange rates in the 2010s caused widespread distortions in trade and imports. 3.4. Black Market and Parallel Market Issues When official convertibility is restricted, a parallel market emerges. Leads to currency speculation, inflation, and reduced confidence in the domestic currency. Example: Zimbabwe’s hyperinflation in the 2000s led to a thriving black market for US Dollars. 4. Causes of Currency Convertibility Issues Several factors can restrict currency convertibility: 4.1. Economic Instability High inflation or fiscal deficits reduce investor confidence. Governments may restrict convertibility to protect reserves. 4.2. Limited Foreign Exchange Reserves Countries with small reserves cannot risk free capital outflows. Convertibility restrictions are a tool to preserve reserves. 4.3. Speculative Attacks and Capital Flight Free convertibility can trigger rapid outflows during crises. Example: Asian Financial Crisis (1997) saw several currencies collapse due to speculative attacks. 4.4. Policy and Strategic Objectives Some nations deliberately restrict convertibility to: Protect infant industries. Maintain control over foreign debt. Shield the domestic economy from global shocks. 5. Implications of Currency Convertibility Issues Currency convertibility issues have wide-ranging economic, financial, and social effects: 5.1. On International Trade Restrictive policies increase transaction costs and delays. Firms face uncertainty in pricing, payments, and hedging. 5.2. On Foreign Investment Limited convertibility reduces investor confidence. FDI inflows may decline, limiting economic growth. 5.3. On Domestic Economy Encourages a shadow economy for foreign exchange. Can lead to inflation and currency depreciation. 5.4. On Financial Markets Currency volatility rises when markets anticipate policy shifts. Hedging instruments are limited or costly. 6. Case Studies 6.1. India Pre-1991 India had strict foreign exchange controls and limited convertibility. Imports and FDI required government approval. The 1991 balance-of-payments crisis forced liberalization, leading to gradual convertibility. 6.2. China China has a partially convertible Renminbi (RMB). Trade account is largely convertible; capital account is tightly controlled. This strategy stabilizes domestic financial markets while encouraging trade growth. 6.3. Venezuela Overvalued Bolivar and dual exchange rates led to black markets. Currency controls exacerbated inflation and scarcity of goods. 6.4. Eurozone Euro is fully convertible across participating nations. This has facilitated trade, investment, and capital mobility, highlighting the benefits of full convertibility. 7. Strategies to Address Convertibility Issues Countries can adopt various measures to mitigate currency convertibility problems: 7.1. Gradual Liberalization Phased approach from trade convertibility → capital convertibility. Reduces risk of sudden outflows. 7.2. Strengthening Reserves Adequate foreign exchange reserves improve confidence. Enables smoother convertibility. 7.3. Exchange Rate Policy Adjustments Managed float or crawling peg can balance stability with convertibility. Avoids shocks from volatile global markets. 7.4. Capital Controls Temporary measures during crises to prevent speculative attacks. Should be transparent and predictable. 7.5. Encouraging Foreign Investment FDI inflows bring foreign currency, supporting convertibility. Incentives for long-term, stable investment help reduce risk. 8. Global Implications Currency convertibility affects global finance in multiple ways: Trade Expansion: Fully convertible currencies facilitate seamless trade and lower transaction costs. Capital Flow Efficiency: Investors prefer economies with predictable currency exchange rules. Financial Market Development: Convertibility encourages hedging instruments, derivatives, and risk management strategies. Crisis Containment: Countries with restricted convertibility can insulate themselves temporarily from global shocks, but may also lose investor confidence. 9. Future Outlook With globalization and digital finance, currency convertibility issues are evolving: Digital Currencies and CBDCs: Central bank digital currencies may improve cross-border payments and reduce convertibility barriers. Regional Currency Blocks: Initiatives like the African Continental Free Trade Area (AfCFTA) and the ASEAN Economic Community may enhance regional convertibility. Emerging Market Reforms: Many emerging economies are gradually liberalizing currency accounts while balancing macroeconomic stability. 10. Conclusion Currency convertibility is a vital aspect of economic integration and global financial stability. While fully convertible currencies offer benefits in trade, investment, and market efficiency, partial or non-convertible currencies provide temporary protection against volatility, capital flight, and external shocks. Understanding the nuances of convertibility issues helps policymakers, investors, and businesses navigate the complex global financial landscape. Future trends, including digital currencies and regional financial cooperation, are likely to shape how convertibility evolves in the next decades.
Alpha-GoldFX

SKLUSDT is showing signs of forming a strong bullish wave pattern, which could be a major signal for an upcoming explosive move. The structure indicates that price action is gradually building momentum and preparing for a breakout. With solid trading volume supporting this setup, SKLUSDT has the potential to deliver massive upside gains in the near term, with expectations ranging from 190% to 200%+. This bullish wave pattern suggests accumulation and growing investor confidence. Historically, similar setups have triggered sharp rallies once resistance levels are broken, and SKLUSDT appears to be following a comparable path. The presence of higher lows and steady market activity strengthens the outlook, pointing towards a sustained upward push once a breakout occurs. Investor sentiment is also favoring SKLUSDT as interest in this project continues to rise. A clean breakout above the resistance zone could unleash strong bullish momentum, driving prices to new levels and attracting even more buyers into the market. With these factors in play, SKLUSDT is positioned as one of the crypto pairs to watch closely for substantial growth potential. ✅ Show your support by hitting the like button and ✅ Leaving a comment below! (What is You opinion about this Coin) Your feedback and engagement keep me inspired to share more insightful market analysis with you!

the_blue_osprey

hi friends... sorry about my low activity nowadays!!! i try to open less positions with higher quality!!! here we have the chat of Skale We can see the high level of demand, and the chart is showing everything we want... we can see the good rejection from low at 0.02 and high level of demand there ichimuko is showing some growth signals in feature, and the price is in good position with low risk... so we will open it for next year!!! good lock!
Part I: Understanding Globalization 1. The Concept of Globalization Globalization is the process through which countries and societies become more connected through trade, technology, investment, culture, and politics. It is not a new phenomenon. Historically, trade routes like the Silk Road or colonial expansions already linked distant societies. However, modern globalization is faster, broader, and more complex because of digital technologies, modern transportation, and global institutions. 2. Historical Phases of Globalization Pre-modern globalization (before 1500): Exchange of goods, ideas, and culture through ancient trade routes. Colonial globalization (1500–1800): European expansion, global maritime trade, and the integration of colonies into global markets. Industrial globalization (1800–1945): Industrial revolution, rise of capitalism, mass migration, and colonial empires. Post-WWII globalization (1945–1990): Bretton Woods system, establishment of IMF, World Bank, GATT (later WTO), rapid growth of multinational corporations. Contemporary globalization (1990–present): Driven by digital revolution, liberalization of markets, China’s rise, and global value chains. 3. Drivers of Globalization Economic factors: Free trade agreements, foreign direct investment, outsourcing, and global supply chains. Technological factors: Internet, smartphones, containerization in shipping, aviation, artificial intelligence. Political factors: Collapse of the Soviet Union, liberalization of China and India, neoliberal policies. Cultural factors: Spread of movies, music, cuisine, tourism, and global media. Institutional factors: Role of WTO, UN, World Bank, IMF in shaping global rules. 4. Key Features of Globalization Free movement of goods and services through trade liberalization. Capital mobility via foreign investments, stock markets, and financial flows. Labor mobility, including migration and outsourcing. Knowledge and cultural diffusion through digital platforms and global communication. Global governance, where international rules and treaties influence domestic policies. Part II: Benefits and Criticisms of Globalization 1. Benefits of Globalization Economic growth: Countries like China, South Korea, and India grew rapidly by integrating into global trade. Poverty reduction: Hundreds of millions lifted out of poverty, particularly in Asia. Access to technology and knowledge: Rapid spread of innovations like smartphones, vaccines, and renewable energy. Cultural exchange: Increased exposure to different cuisines, languages, films, and lifestyles. Global cooperation: Joint efforts in areas like climate change, health, and peacekeeping. 2. Criticisms of Globalization Economic inequality: Benefits concentrated in urban elites, while rural and working-class populations often feel left behind. Exploitation of labor: Sweatshops, poor working conditions, and child labor in developing countries. Cultural homogenization: Local traditions sometimes overshadowed by dominant Western culture. Environmental damage: Global supply chains contribute to carbon emissions and resource depletion. Sovereignty concerns: National governments constrained by global corporations and institutions. Part III: The Rise of De-Globalization 1. Defining De-Globalization De-globalization refers to a process where countries reduce their interdependence and focus more on domestic or regional economies. It is not necessarily a complete reversal of globalization but a slowing down or selective disengagement. 2. Historical Precedents The Great Depression (1930s): Countries adopted protectionism and trade barriers. World Wars: Global connections broke down, leading to regional blocs. Oil crises (1970s): Triggered energy nationalism and protectionist policies. 3. Contemporary Drivers of De-Globalization Economic nationalism: Trade wars, tariffs, and policies favoring domestic industries (e.g., U.S.–China tensions). Pandemics: COVID-19 exposed vulnerabilities in global supply chains, leading to “reshoring” or “nearshoring.” Geopolitical tensions: Russia-Ukraine war, Taiwan conflict, Middle East instability. Technological sovereignty: Push for domestic control over critical technologies like semiconductors and AI. Environmental concerns: Shift toward local production and sustainable supply chains. 4. Examples of De-Globalization Brexit: UK’s withdrawal from the European Union. U.S.–China trade war: Tariffs, sanctions, and decoupling in technology. Supply chain reshoring: Companies like Apple diversifying away from China. Regionalization: Growth of regional trade agreements like RCEP (Asia) and USMCA (North America). Part IV: Future of Globalization and De-Globalization 1. Hybrid Future Most experts argue that globalization will not disappear entirely. Instead, we are entering a hybrid era where: Supply chains become regional rather than fully global. Countries balance global trade with domestic resilience. Digital globalization (data, AI, e-commerce) grows even if physical trade slows. 2. Scenarios for the Future Re-globalization: If countries overcome geopolitical rivalries and focus on cooperation in climate, health, and technology. Fragmented globalization: World splits into competing blocs (U.S.-led, China-led, EU-led). Selective de-globalization: Nations globalize in technology and finance but de-globalize in food, energy, and security. 3. Role of Key Actors Governments: Balance between economic openness and protecting domestic interests. Corporations: Redesign supply chains for resilience. International institutions: Need reforms to stay relevant. Civil society: Push for fairer, greener globalization. Part V: Case Studies 1. China – From Globalization to Selective De-Globalization China was the biggest winner of globalization, lifting millions out of poverty. But now, facing U.S. pressure, it is pursuing “dual circulation” – focusing on both domestic and global markets. 2. United States – Global Leader to Economic Nationalist Once the champion of free trade, the U.S. has shifted toward reshoring, tariffs, and tech protectionism, especially under Trump and Biden administrations. 3. European Union – Between Integration and Fragmentation The EU promotes internal integration but faces pressures like Brexit, energy crises, and immigration debates. 4. India – Strategic Balancing India embraces globalization in IT and services but protects key sectors like agriculture. It seeks to position itself as an alternative manufacturing hub to China. Part VI: Globalization vs. De-Globalization in Society In economics: De-globalization raises costs but increases resilience. In politics: Globalization fosters cooperation, while de-globalization strengthens sovereignty. In culture: Globalization spreads diversity, but de-globalization protects heritage. In environment: Globalization increases carbon footprints, but de-globalization can encourage local sustainability. Conclusion Globalization has been one of the most transformative forces in human history, reshaping economies, societies, and cultures. It has brought prosperity, connectivity, and innovation, but also inequality, environmental damage, and political tensions. De-globalization is not simply a rejection of globalization but a recalibration. The world is moving toward a more balanced model that emphasizes resilience, regional cooperation, and sustainability. In the end, neither globalization nor de-globalization is inherently good or bad. Both are responses to changing realities. The challenge for policymakers, businesses, and societies is to shape globalization in a way that is more inclusive, equitable, and sustainable—while learning from the lessons of de-globalization.

Bithereum_io
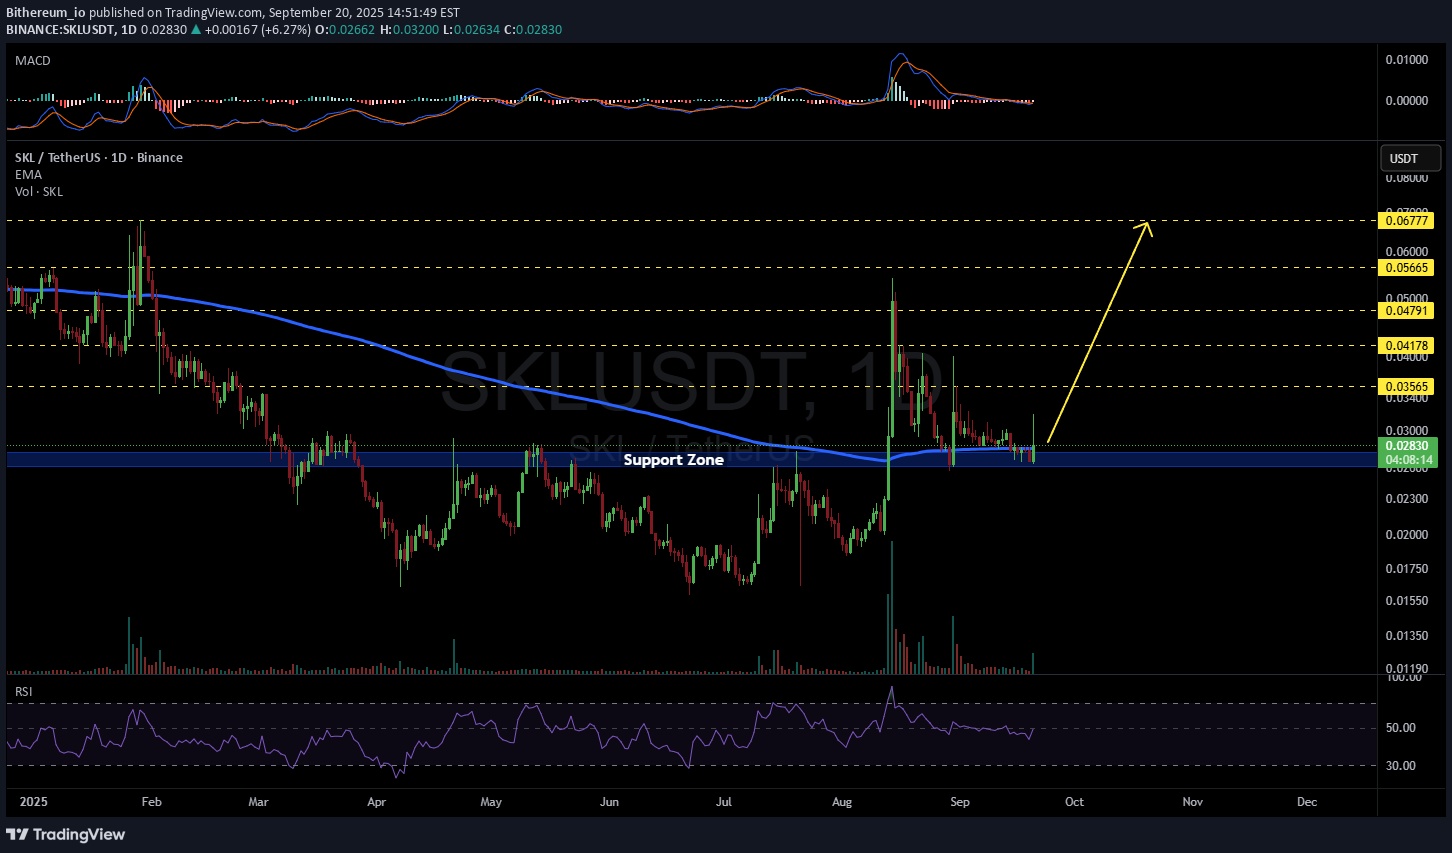
#SKL has bounced off the support zone. We expect a pump only if it can hold the price above the support zone and the daily EMA200. If that happens, the potential targets are: 🎯 $0.03565 🎯 $0.04178 🎯 $0.04791 🎯 $0.05665 🎯 $0.06777 ⚠️ Always remember to use a tight stop-loss and follow proper risk management.
Global Market Insights Introduction The world economy has never been as connected as it is today. A single headline in New York can influence stock prices in Mumbai, a factory shutdown in China can disrupt supply chains in Europe, and a currency decision in Tokyo can ripple across the global financial system. This interconnectedness is what we call the global market—a dynamic web of trade, finance, investment, and technology that links countries, businesses, and consumers. Understanding global market insights means going beyond numbers and charts. It is about recognizing patterns, decoding the interplay between economies, and anticipating the opportunities and risks that shape the world’s financial and trade environment. For businesses, it means better decision-making; for investors, it provides a roadmap; and for policymakers, it is the foundation of economic strategy. Historical Evolution of Global Markets Early Trade Routes Global markets are not new—they have been evolving for centuries. Ancient trade routes like the Silk Road connected China, India, and Europe, enabling the exchange of goods, culture, and ideas. Spices, silk, and gold moved across continents, laying the foundation of international trade. Colonial Trade During the colonial era, European powers expanded overseas trade. Colonies became sources of raw materials, while Europe turned into the hub of global commerce. The triangular trade routes connected Africa, the Americas, and Europe, setting the stage for structured global markets. Industrial Revolution The 18th and 19th centuries brought industrialization, mass production, and mechanization. This created demand for global raw materials and expanded markets for finished goods. Railways, shipping, and telegraph systems made trade faster and more reliable. Post-WWII Institutions After the devastation of World War II, new financial institutions like the IMF, World Bank, and GATT (later WTO) were established. Their goal was to stabilize currencies, promote trade, and rebuild economies. The Bretton Woods system anchored the US dollar as the world’s reserve currency. The Digital Era The late 20th and early 21st centuries saw globalization accelerate. The internet, digital platforms, and financial technologies made cross-border trading seamless. E-commerce, digital payments, and global capital flows now define how markets operate. Key Drivers of Global Markets Economic Growth & GDP Trends Growth in GDP reflects an economy’s strength. For example, India’s rapid GDP expansion makes it attractive for foreign investment, while slowdowns in Europe raise global concerns. Central Banks & Interest Rates Monetary policy is a powerful driver. A rate hike by the US Federal Reserve often strengthens the US dollar, affects emerging market currencies, and shifts capital flows worldwide. Geopolitics Conflicts, trade wars, and diplomatic relations heavily impact markets. For instance, the Russia-Ukraine war disrupted energy markets, while US-China tensions reshaped technology supply chains. Technology & Innovation Advancements like artificial intelligence, fintech, blockchain, and automation are creating new asset classes and transforming trade. Digital finance is reducing barriers for investors across borders. Global Supply Chains Modern economies depend on complex supply chains. A disruption in semiconductor production in Taiwan can stall automobile factories in Germany or the US, highlighting interdependence. Global Market Segments Equity Markets Stock exchanges like NYSE, Nasdaq, London Stock Exchange, and NSE India are central to global finance. The US remains dominant, but Asia is rising fast, with China’s Shanghai and Shenzhen exchanges gaining global importance. Bond Markets The global bond market is even larger than equities. Sovereign bonds, like US Treasuries, are considered safe havens, while corporate bonds fund business expansion worldwide. Currency (Forex) Markets The foreign exchange market is the largest in the world, with daily transactions exceeding $7 trillion. The US dollar remains the dominant reserve currency, but the Euro, Yen, and increasingly the Chinese Yuan are challenging its supremacy. Commodities Oil, gold, copper, and agricultural goods form the backbone of commodity markets. Oil prices influence inflation, while gold is a traditional safe haven during uncertainty. Industrial metals like copper are seen as indicators of global economic health. Alternative Assets Cryptocurrencies, private equity, hedge funds, and real estate investments are becoming major parts of global portfolios. Bitcoin, in particular, has sparked debates about the future of decentralized money. Regional Market Insights United States The US remains the world’s largest economy and financial hub. The S&P 500 and Nasdaq set global benchmarks. US Federal Reserve decisions on interest rates influence global capital flows. Europe The Eurozone represents a unified market but faces challenges like debt crises, energy dependency, and post-Brexit trade disruptions. Germany’s manufacturing and France’s luxury goods industries play central roles. Asia China, the world’s second-largest economy, has slowed down recently but still drives global trade. India is emerging as a fast-growing market, fueled by demographics, technology, and reforms. Japan continues its ultra-loose monetary policy, affecting global yen carry trades. Emerging Markets Countries like Brazil, South Africa, and Indonesia are resource-rich and attract investment. However, they are vulnerable to capital outflows during global crises. ASEAN nations are gaining strength through regional cooperation. Major Trends Shaping Global Markets Shift from West to East Economic power is gradually shifting toward Asia, particularly China and India. Digital Finance & Blockchain Cryptocurrencies, central bank digital currencies (CBDCs), and decentralized finance (DeFi) are reshaping financial systems. ESG & Green Investing Investors now focus on sustainability. Companies that prioritize environmental, social, and governance (ESG) standards attract global capital. Supply Chain Diversification The pandemic exposed supply chain weaknesses. Companies are diversifying away from single-country dependence, moving toward "China+1" strategies. De-dollarization Several nations are exploring alternatives to the US dollar for trade settlements. The BRICS bloc is discussing new currency frameworks. Challenges & Risks Inflation & Stagflation: Rising global inflation threatens purchasing power and investment returns. Geopolitical Conflicts: Wars and trade disputes disrupt supply chains and energy flows. Climate Change: Extreme weather impacts agriculture, energy, and insurance markets. Financial Contagion: A crisis in one country can trigger a domino effect, as seen in 2008. Global Market Opportunities Emerging Technologies: AI, electric vehicles, renewable energy, and biotech present trillion-dollar opportunities. India & Southeast Asia: With growing populations and strong digital adoption, these regions attract global investors. Africa: Resource wealth and demographic growth position Africa as the "next frontier." Digital Trade & Fintech: Cross-border e-commerce, digital payments, and fintech innovations expand global financial access. Future of Global Markets The next decade is likely to witness: A multipolar financial world where the US, China, India, and Europe share influence. The rise of digital currencies—both private and government-issued. Green transformation, with renewable energy and sustainability as key investment drivers. Increased regional alliances, as countries secure supply chains and reduce dependency on single markets. Conclusion Global markets are the heartbeat of the interconnected world. They reflect the hopes, fears, and ambitions of billions of people, from Wall Street traders to farmers in rural Africa. Insights into these markets allow investors, businesses, and policymakers to anticipate changes, mitigate risks, and seize opportunities. As the global economy becomes more multipolar, digitalized, and sustainability-driven, the importance of staying updated with global market insights will only grow. For anyone involved in trade, investment, or governance, understanding these dynamics is no longer optional—it is essential.
Disclaimer
Any content and materials included in Sahmeto's website and official communication channels are a compilation of personal opinions and analyses and are not binding. They do not constitute any recommendation for buying, selling, entering or exiting the stock market and cryptocurrency market. Also, all news and analyses included in the website and channels are merely republished information from official and unofficial domestic and foreign sources, and it is obvious that users of the said content are responsible for following up and ensuring the authenticity and accuracy of the materials. Therefore, while disclaiming responsibility, it is declared that the responsibility for any decision-making, action, and potential profit and loss in the capital market and cryptocurrency market lies with the trader.