
RLC
iExec RLC
| تریدر | نوع سیگنال | حد سود/ضرر | زمان انتشار | مشاهده پیام |
|---|---|---|---|---|
خرید | حد سود: تعیین نشده حد ضرر: تعیین نشده | 1/1/2026 |

Price Chart of iExec RLC
سود 3 Months :
سیگنالهای iExec RLC
Filter
Sort messages by
Trader Type
Time Frame
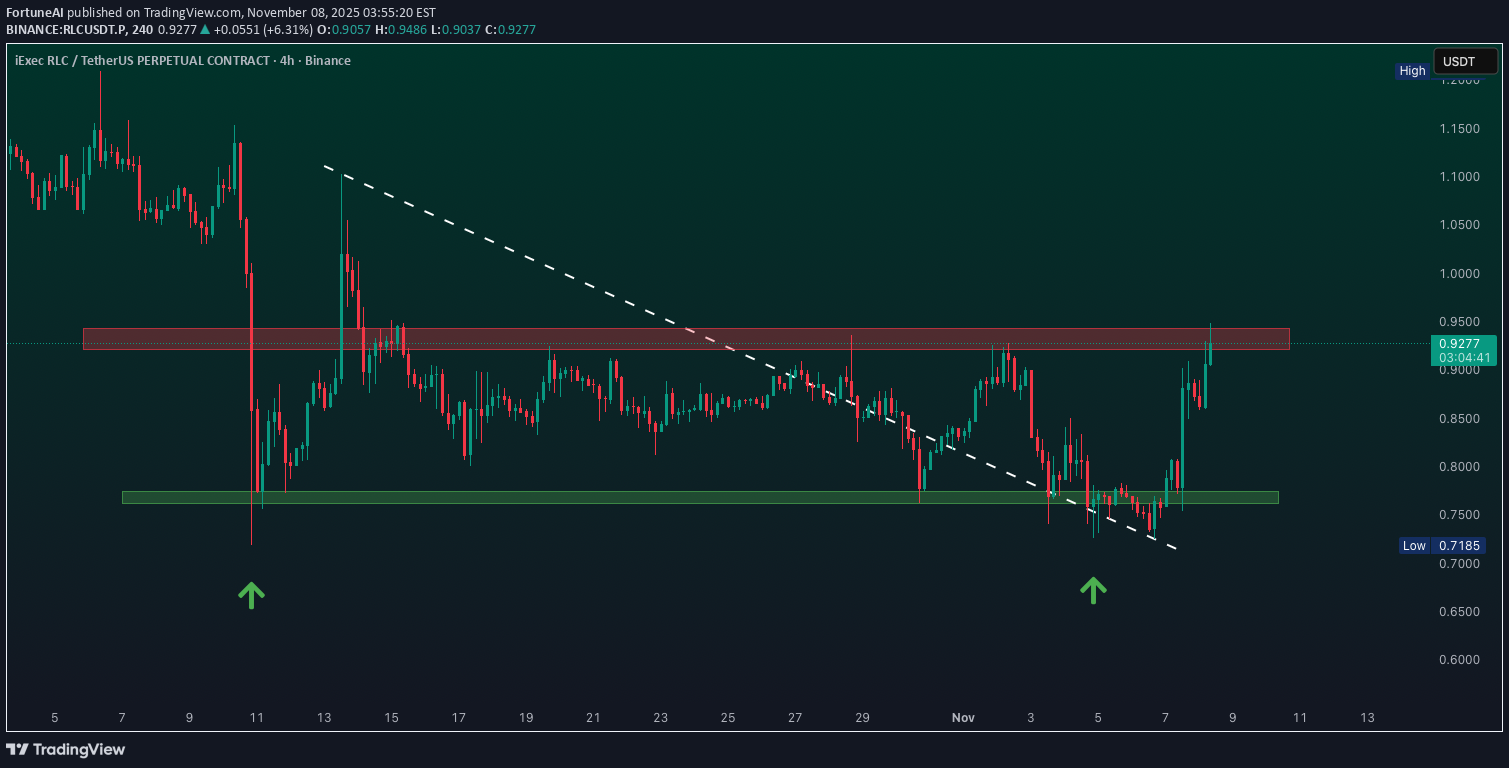
شکست محتمل گُوِه نزولی در RLC/USDT: آیا زمان خرید فرا رسیده است؟

This analysis reflects my personal view on the RLC/USDT trading pair based on technical analysis. The idea is shared for educational and informational purposes only and should not be considered financial advice. Market conditions can change rapidly, so always do your own research and risk management before making any trading decisions. bullish breakout above wedge resistance with strong volume confirmation is required. If confirmed, a fast upside move may follow. This bullish scenario is invalidated if price breaks below wedge support. Feedback and alternative views are welcome.* /Sanaz/

CryptoAnalystSignal
#RLC/USDT Bullish Reversal in MAGICUSDT Accumulation Zone
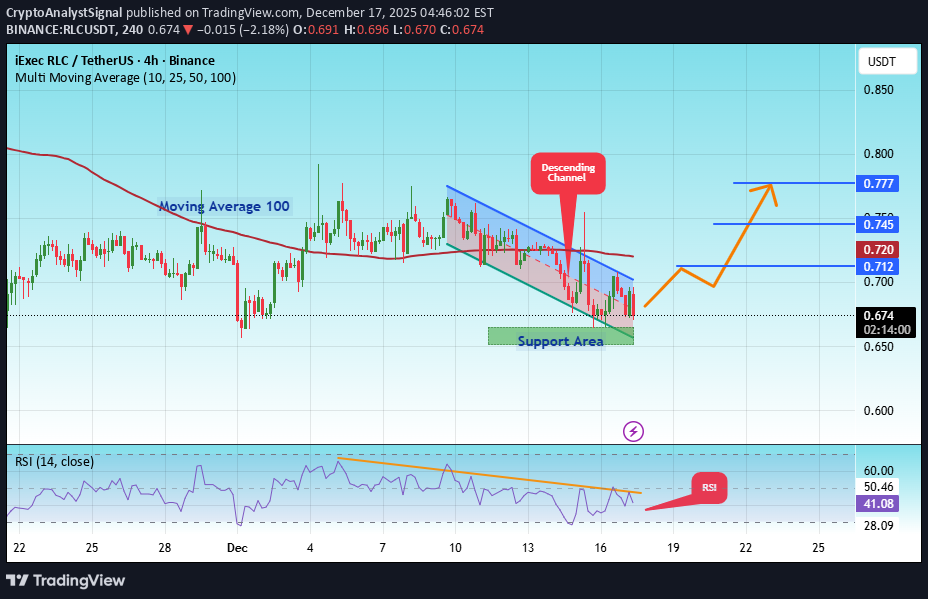
#RLC The price is moving in a descending channel on the 1-hour timeframe. It has reached the lower boundary and is heading towards breaking above it, with a retest of the upper boundary expected. We have a downtrend on the RSI indicator, which has reached near the lower boundary, and an upward rebound is expected. There is a key support zone in green at 0.658. The price has bounced from this zone multiple times and is expected to bounce again. We have a trend towards consolidation above the 100-period moving average, as we are moving close to it, which supports the upward movement. Entry price: 0.694 First target: 0.712 Second target: 0.745 Third target: 0.777 Don't forget a simple principle: money management. Place your stop-loss below the support zone in green. For any questions, please leave a comment. Thank you.

SurviveToTrade
آیا ارز RLC آماده بازگشت صعودی است؟ راز قیمت 3 تا 4 دلاری پشت نمودار!
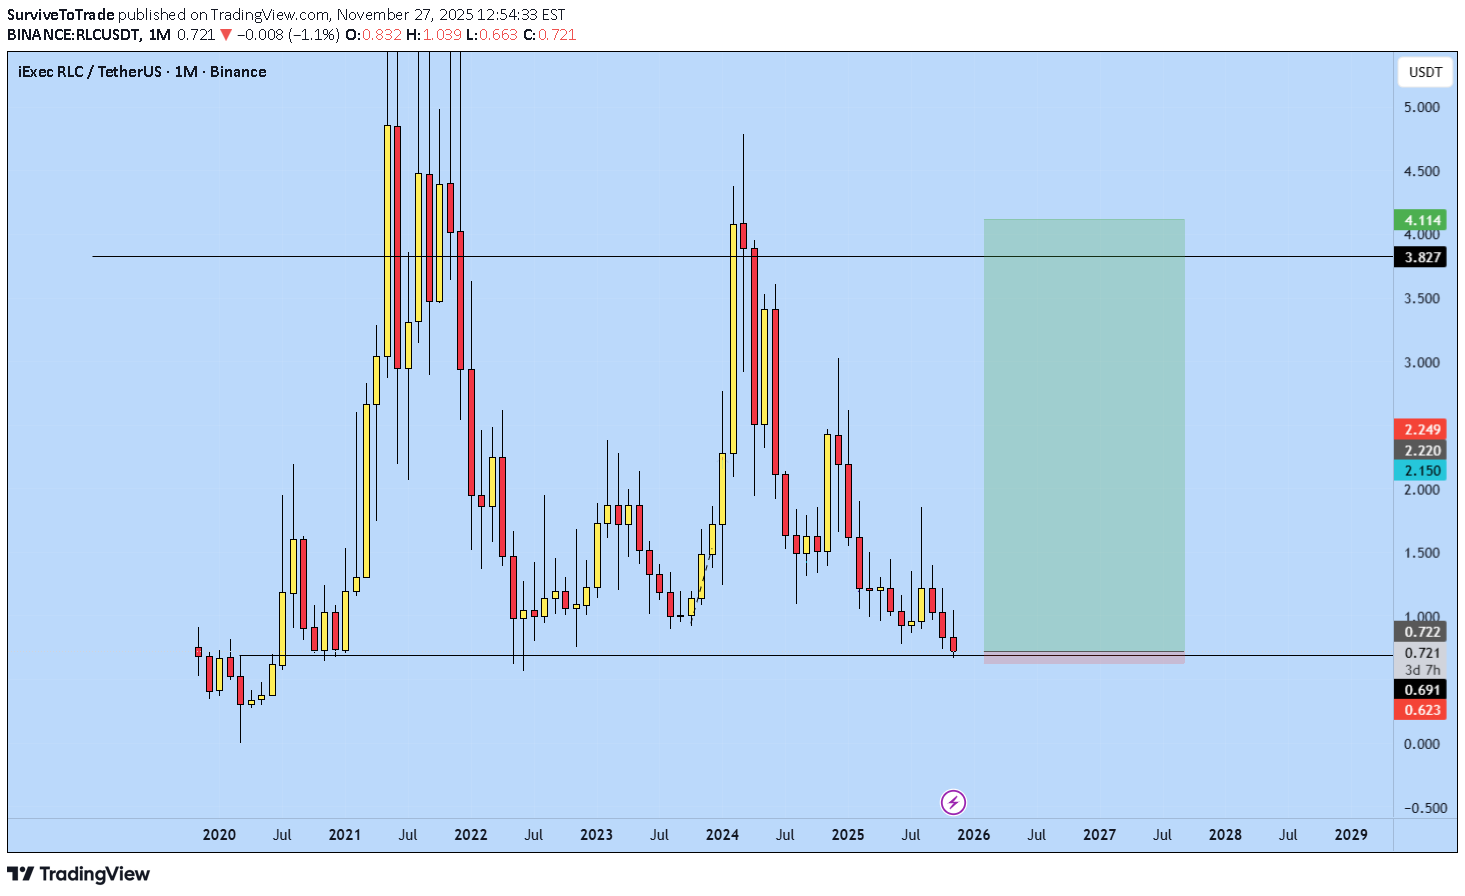
Simple, naked chart showing signs of potential flip back towards a new bullish cycle. If we can stay above that 0.7$ level, we can look at potential reversals back towards 3-4$. From a Fundamental side of things, the project is promising and in undervalued territory. Let's see what next couple of months can bring us. Cheers!So far, so good. I'm expecting a strong push following in the next days/weeks. let's see.

pullbacksignal
سیگنال خرید فوری RLC/USDT: اهداف و تحلیل تکنیکال (شگفتانگیز!)

İşlem Kurulumu: RLCUSDT iExecRLC'de (4s) bir İşlem Sinyali görülmektedir. İşlemciler ŞİMDİ Alım İşlemlerini açabilirler. ⬆️Şimdi Al veya 0,77'den Al ⭕️SL @ 0,697 🔵TP1 @ 0,894 🔵TP2 @ 0,974 🔵TP3 @ 1,199 Bu sinyaller neye dayanmaktadır? Klasik Teknik Analiz Fiyat Hareketi Mum Grafikleri Fibonacci RSI, Hareketli Ortalama, Ichimoku, Bollinger Bantları Risk Uyarısı Forex, CFD, Kripto, Vadeli İşlemler ve Hisse Senetleri ticareti kayıp riski içerir. Lütfen bu tür işlemlerin sizin için uygun olup olmadığını dikkatlice değerlendirin. Geçmiş performans, gelecekteki sonuçların göstergesi değildir. Fikirlerimizi beğendiyseniz, lütfen beğenileriniz 👍 ve yorumlarınızla bizi destekleyin.
pullbacksignal
سیگنال خرید فوری RLCUSDT: فرصت ترید با تحلیل تکنیکال قوی (اهداف و حد ضرر)

Trading Setup: A Trading Signal is seen in the RLCUSDT iExecRLC (4h) Traders can open their Buy Trades NOW ⬆️Buy now or Buy on 0.77 ⭕️SL @ 0.697 🔵TP1 @ 0.894 🔵TP2 @ 0.974 🔵TP3 @ 1.199 What are these signals based on? Classical Technical Analysis Price Action Candlesticks Fibonacci RSI, Moving Average , Ichimoku , Bollinger Bands Risk Warning Trading Forex, CFDs, Crypto, Futures, and Stocks involve a risk of loss. Please consider carefully if such trading is appropriate for you. Past performance is not indicative of future results. If you liked our ideas, please support us with your likes 👍 and comments .
CryptoAnalystSignal
سیگنال خرید فوری RLC/USDT: فرصت پامپ بزرگ در کانال صعودی!
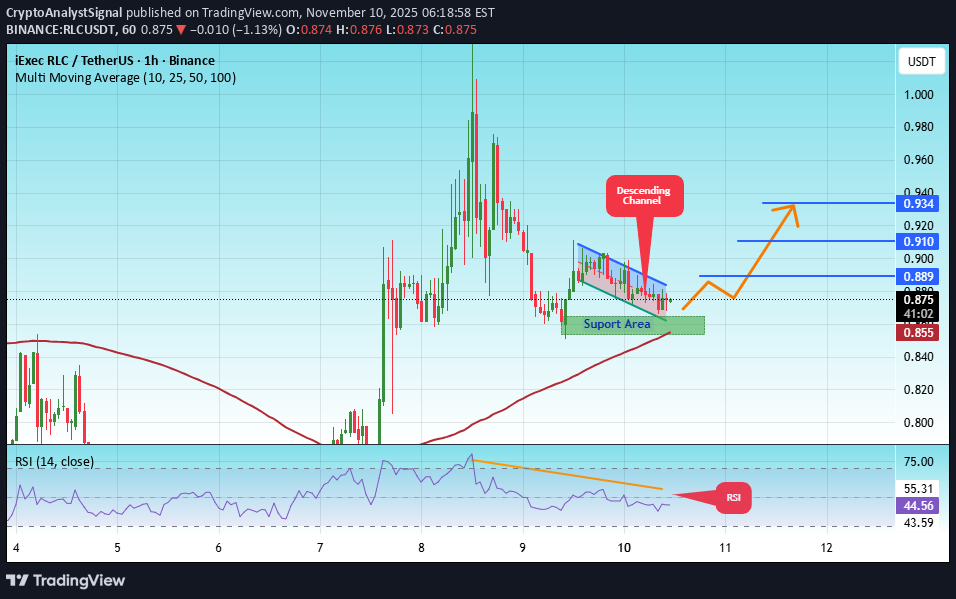
#RLC The price is moving within an ascending channel on the 1-hour timeframe and is adhering to it well. It is poised to break out strongly and retest the channel. We have a downtrend line on the RSI indicator that is about to break and retest, which supports the upward move. There is a key support zone in green at the 0.860 price level, representing a strong support point. We have a trend of consolidation above the 100-period moving average. Entry price: 0.876 First target: 0.889 Second target: 0.910 Third target: 0.934 Don't forget a simple money management rule: Place your stop-loss order below the green support zone. Once you reach the first target, save some money and then change your stop-loss order to an entry order. For any questions, please leave a comment. Thank you.

Bithereum_io
سیگنال خرید RLC: موج صعودی در انتظار شکست الگوی گوه نزولی!
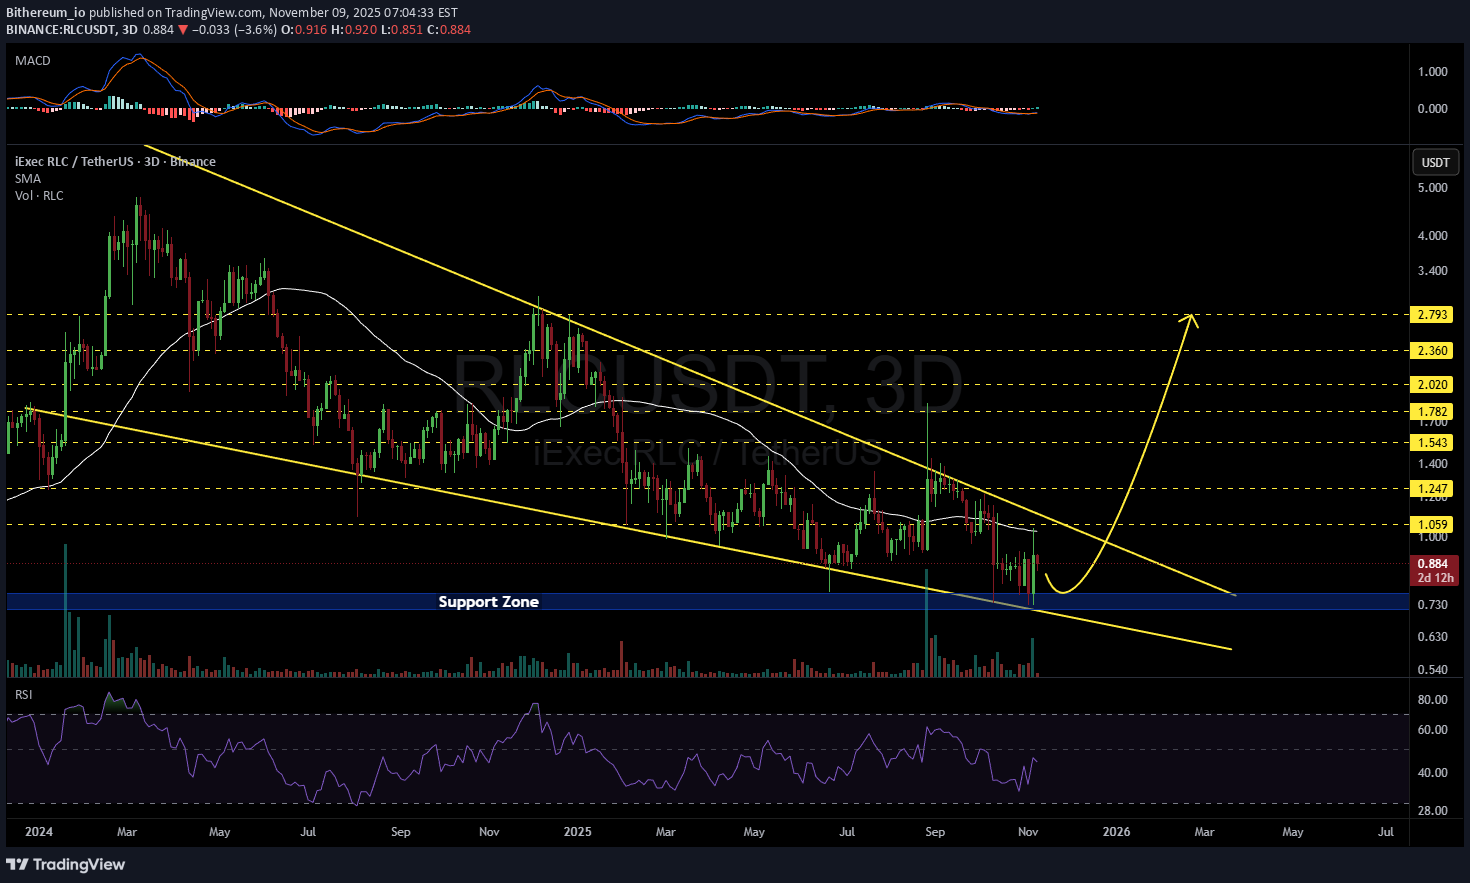
#RLC is currently trading within a falling wedge pattern on the 3-day chart. Consider buying around the current level and near the support zone. In case of a breakout above the 3-day SMA50 and the wedge resistance, the potential upside targets are: 🎯 $1.059 🎯 $1.247 🎯 $1.543 🎯 $1.782 🎯 $2.020 🎯 $2.360 🎯 $2.793 ⚠️ Always remember to use a tight stop-loss and maintain proper risk management.

FortuneAI
RLC منفجر شد: هوش مصنوعی، داده و حریم خصوصی چگونه قیمت آن را بالا میبرند؟

ROBO416
آیا RLC به اوج تاریخی میرسد؟ تحلیل شگفتانگیز برای هفتههای آینده!
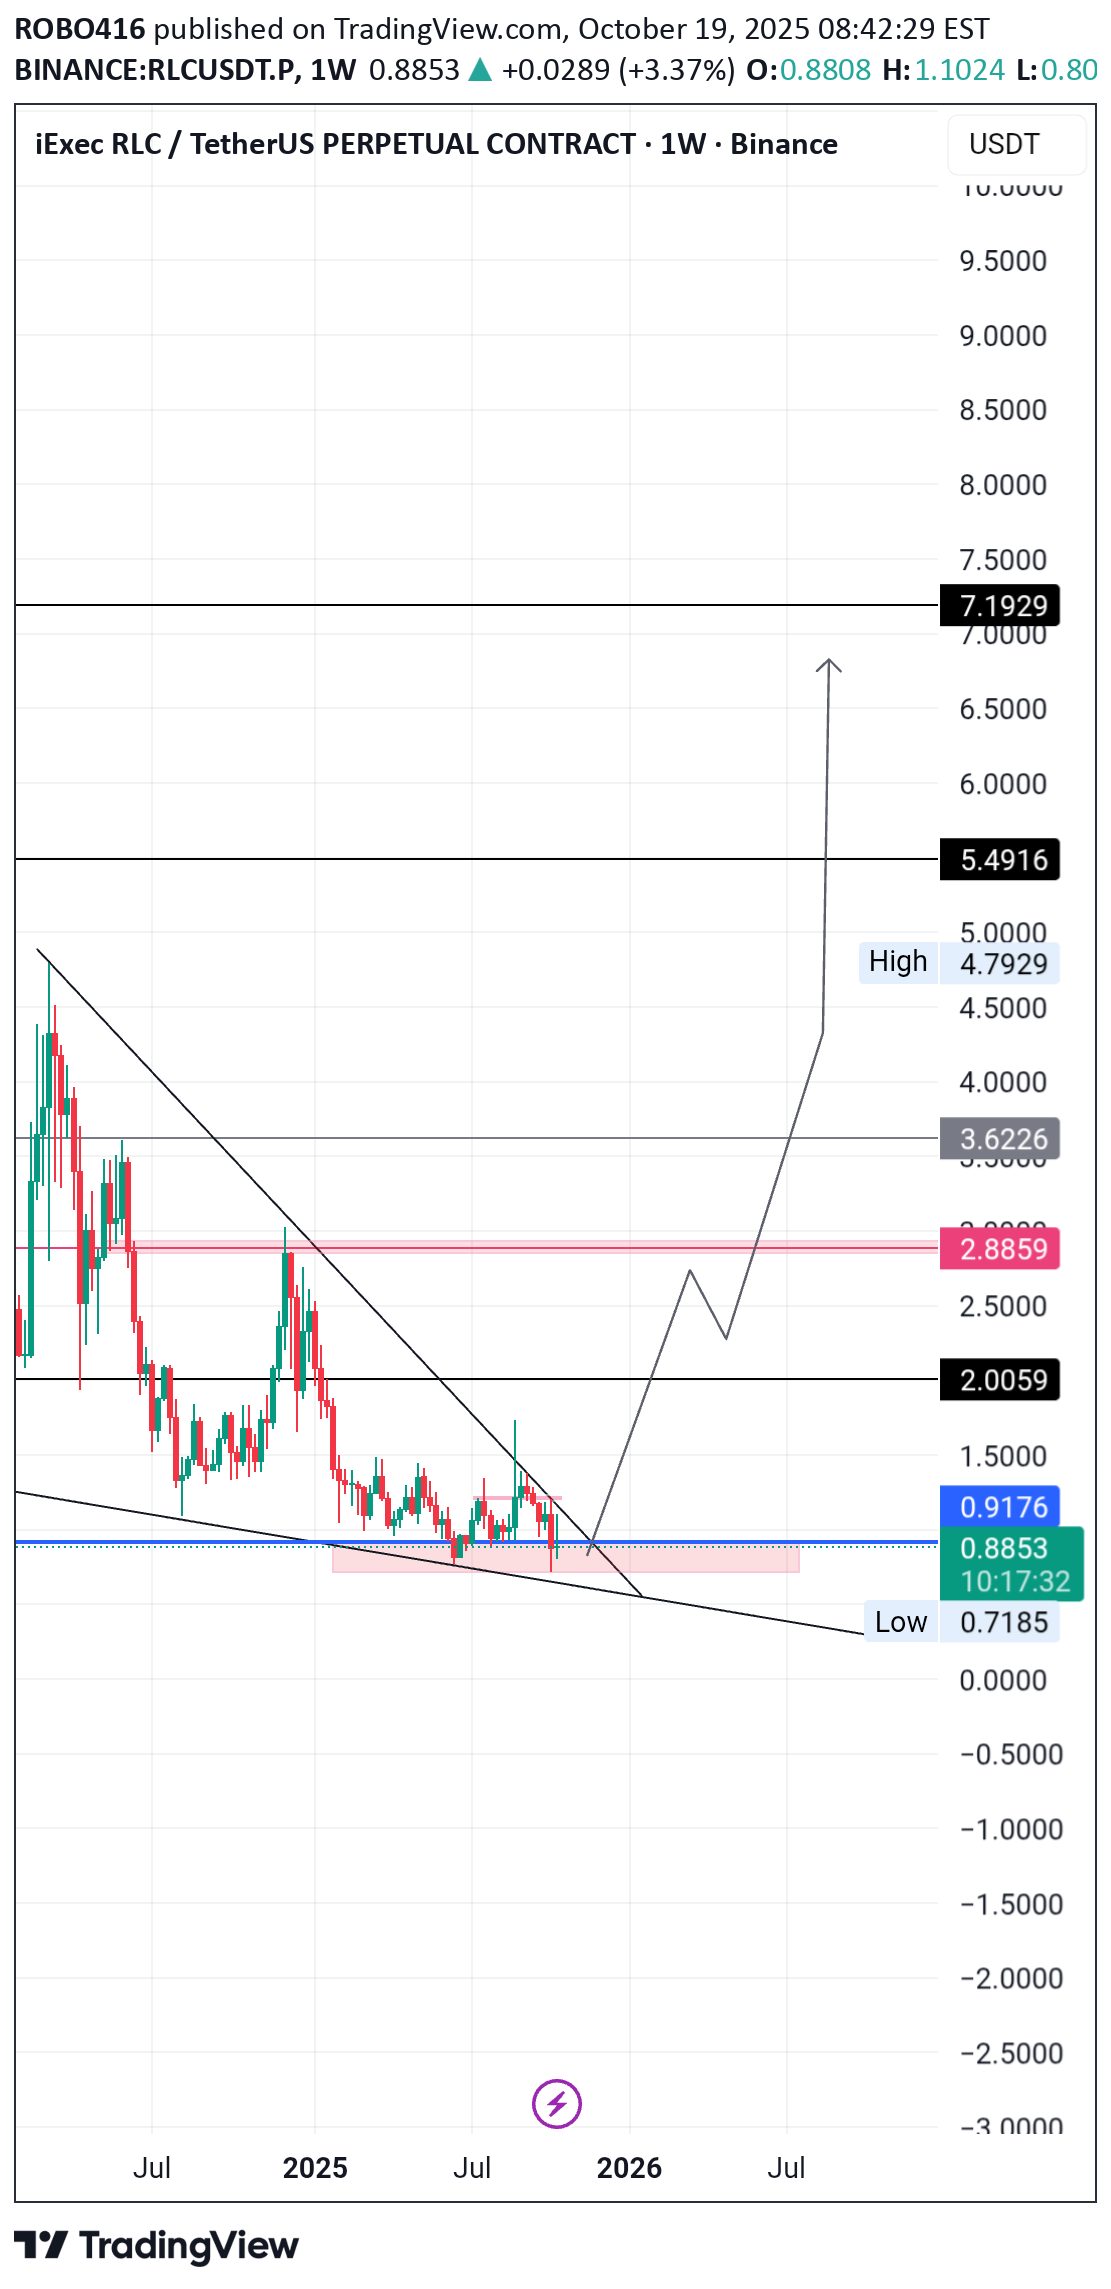
RLCusdt is providing a Good Spot entry for the upcoming weeks. Possible rejection from here can send this massively to 5-7 and high chances of going into price Discovery after clearing 12-14 area. Looks a very solid trade. Setup is Buying DCA under 0.8800(current price). Invalidation breaking below current support.(Negative 6-10%). If holds here for while this can blow to high prices soon. Note: Not a Financial advice.

CakmaUstad
شکست نزولی ناکام ماند: آماده جهش بزرگ به سمت بالا؟

Based on the falling break, it is expected to break up and start the formation.
Disclaimer
Any content and materials included in Sahmeto's website and official communication channels are a compilation of personal opinions and analyses and are not binding. They do not constitute any recommendation for buying, selling, entering or exiting the stock market and cryptocurrency market. Also, all news and analyses included in the website and channels are merely republished information from official and unofficial domestic and foreign sources, and it is obvious that users of the said content are responsible for following up and ensuring the authenticity and accuracy of the materials. Therefore, while disclaiming responsibility, it is declared that the responsibility for any decision-making, action, and potential profit and loss in the capital market and cryptocurrency market lies with the trader.