
RAD
Radicle
| تریدر | نوع سیگنال | حد سود/ضرر | زمان انتشار | مشاهده پیام |
|---|---|---|---|---|
No results found. | ||||
Price Chart of Radicle
سود 3 Months :
سیگنالهای Radicle
Filter
Sort messages by
Trader Type
Time Frame

Alpha-GoldFX
RADUSDT Forming Bullish Reversal
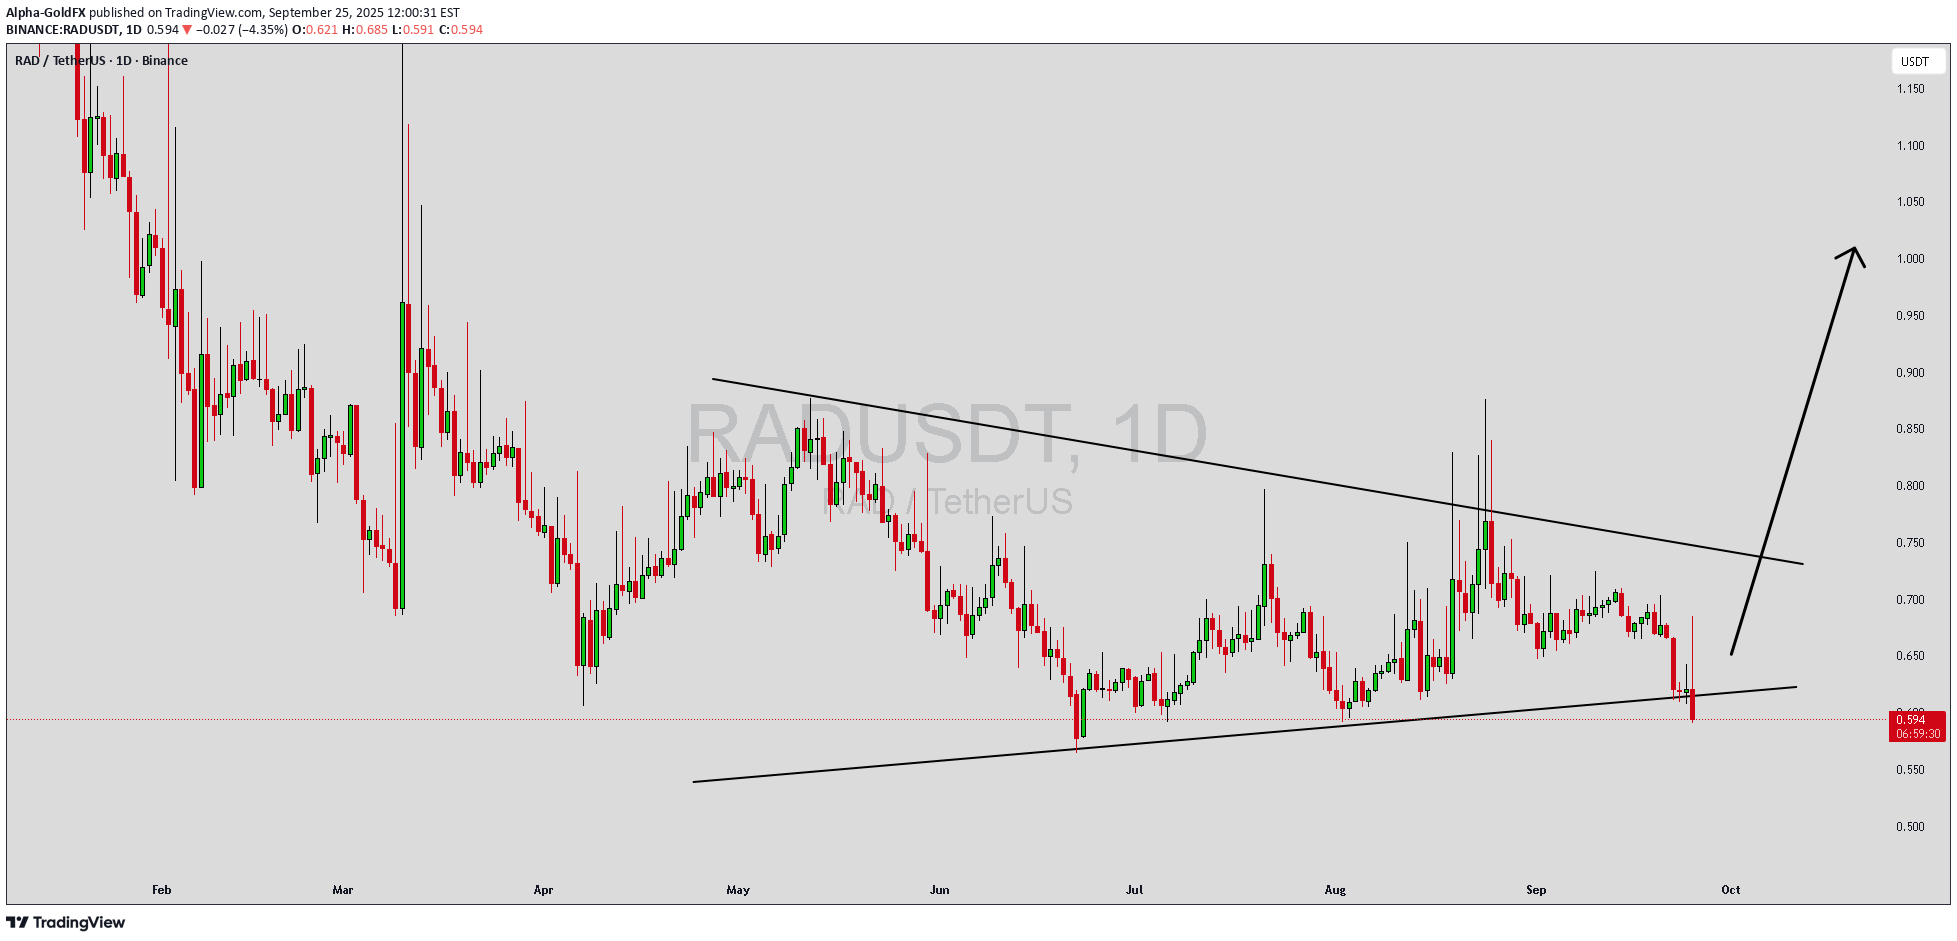
RADUSDT is currently forming a strong technical setup that suggests a potential bullish move ahead. The chart reflects a narrowing price action that is setting the stage for a breakout. With good trading volume supporting the structure, this setup is gaining momentum and drawing increased attention from traders and investors. If confirmed, this move could deliver an upside potential of around 40% to 50% in the coming sessions. The consolidation phase has allowed RADUSDT to build a strong base, which often precedes explosive moves. A breakout from this level could trigger fresh buying interest, as market participants look to capitalize on the upcoming trend shift. The volume pattern is in alignment with this bullish outlook, highlighting growing interest and participation. Investor sentiment around this project has also been strengthening, which aligns with the technical indicators pointing toward a potential bullish reversal. With patience and careful entry timing, traders could position themselves for strong gains as RADUSDT gears up for a possible breakout rally. ✅ Show your support by hitting the like button and ✅ Leaving a comment below! (What is You opinion about this Coin) Your feedback and engagement keep me inspired to share more insightful market analysis with you!
Alpha-GoldFX
RADUSDT Forming Descending Wedge
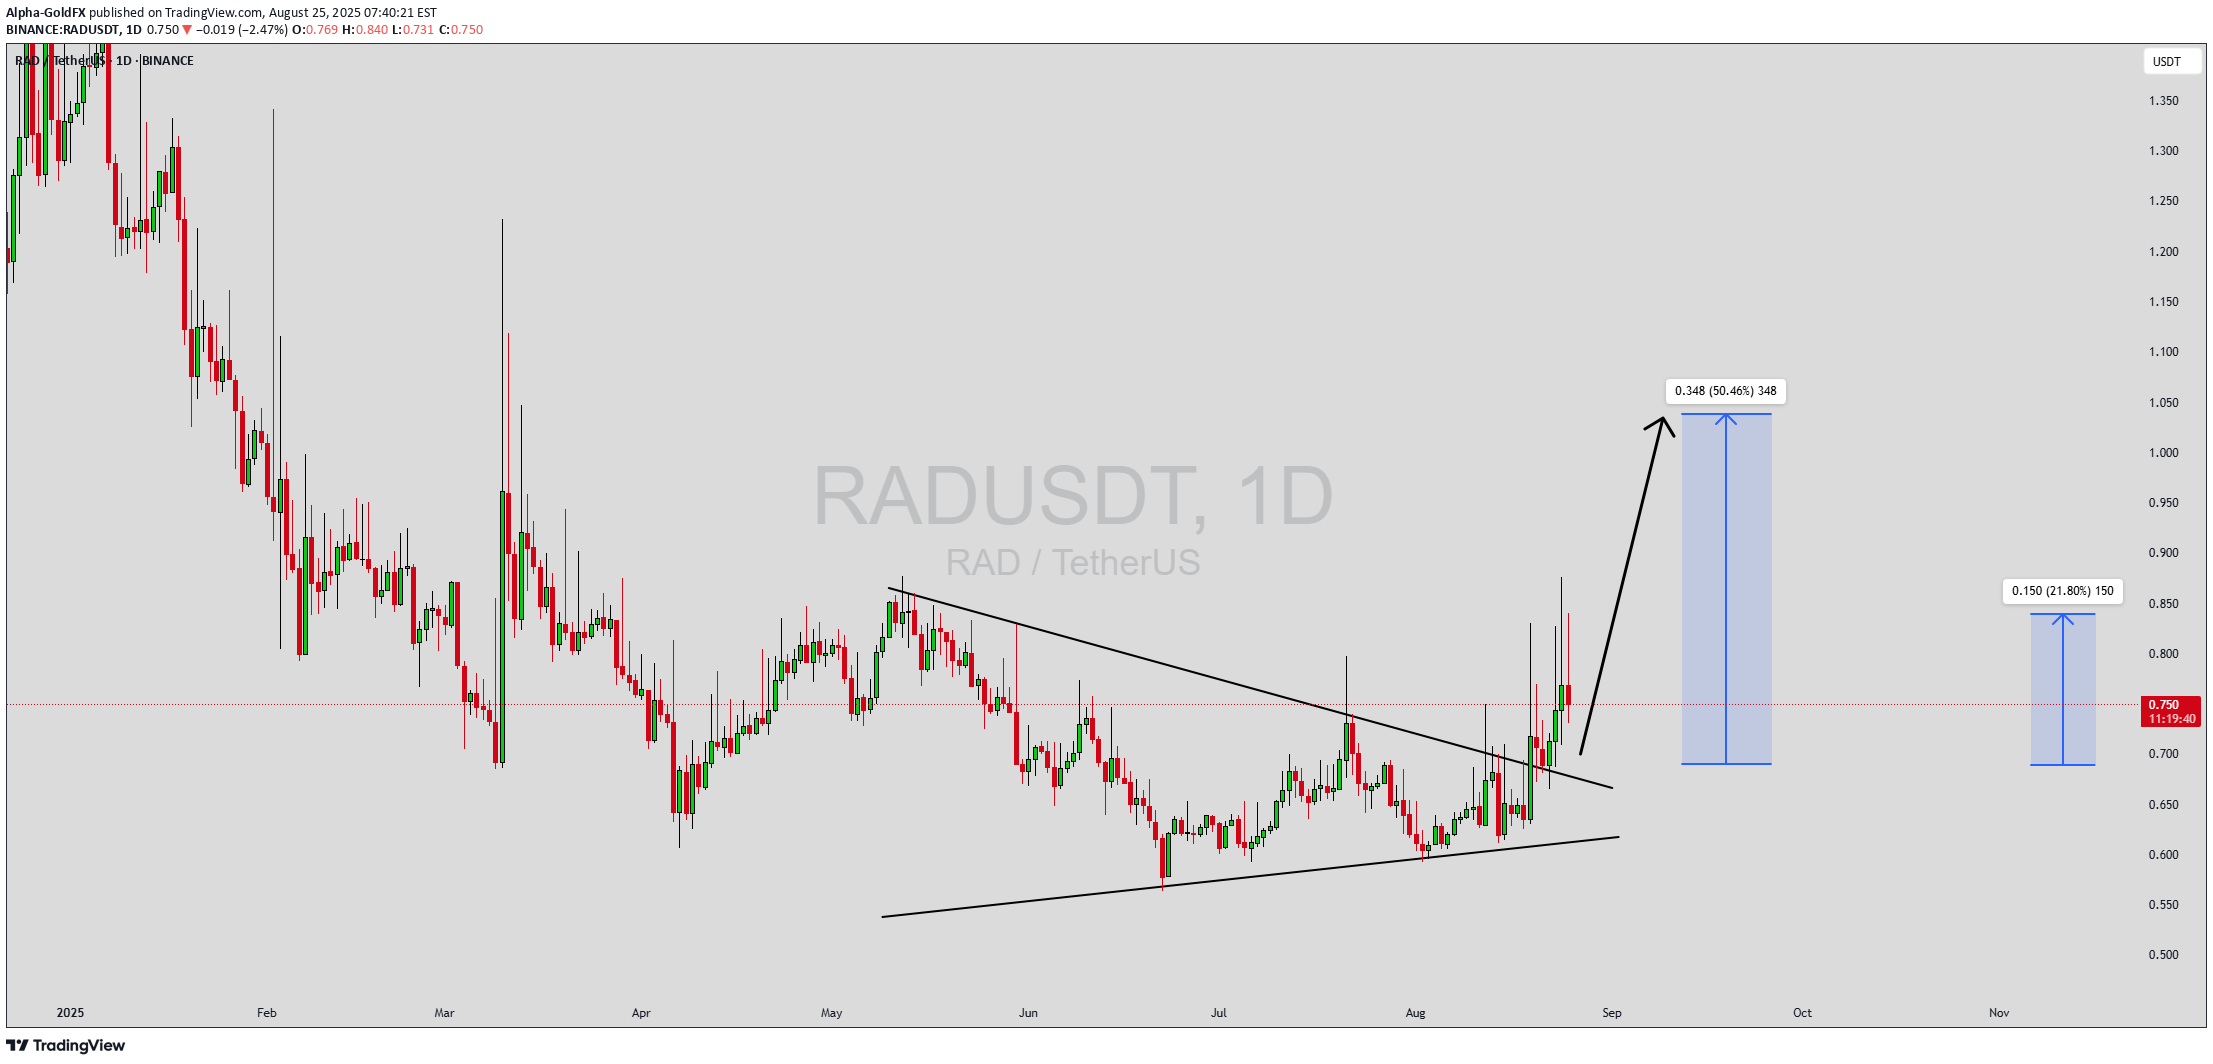
RADUSDT is currently forming a classic descending wedge pattern, a structure often recognized for its bullish reversal potential. This pattern indicates that while prices have been trending downward, the rate of decline has been slowing — often a sign that sellers are losing momentum and buyers are preparing to take control. A breakout above the upper trendline of the wedge could spark a strong upside move, especially with the supportive volume seen in recent trading sessions. Volume levels are holding steady, suggesting accumulation within this compression zone. When paired with a descending wedge setup, this usually strengthens the case for an imminent breakout. Traders and investors closely watching this pair will likely treat a clean breakout as a signal to enter long positions, aiming for potential gains in the range of 40% to 50% based on the measured move technique from the wedge’s widest part. The RAD project itself has been gaining visibility, which adds further strength to the technical breakout potential. With broader market recovery sentiment and increasing community support, RADUSDT could be setting up for a high-momentum rally. The confluence of price structure, volume, and investor interest makes this pair a standout candidate for bullish breakout setups on traders’ watchlists. ✅ Show your support by hitting the like button and ✅ Leaving a comment below! (What is You opinion about this Coin) Your feedback and engagement keep me inspired to share more insightful market analysis with you!

Bithereum_io
RADUSDT 1D
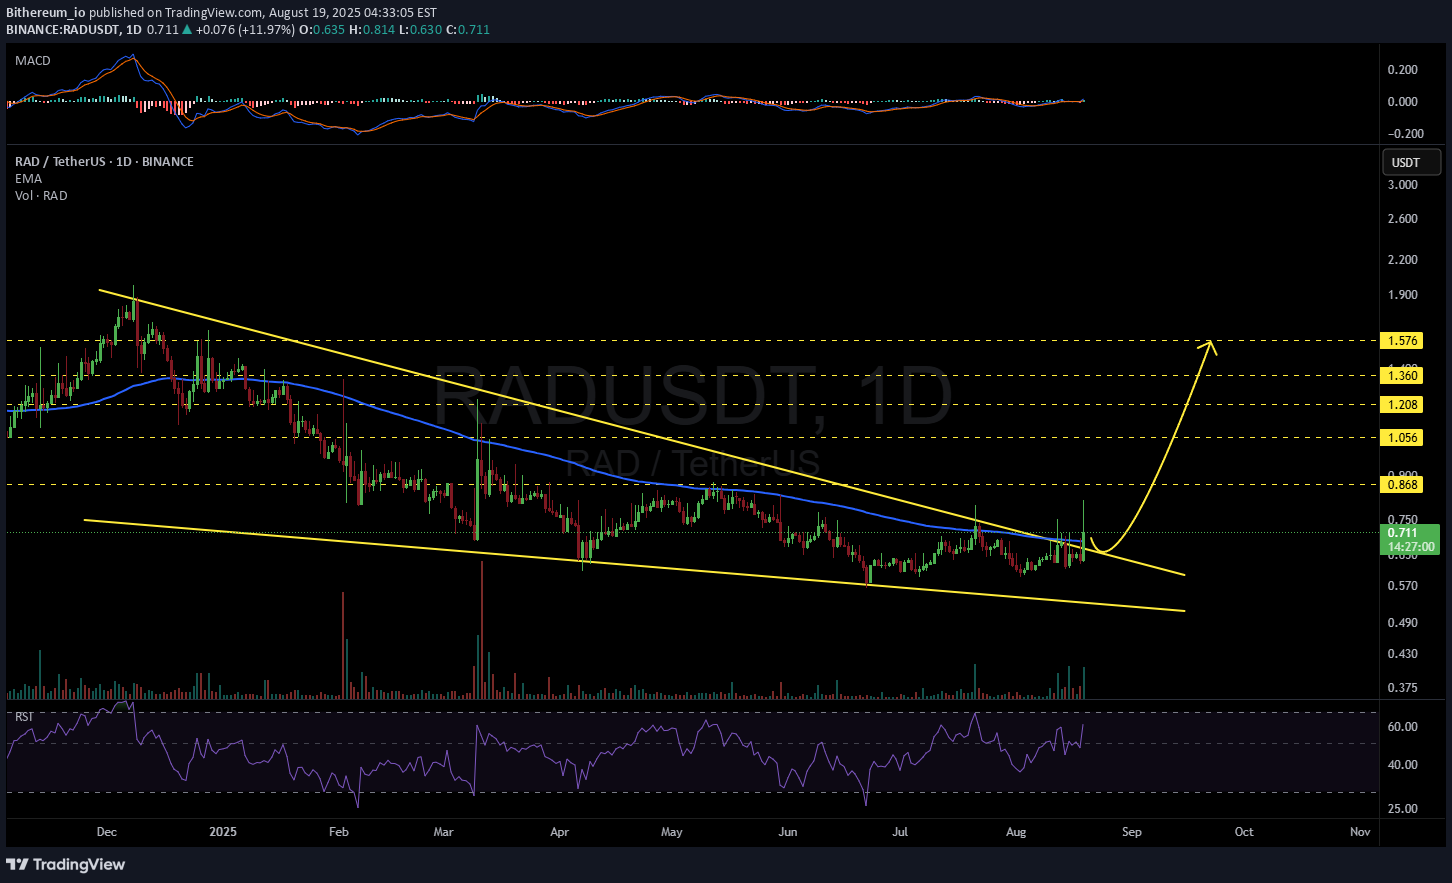
#RAD after several attempts to break above the falling wedge, finally managed to break out of the pattern and also above the daily EMA100. It can go higher only if a successful retest is completed and the support holds. In this case, the potential targets are: 🎯 $0.868 🎯 $1.056 🎯 $1.208 🎯 $1.360 🎯 $1.576 ⚠️ As always, use a tight stop-loss and apply proper risk management.
Alpha-GoldFX
RADUSDT Forming Descending Wedge
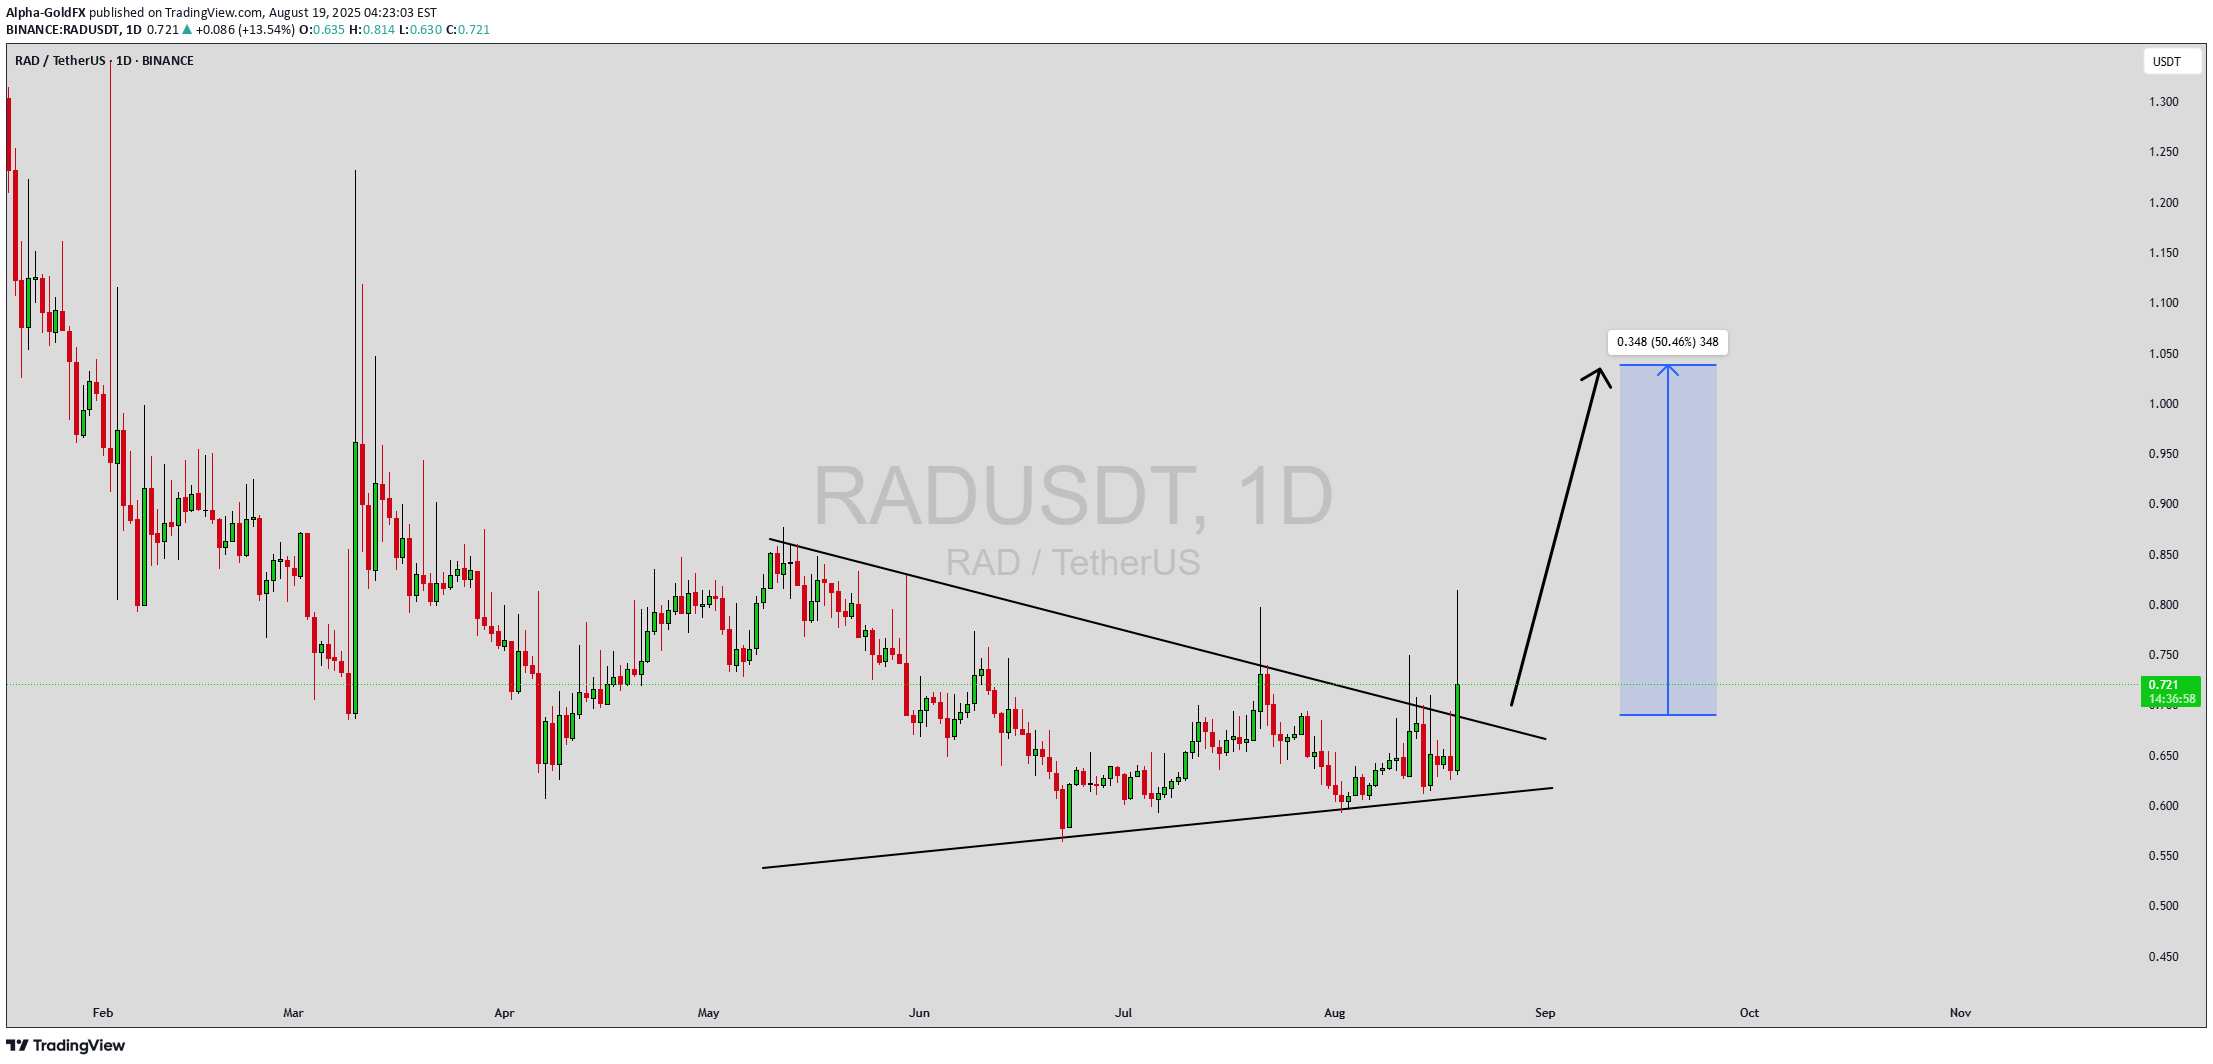
RADUSDT is currently forming a classic descending wedge pattern, a structure often recognized for its bullish reversal potential. This pattern indicates that while prices have been trending downward, the rate of decline has been slowing — often a sign that sellers are losing momentum and buyers are preparing to take control. A breakout above the upper trendline of the wedge could spark a strong upside move, especially with the supportive volume seen in recent trading sessions. Volume levels are holding steady, suggesting accumulation within this compression zone. When paired with a descending wedge setup, this usually strengthens the case for an imminent breakout. Traders and investors closely watching this pair will likely treat a clean breakout as a signal to enter long positions, aiming for potential gains in the range of 40% to 50% based on the measured move technique from the wedge’s widest part. The RAD project itself has been gaining visibility, which adds further strength to the technical breakout potential. With broader market recovery sentiment and increasing community support, RADUSDT could be setting up for a high-momentum rally. The confluence of price structure, volume, and investor interest makes this pair a standout candidate for bullish breakout setups on traders’ watchlists. ✅ Show your support by hitting the like button and ✅ Leaving a comment below! (What is You opinion about this Coin) Your feedback and engagement keep me inspired to share more insightful market analysis with you!

CryptoWithJames
RADUSDT UPDATE
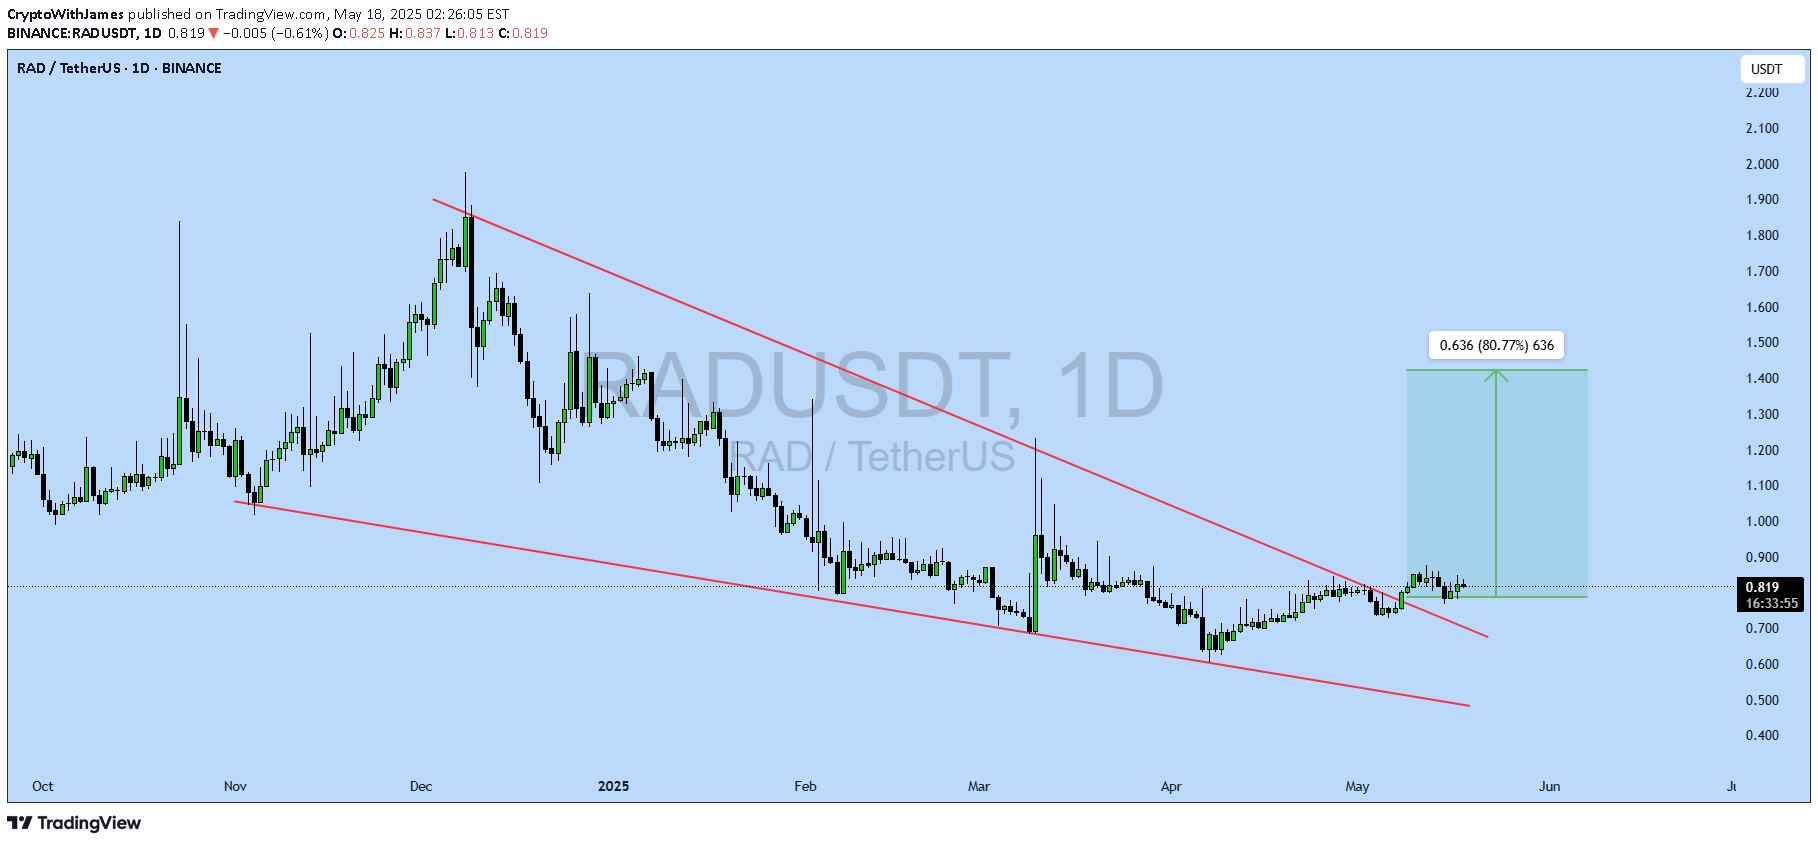
Pattern: Falling Wedge BreakoutCurrent Price: \$0.819Target Price: \$1.45Target % Gain: 80.77%Technical Analysis: RAD has broken out of a long-term falling wedge on the 1D chart. Price is consolidating above the breakout level, signaling potential continuation. A measured move targets 80% upside.Time Frame: 1DRisk Management Tip: Always use proper risk management.

llchartistll
RAD

like the trades I posted already it a long-term trade and a very good opportunity to trade stick with the stoploss best wishes .

Cryptoanalyzes
Idea for the RAD from Cryptoanalyzes.com

We may have found a bottom. Wait until you see growth above $2.Powerd By Cryptoanalyzes.com

Dezh
Trading opportunity for RADUSDT

Based on technical factors there is a Buy position in :📊 RADUSDT🔵 Buy Now 🪫Stop loss 1.260🔋Target 1.490📏 R/R 1.6💸RISK : 1%We hope it is profitable for you ❤️Please support our activity with your likes👍 and comments📝

RiskandReward
Rad Usdt 4H Buy

Rad Usdt A nice volume buy came in 4H. If it can maintain the volume, we will push it to $1.9, which is the size of the bowl, it should show a correction area there. I will monitor that area well and determine the entry area. I expect it to go between $7-10 in the medium term. Y.T.D
RiskandReward
Rad Usdt 4H Buy
Rad Usdt A nice volume buy came in 4H. If it can maintain the volume, we will push it to $1.9, which is the size of the bowl, it should show a correction area there. I will monitor that area well and determine the entry area. I expect it to go between $7-10 in the medium term. Y.T.D
Disclaimer
Any content and materials included in Sahmeto's website and official communication channels are a compilation of personal opinions and analyses and are not binding. They do not constitute any recommendation for buying, selling, entering or exiting the stock market and cryptocurrency market. Also, all news and analyses included in the website and channels are merely republished information from official and unofficial domestic and foreign sources, and it is obvious that users of the said content are responsible for following up and ensuring the authenticity and accuracy of the materials. Therefore, while disclaiming responsibility, it is declared that the responsibility for any decision-making, action, and potential profit and loss in the capital market and cryptocurrency market lies with the trader.