
MAGIC
Treasure
| تریدر | نوع سیگنال | حد سود/ضرر | زمان انتشار | مشاهده پیام |
|---|---|---|---|---|
خرید | حد سود: تعیین نشده حد ضرر: تعیین نشده | 12/30/2025 |

Price Chart of Treasure
سود 3 Months :
سیگنالهای Treasure
Filter
Sort messages by
Trader Type
Time Frame
#MAGIC/USDT Bullish Reversal in MAGICUSDT Accumulation Zone

#MAGIC The price is moving in a descending channel on the 1-hour timeframe. It has reached the lower boundary and is heading towards breaking above it, with a retest of the upper boundary expected. We have a downtrend on the RSI indicator, which has reached near the lower boundary, and an upward rebound is expected. There is a key support zone in green at 0.0928. The price has bounced from this level multiple times and is expected to bounce again. We have a trend towards stability above the 100-period moving average, as we are moving close to it, which supports the upward movement. Entry price: 0.0939 First target: 0.0961 Second target: 0.0984 Third target: 0.1010 Stop loss: Below the support zone in green. Don't forget a simple thing: capital management. For inquiries, please leave a comment. Thank you.
#MAGIC/USDT Bullish Reversal in MAGICUSDT Accumulation Zone in
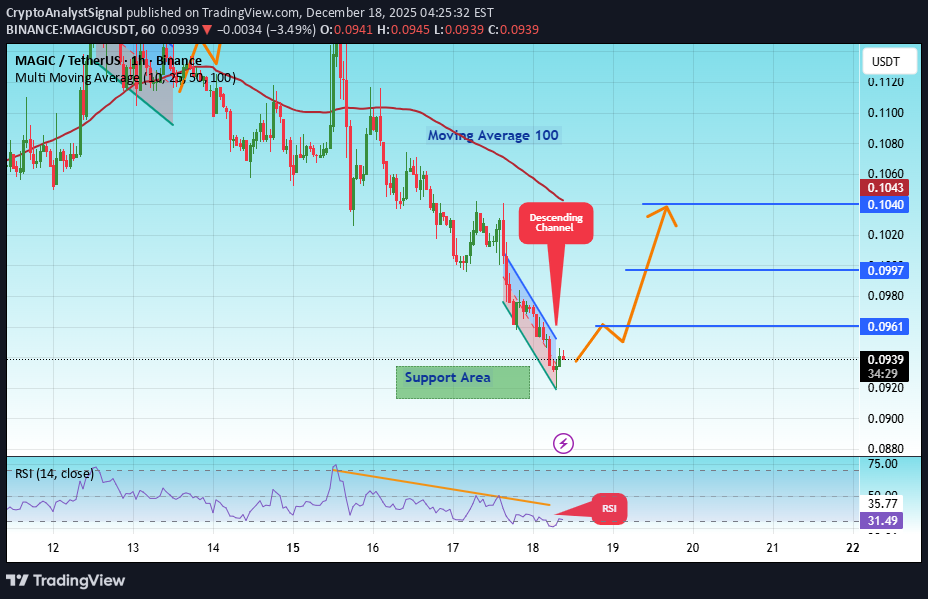
#MAGIC The price is moving in a descending channel on the 1-hour timeframe. It has reached the lower boundary and is heading towards breaking above it, with a retest of the upper boundary expected. We have a downtrend on the RSI indicator, which has reached near the lower boundary, and an upward rebound is expected. There is a key support zone in green at 0.0920. The price has bounced from this level multiple times and is expected to bounce again. We have a trend towards consolidation above the 100-period moving average, as we are moving close to it, which supports the upward movement. Entry price: 0.0939 First target: 0.0961 Second target: 0.0997 Third target: 0.1040 Don't forget a simple principle: money management. Place your stop-loss below the support zone in green. For any questions, please leave a comment. Thank you.#MAGIC First target: 0.0961 Reached Second target: 0.0997 Reached Third target: 0.1040 Reached
#MAGIC/USDT Bullish Reversal in MAGICUSDT Accumulation Zone

#MAGIC The price is moving in a descending channel on the 1-hour timeframe. It has reached the lower boundary and is heading towards a breakout, with a retest of the upper boundary expected. We are seeing a bearish trend in the Relative Strength Index (RSI), which has reached near the lower boundary, and an upward bounce is expected. There is a key support zone in green at 0.1090, and the price has bounced from this level several times. Another bounce is expected. We are seeing a trend towards stabilizing above the 100-period moving average, which we are approaching, supporting the upward trend. Entry Price: 0.1122 First Target: 0.1149 Second Target: 0.1180 Third Target: 0.1216 Remember a simple principle: Money Management. Place your stop-loss order below the green support zone. For any questions, please leave a comment. Thank you.
#MAGIC/USDT Bullish Reversal in MAGICUSDT Accumulation Zone
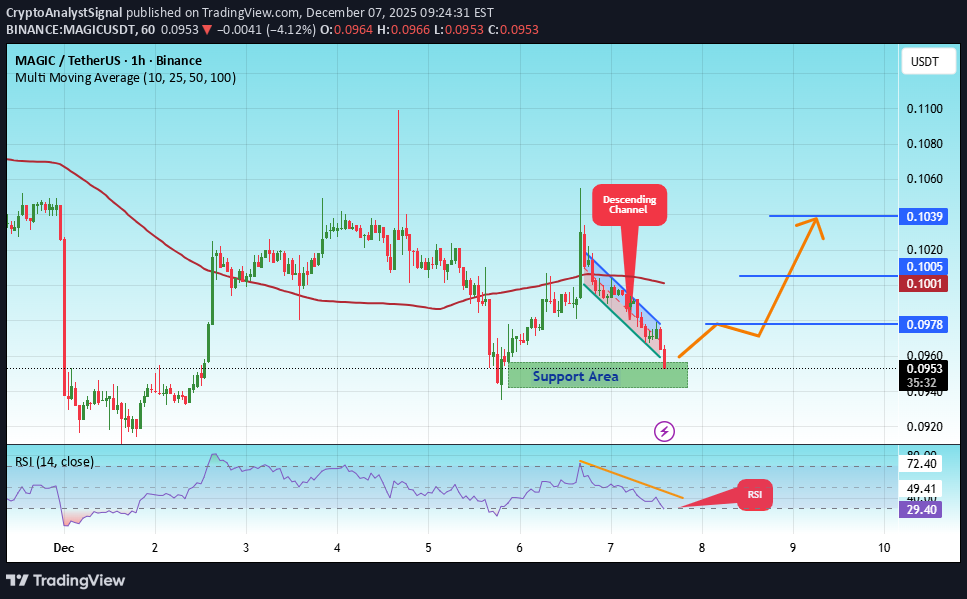
#MAGIC The price is moving in a descending channel on the 1-hour timeframe. It has reached the lower boundary and is heading towards breaking above it, with a retest of the upper boundary expected. We have a downtrend on the RSI indicator, which has reached near the lower boundary, and an upward rebound is expected. There is a key support zone in green at 0.0950. The price has bounced from this level multiple times and is expected to bounce again. We have a trend towards stability above the 100-period moving average, as we are moving close to it, which supports the upward movement. Entry price: 0.0961 First target: 0.0978 Second target: 0.1005 Third target: 0.1039 Don't forget a simple principle: money management. Place your stop-loss below the support zone in green. For any questions, please leave a comment. Thank you.#MAGIC First target: 0.0978 Reached Second target: 0.1005 Reached Third target: 0.1039 Reached
تحلیل شگفتانگیز MAGIC/USDT: آماده صعود از منطقه انباشت!
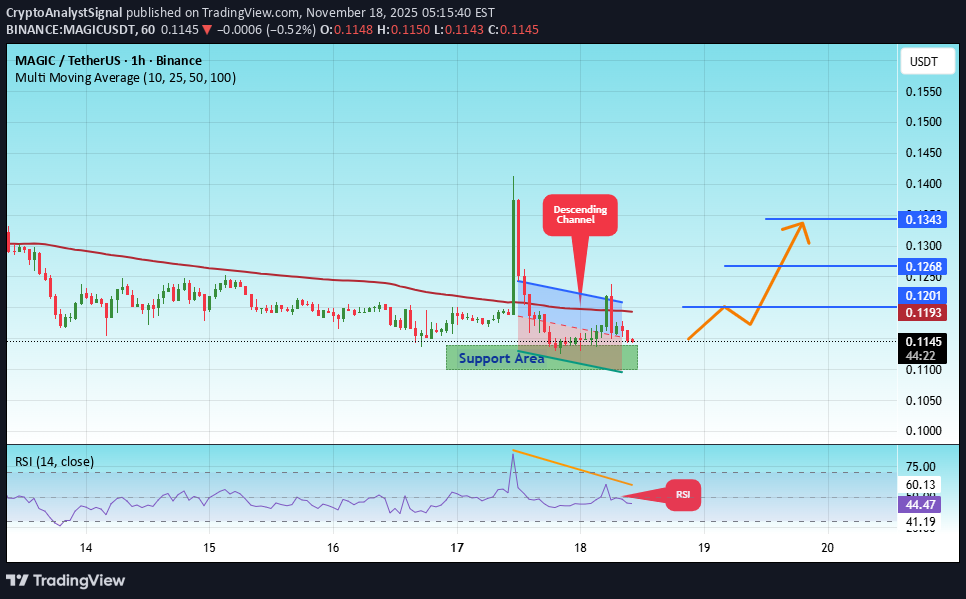
#MAGIC The price is moving within an ascending channel on the 1-hour timeframe and is adhering to it well. It is poised to break out strongly and retest the channel. We have a downtrend line on the RSI indicator that is about to break and retest, which supports the upward move. There is a key support zone in green at 0.1111, representing a strong support point. We have a trend of consolidation above the 100-period moving average. Entry price: 0.1146 First target: 0.1194 Second target: 0.1268 Third target: 0.1343 Don't forget a simple money management rule: Place your stop-loss order below the green support zone. Once you reach the first target, save some money and then change your stop-loss order to an entry order. For any questions, please leave a comment. Thank you.#MAGIC First target: 0.1194 Reached Second target: 0.1268 Reached#MAGIC First target: 0.1194 Reached Second target: 0.1268 Reached Third target: 0.1343 Reached
سیگنال خرید فوری: معکوس شدن صعودی MAGIC/USDT از منطقه کلیدی حمایت!

#MAGIC The price is moving within an ascending channel on the 1-hour timeframe and is holding well. It is poised to break out strongly and retest the channel. We have a downtrend line on the RSI indicator that is about to break and retest, which supports the upward move. There is a key support zone in green at 0.1250, representing a strong support point. We have a trend of consolidation above the 100-period moving average. Entry price: 0.1270 First target: 0.1320 Second target: 0.1378 Third target: 0.1444 Don't forget a simple money management rule: Place your stop-loss order below the green support zone. Once you reach the first target, save some money and then change your stop-loss order to an entry order. For any questions, please leave a comment. Thank you.#MAGIC First target: 0.1320 Reached Second target: 0.1378 Reached Third target: 0.1444 Reached

سیگنال صعودی قدرتمند برای رمزارزهای گیمینگ و توکن MAGIC: آیا زمان خرید فرا رسیده است؟
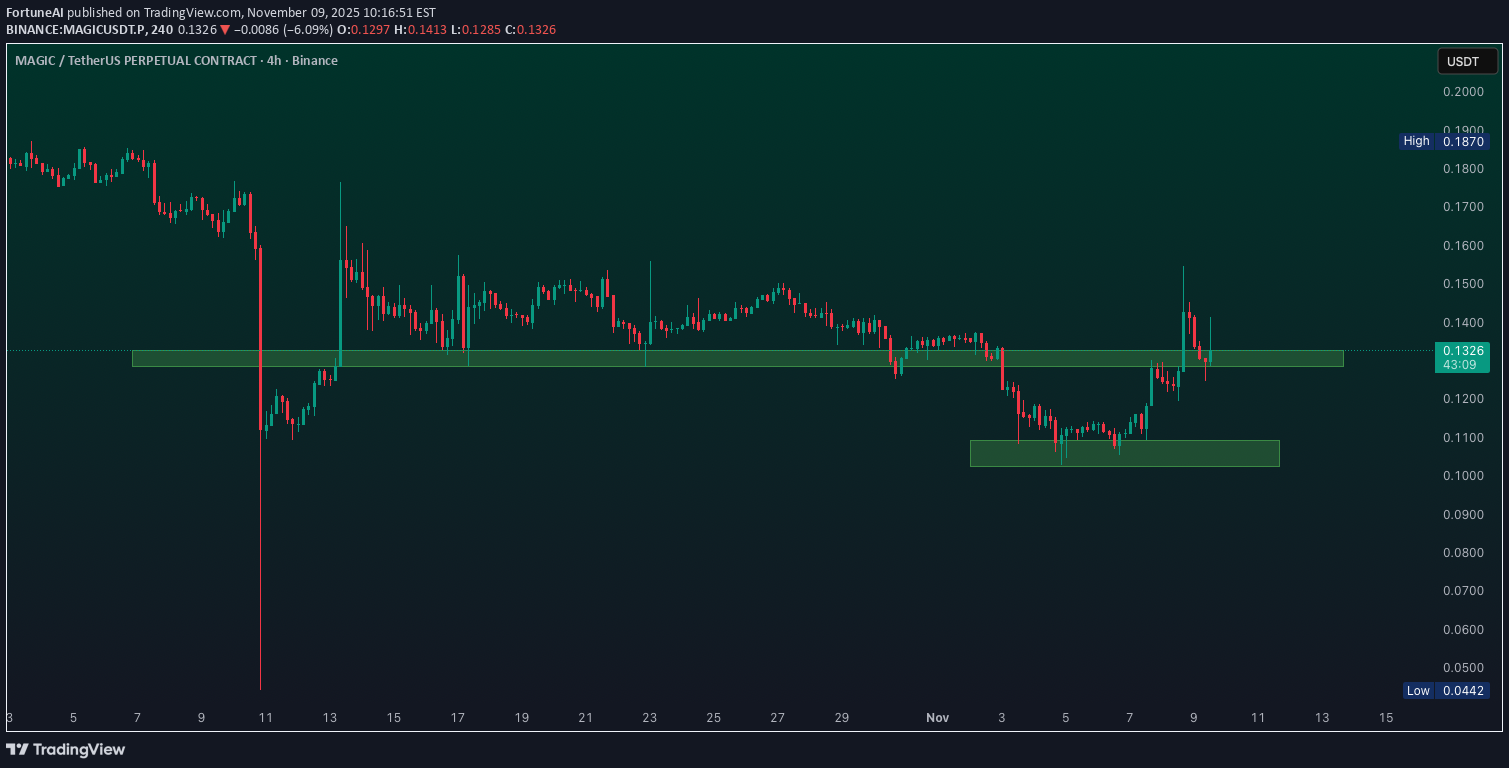
Gaming Coins are looking Bullish and MAGIC Technicals also looking Bullish on HTFMAGIC STILL CONSOLIDATING
تحلیل جادویی MAGIC/USDT: آیا قیمت آماده انفجار صعودی در این منطقه حمایتی است؟
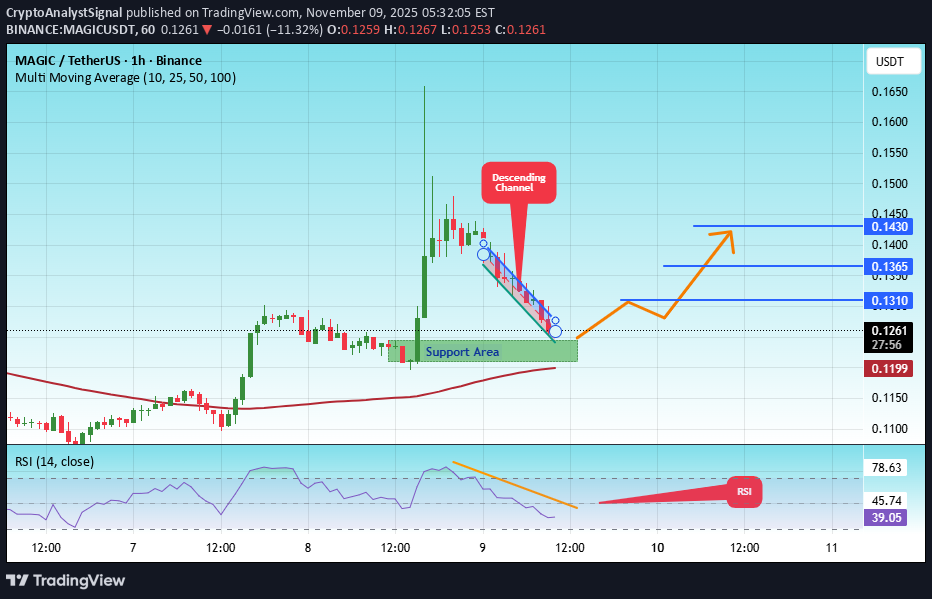
#MAGIC The price is moving within an ascending channel on the 1-hour timeframe and is adhering to it well. It is poised to break out strongly and retest the channel. We have a downtrend line on the RSI indicator that is about to break and retest, which supports the upward move. There is a key support zone in green at 0.1225, representing a strong support point. We have a trend of consolidation above the 100-period moving average. Entry price: 0.1265 First target: 0.1310 Second target: 0.1365 Third target: 0.1430 Don't forget a simple money management rule: Place your stop-loss order below the green support zone. Once you reach the first target, save some money and then change your stop-loss order to an entry order. For any questions, please leave a comment. Thank you.#MAGIC First target: 0.1310 Reached Second target: 0.1365 Reached Third target: 0.1430 Reached
تحلیل فنی فوری: آیا توکن جادویی (MAGIC) آماده انفجار قیمتی است؟ (سیگنال خرید با اهداف مشخص)
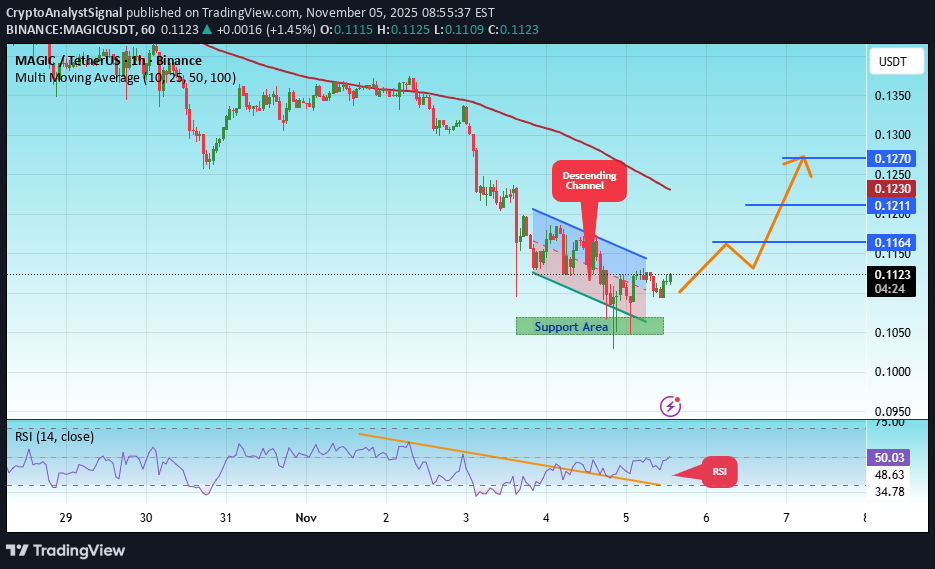
#MAGIC The price is moving within an ascending channel on the 1-hour timeframe and is adhering to it well. It is poised to break out strongly and retest the channel. We have a downtrend line on the RSI indicator that is about to break and retest, which supports the upward move. There is a key support zone in green at 0.1055, representing a strong support point. We have a trend of consolidation above the 100-period moving average. Entry price: 0.1123 First target: 0.1164 Second target: 0.1211 Third target: 0.1270 Don't forget a simple money management rule: Place your stop-loss order below the green support zone. Once you reach the first target, save some money and then change your stop-loss order to an entry order. For any questions, please leave a comment. Thank you.#MAGIC First target: 0.1164 Reached Second target: 0.1211 Reached Third target: 0.1270 Reached
تحلیل تکنیکال جادویی (MAGIC/USDT): آیا این گوه نزولی به زودی میشکند؟
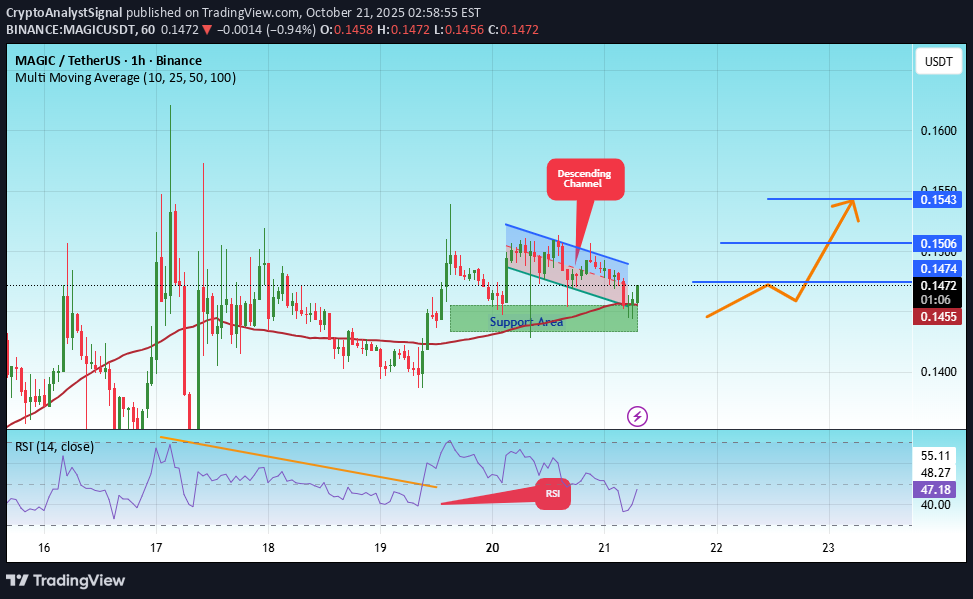
#MAGIC The price is moving within a descending channel on the 1-hour frame, adhering well to it, and is heading for a strong breakout and retest. We have a bearish trend on the RSI indicator that is about to be broken and retested, which supports the upward breakout. There is a major support area in green at 0.1445, which represents a strong support point. We are heading for consolidation above the 100 moving average. Entry price: 0.1464 First target: 0.1474 Second target: 0.1506 Third target: 0.1543 Don't forget a simple matter: capital management. When you reach the first target, save some money and then change your stop-loss order to an entry order. For inquiries, please leave a comment. Thank you.#MAGIC First target: 0.1474 Reached Second target: 0.1506 Reached Third target: 0.1543 Reached
Disclaimer
Any content and materials included in Sahmeto's website and official communication channels are a compilation of personal opinions and analyses and are not binding. They do not constitute any recommendation for buying, selling, entering or exiting the stock market and cryptocurrency market. Also, all news and analyses included in the website and channels are merely republished information from official and unofficial domestic and foreign sources, and it is obvious that users of the said content are responsible for following up and ensuring the authenticity and accuracy of the materials. Therefore, while disclaiming responsibility, it is declared that the responsibility for any decision-making, action, and potential profit and loss in the capital market and cryptocurrency market lies with the trader.