
KOMA
Koma Inu
| تریدر | نوع سیگنال | حد سود/ضرر | زمان انتشار | مشاهده پیام |
|---|---|---|---|---|
No results found. | ||||
Price Chart of Koma Inu
سود 3 Months :
سیگنالهای Koma Inu
Filter
Sort messages by
Trader Type
Time Frame

sladkamala123
تحلیل KOMA: آیا پامپ کوتاهمدت در راه است یا سقوط تا 0.0060 دلار؟
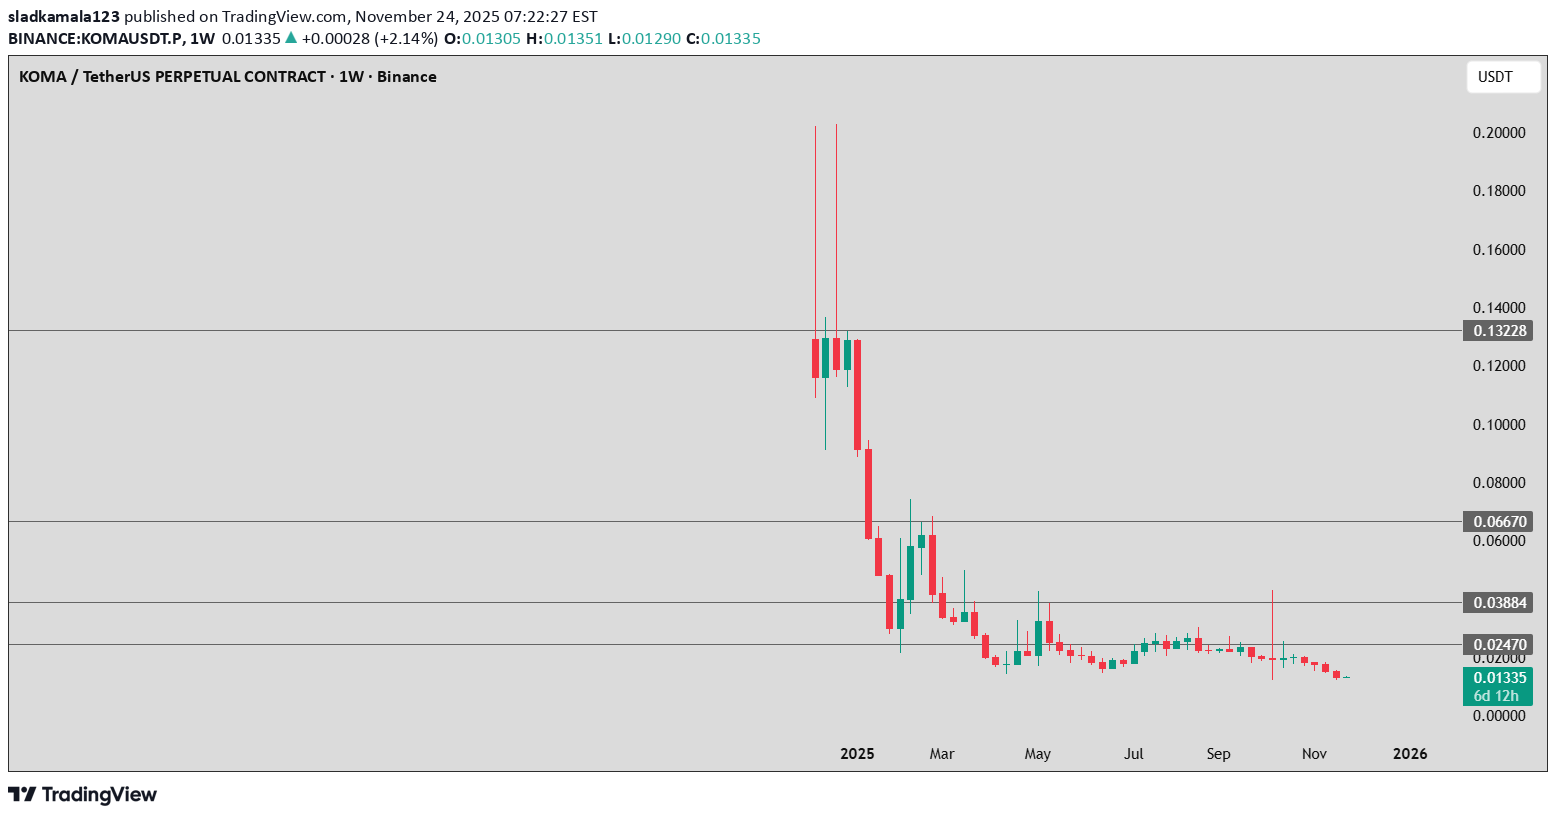
Bullish Scenario For the trend to reverse upward, the price must: Break above 0.0247 USDT Then break above 0.0388 USDT Only above 0.0667 USDT can we talk about a true trend reversal There are long wicks in the chart history, which means short-term pumps are possible. If a pump occurs, the targets are: 0.020 0.025 0.038 🔻 5. Bearish Scenario (currently the most likely) If the price falls below 0.012 USDT, it will very likely: test 0.010 USDT if that level fails → 0.0080 → 0.0060 USDT This aligns with the overall trend since the beginning of 2025.

CryptoNuclear
خروج KOMA از خط روند نزولی: آیا این شروع صعود است یا تله گاوی؟

Overview KOMA/USDT has finally delivered a significant technical signal after months of consolidation within a tight accumulation range. The latest daily candle successfully broke above a major descending trendline and a key horizontal resistance, signaling the early phase of a potential trend reversal from long-term bearish pressure to renewed bullish momentum. This breakout could represent a psychological shift in market sentiment — from distribution to accumulation — and may define the next major leg of price expansion if confirmed by volume and structure. --- Market Structure Insight Primary Trend: Bearish since early 2025, marked by consistent lower highs and lower lows. Structural Shift: A clear daily breakout above the descending trendline suggests the start of a higher-high structure formation. Key Zone (Accumulation Range): The 0.020–0.027 area has acted as a multi-month resistance zone, now potentially flipping into new structural support (S-R Flip). Momentum Confirmation: A strong breakout candle accompanied by volume expansion hints at growing institutional interest. --- Technical Pattern Breakdown The pattern combines two powerful structural elements: Descending Trendline Breakout → indicates exhaustion of long-term selling pressure. Range Accumulation Base → acts as the energy build-up phase before a new impulsive move. If the price performs a successful retest of the breakout zone, this pattern transitions into a trend reversal base, which historically precedes sustained bullish continuation phases. --- Bullish Scenario (Primary Bias) 1. Validation Conditions: Daily close above 0.027 with sustained trading above the breakout zone. Rising volume and RSI holding above the 50 line. 2. Continuation Setup: A clean retest followed by a higher low formation would confirm structural reversal. 3. Upside Targets: TP1: 0.0489 — First expansion resistance. TP2: 0.0633 — Mid-term structural level. TP3: 0.0935 — Major resistance zone. Extended targets: 0.128 – 0.169 if momentum persists. 4. Stop-Loss Placement: Below 0.020 or under the most recent swing low. 5. Risk/Reward Outlook: Strong R:R potential (>3R) from the breakout base with multi-tier scaling opportunities. --- Bearish Scenario (Alternative Bias) 1. Invalidation Trigger: Daily close below 0.020 or a re-entry into the previous range (false breakout). 2. Market Implications: A bull trap scenario could trigger a deeper correction toward 0.0142, the historical low support. 3. Volume Confirmation: A drop with rising sell volume would confirm distribution rather than accumulation. 4. Bias Reversal: If this occurs, the broader bearish structure remains intact and consolidation may resume. This type of breakout often marks the transition from accumulation to markup phase, particularly if confirmed with a successful retest and sustained buying volume. KOMA/USDT has just broken through the upper boundary of a long-standing downtrend — a technical milestone that could set the stage for medium-term reversal momentum. However, confirmation is key. Without a retest that holds, this move could remain a temporary liquidity sweep. Traders should closely monitor daily closes and reaction around the 0.027 zone to confirm whether this is a true structural reversal or merely a bull trap. #KOMA #KOMAUSDT #CryptoAnalysis #BreakoutTrading #TechnicalAnalysis #PriceAction #AltcoinWatch #CryptoMarket #TrendReversal #SupportResistance #RiskManagement

shahmir1000
KOMAUSDT.P
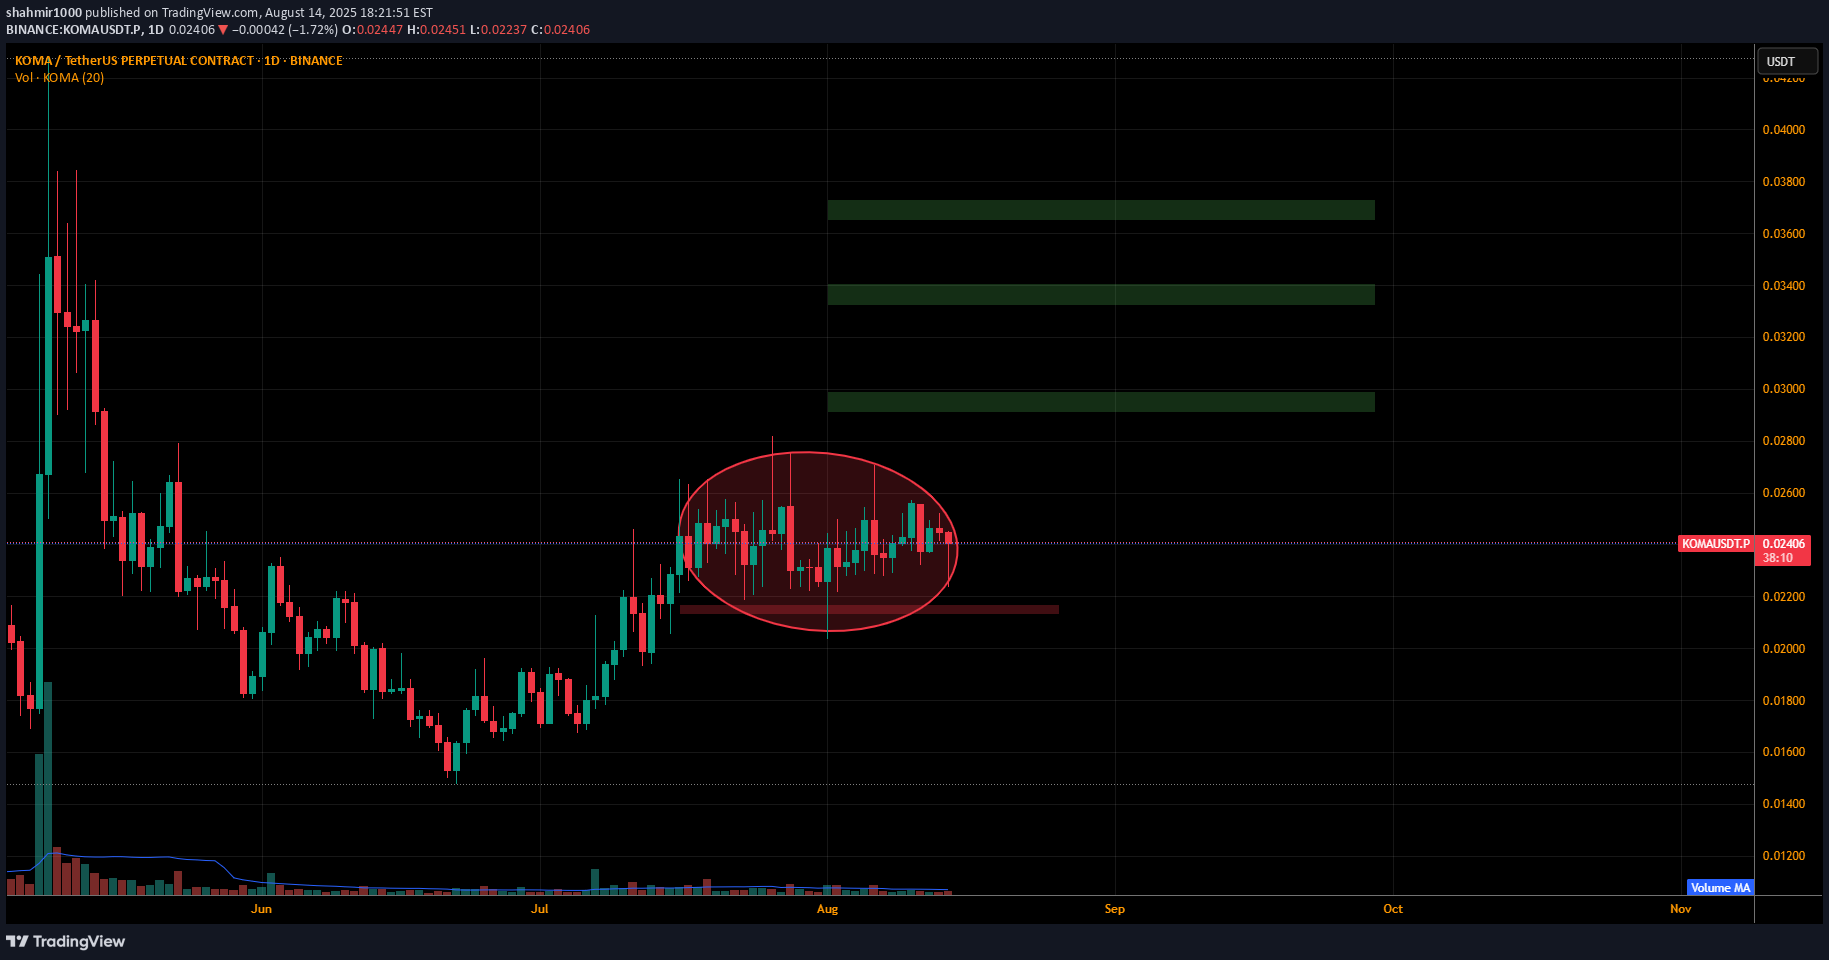
As soon the break out the ellipse successfully with bullish and strong volume our targets will be all the green rectangles. As we all know a lot of people got liquidated today. and after that a pullback can be seen with long wicked candle. This might be a trap.. We are still bullish biased. Just be careful and always put stop loss. If you want any analysis for any coin you can message me on tradingview. Thanks.. Keep following me.Please book 50% profit and rest s.l to entry...

Bithereum_io
KOMAUSDT 1D

#KOMA has broken above the descending resistance on the daily chart. It even entered the Ichimoku cloud but hasn’t been able to break out of it yet and is currently moving inside the cloud. Consider buying some #KOMA between $0.02601 and $0.02330.In case of a breakout above the Ichimoku cloud, the targets are:🎯 $0.03922🎯 $0.04512🎯 $0.05353🎯 $0.06424⚠️ Use a tight stop-loss.
CryptoNuclear


سیگنال آلفا کریپتو
⚜️ KOMA/USDT 🛒 محدوده خرید: 0.022 - 0.026 ⚡️ اهداف قیمت: 🎯 هدف اول: 0.0275 🎯 هدف دوم: 0.0305 🎯 هدف سوم: 0.0325 🎯 هدف چهارم: 0.0365 🎯 هدف پنجم: 0.0425 🎯 هدف ششم: 0.0475 🔺️ حد ضرر: 0.017 💵 میزان سرمایه پیشنهادی: ۵ درصد سرمایه 🔥 @Signal_Alpha 🔥
Disclaimer
Any content and materials included in Sahmeto's website and official communication channels are a compilation of personal opinions and analyses and are not binding. They do not constitute any recommendation for buying, selling, entering or exiting the stock market and cryptocurrency market. Also, all news and analyses included in the website and channels are merely republished information from official and unofficial domestic and foreign sources, and it is obvious that users of the said content are responsible for following up and ensuring the authenticity and accuracy of the materials. Therefore, while disclaiming responsibility, it is declared that the responsibility for any decision-making, action, and potential profit and loss in the capital market and cryptocurrency market lies with the trader.