
GT
GateToken
| تریدر | نوع سیگنال | حد سود/ضرر | زمان انتشار | مشاهده پیام |
|---|---|---|---|---|
No results found. | ||||
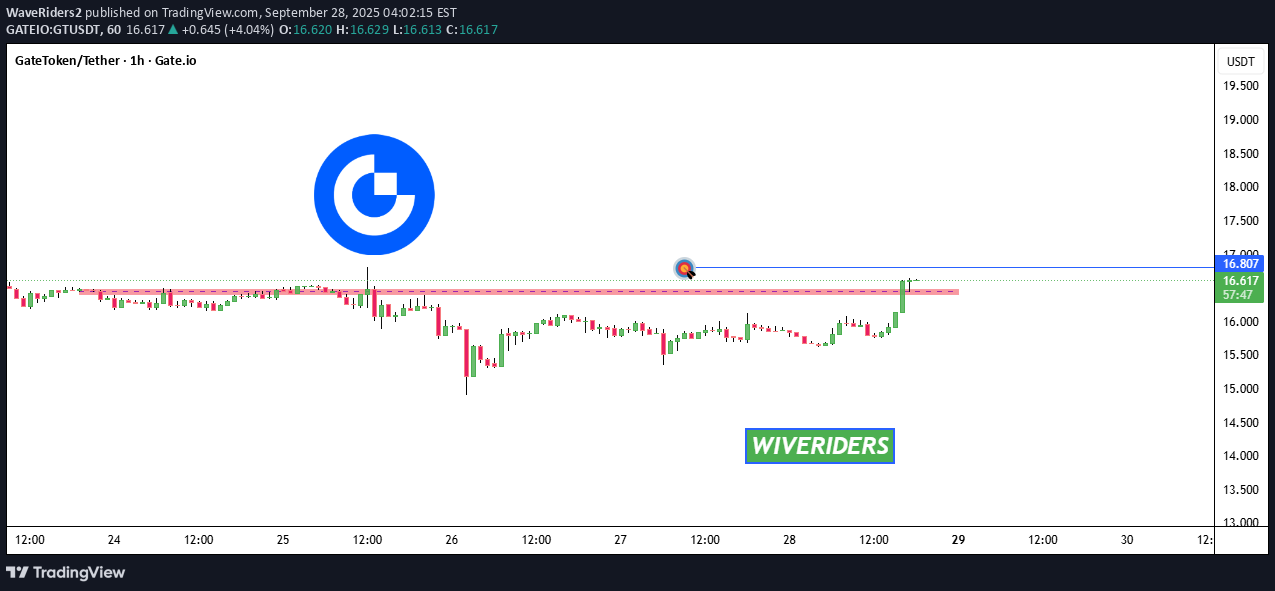
Price Chart of GateToken
سود 3 Months :
سیگنالهای GateToken
Filter
Sort messages by
Trader Type
Time Frame

WaveRiders2

Bromadic
#GT adding back again

Starting DCA once again on #GT, last trade idea had worked great for us, looking for a continuation after healthy retracement

S2A9
$GT’s Inverted Adam & Eve Pattern Targets $13.50

Analysis: On the weekly chart, GT is forming an inverted Adam & Eve pattern, a bearish reversal signal. The price is below the 20-week SMA ($15.90), and trading volume is decreasing on rebounds, indicating reduced buyer interest. A break below $15.30 could trigger a sharp decline.Key Levels:Support: $14.50, $13.50Resistance: $15.60, $16.00Target: $13.50Outlook: Short on a break below $15.30 with a stop loss above $15.90. Target $13.50 for a 13%+ decline. Watch for volume spike on the breakdown.
S2A9
$GT’s Break Below 200-EMA Signals $14.00 Target

Analysis: GT has broken below the 200-day EMA ($15.50) on the daily chart, a significant bearish signal. The price is forming a bearish flag pattern, with the RSI at 42 trending downward. Recent posts on X highlight GT’s weak market structure, supporting a bearish bias.Key Levels:Support: $14.50, $14.00Resistance: $15.50, $16.00Target: $14.00Outlook: Short on a close below $15.50 with a stop loss above $15.80. Target $14.00 for a 10% drop. Monitor for flag breakdown confirmation.
S2A9
$GT’s Bearish Channel Targets $13.80 Support

Analysis: GT is trading within a descending channel on the daily chart, with the price rejecting the upper trendline at $16.00. The RSI is at 40, nearing oversold but with room for further downside. Volume is higher on bearish candles, indicating seller dominance.Key Levels:Support: $14.50, $13.80Resistance: $15.80, $16.00Target: $13.80Outlook: Short on a rejection at $15.80 with a stop loss above $16.20. Target $13.80 for a 10%+ decline. Watch channel boundaries for price action.
S2A9
$GT’s Lower Highs Confirm Bearish Trend to $14.2

Analysis: On the 4-hour chart, GT is forming lower highs, signaling a bearish trend. The price is below the 50-period SMA ($15.75), and the ADX is rising, indicating strengthening bearish momentum. Support at $15.30 was breached, setting up a move toward the next key level.Key Levels:Support: $14.50, $14.20Resistance: $15.60, $16.00Target: $14.20Outlook: Short on a retest of $15.60 with a stop loss above $16.00. Target $14.20 for a 9% drop. Monitor ADX for trend strength.
S2A9
$GT’s Failure at $16.00 Resistance Targets $13.5

Analysis: GT failed to break the $16.00 resistance on the daily chart, forming a bearish shooting star candle. The price is below the 50-day SMA ($15.80), and the MACD is showing a bearish crossover. Declining volume indicates fading bullish conviction, aligning with broader altcoin weakness.Key Levels:Support: $14.50, $13.50Resistance: $16.00, $17.20Target: $13.50Outlook: Short on a close below $15.60 with a stop loss above $16.00. Target $13.50 for a 13%+ decline. Watch for bearish follow-through.
S2A9
$GT’s Overbought RSI Signals Pullback to $14.5

Analysis: The 1-hour chart shows GT trading near the upper Bollinger Band ($16.20) with an RSI of 78, indicating overbought conditions. A bearish divergence is forming, as the RSI declines while price tests resistance at $15.80. Low volume on recent highs suggests fading momentum.Key Levels:Support: $14.80, $14.50Resistance: $15.80, $16.20Target: $14.50Outlook: Short on a rejection at $15.80 with a stop loss above $16.20. Target $14.50 for a 7% pullback. Monitor RSI for continued divergence.
S2A9
$GT Forms Bearish Head and Shoulders, Eyes $14.00

Analysis: On the 4-hour chart, GT is forming a head and shoulders pattern with a neckline at $15.50. The price is trading below the 20-day SMA ($15.70), and the Stochastic Oscillator is in overbought territory, signaling a potential reversal. A breakdown below $15.50 could accelerate selling.Key Levels:Support: $14.50, $14.00Resistance: $15.50, $16.00Target: $14.00Outlook: Short on a break below $15.50 with a stop loss above $16.00. Target $14.00 for a 10% drop. Watch for confirmation via increased volume on the breakdown.
S2A9
$GT Bearish Breakdown Below $15.30 Targets $13.80

Analysis: GT has broken below the 50-day SMA ($15.80) on the daily chart, confirming a bearish shift in market structure. The RSI at 45 is trending downward, and declining volume on rebounds suggests weak buying interest. A retest of the broken support at $15.30 failed, aligning with a bearish engulfing candle.Key Levels:Support: $14.50, $13.80Resistance: $15.30 (former support), $16.00Target: $13.80Outlook: Short on a close below $15.30 with a stop loss above $15.80. Target $13.80 for a 10%+ decline. Monitor for continued selling pressure.
Disclaimer
Any content and materials included in Sahmeto's website and official communication channels are a compilation of personal opinions and analyses and are not binding. They do not constitute any recommendation for buying, selling, entering or exiting the stock market and cryptocurrency market. Also, all news and analyses included in the website and channels are merely republished information from official and unofficial domestic and foreign sources, and it is obvious that users of the said content are responsible for following up and ensuring the authenticity and accuracy of the materials. Therefore, while disclaiming responsibility, it is declared that the responsibility for any decision-making, action, and potential profit and loss in the capital market and cryptocurrency market lies with the trader.