
FRONT
Frontier
| تریدر | نوع سیگنال | حد سود/ضرر | زمان انتشار | مشاهده پیام |
|---|---|---|---|---|
No results found. | ||||
Price Chart of Frontier
سود 3 Months :
سیگنالهای Frontier
Filter
Sort messages by
Trader Type
Time Frame

Bullish frontier scenario

Lost. Rejected. Reclaim. Confirmation. Higher high.

FRONTUSDT UPDATE

#FRONTUSDT UPDATE Hey dear traders hope you are enjoying trading and analysis with our team. we are here to discuss about FRONTUSDT Falling wedge Break out done in 12h time frame ✅ Expecting massive Bullish wave 📈

Front için Long setup.

Front entry stop and target zones are available on the chart. Good luck YTD to everyone. Everyone should do their own analysis...

FRONTUSDT

We can attempt to buy FRONTUSDT from specified level if it break LH , also making wedge pattern (reversal pattern) , also bullish divergence occur indicate that it moves upward. SL , TP mention in chart.


Is FRONTUSDT looking for another leg down?

EnF Breakout Strategy signaled SELL on FRONTUSDT See idea for breakout entry, targets and stoploss Only enter the trade when the price breaks below entry Check out more on the script: To get access to this script, DM me
FRONTUSDT going for a lower low?

EnF Breakout Strategy signaled SELL on FRONTUSDT See idea for breakout entry, targets and stoploss Only enter the trade when the price breaks below entry Check out more on the script: To get access to this script, DM me
FRONTUSDT Aiming higher

EnF Breakout Strategy signaled a BUY on FRONTUSDT See idea for breakout entry, targets and stoploss Only enter the trade when the price breaks above entry Check out more on the script: To get access to this script, DM me

Frontusdt Update

Frontusdt Update Frontusdt is making symmetrical triangle in case of successful breakout we are expecting a bullish move of 40% in coming days

FRONTUSDT.1D
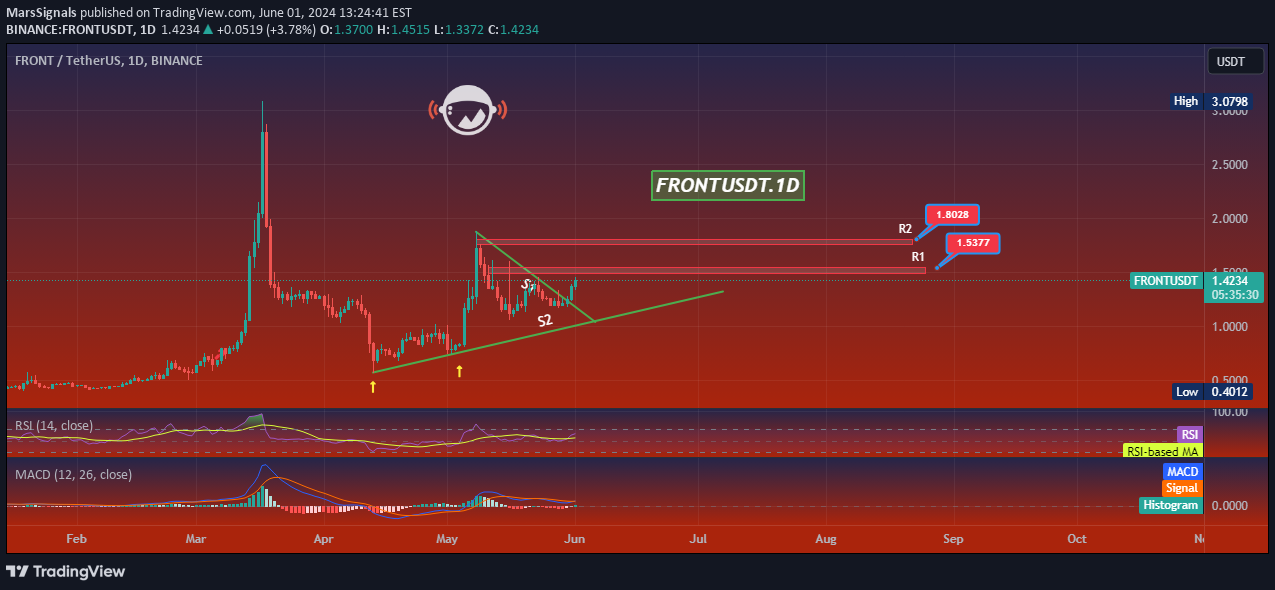
Here’s a thorough technical analysis of the FRONT/USDT daily chart: Price Action and Structure: The FRONT/USDT chart displays a sequence of higher lows, indicating an ascending trendline that suggests bullish sentiment among traders. However, a descending trendline also exists, forming a symmetrical triangle pattern, which often signals a consolidation phase before a potential breakout or breakdown. Notably, the price recently touched the ascending support trendline (‘S2’), highlighting its significance as a support zone. Technical Indicators: 1.RSI (Relative Strength Index): The RSI is currently at 54.50, slightly above the neutral 50 mark. This position indicates slight bullish momentum but still suggests caution as it’s not particularly high into bullish territory. 2.MACD (Moving Average Convergence Divergence): The MACD line is above the signal line and positive, which is typically a bullish signal. However, the closeness of the lines indicates that while bullish, the momentum is not overwhelmingly strong. Support and Resistance: •Support (S2): The support marked as ‘S2’ on the trendline is critical. A sustained hold above this line may encourage buyers to push prices higher as it reassures the market of underlying buying strength. •Resistance (R1 and R2): The immediate resistance at $1.5377 (R1) needs to be broken to confirm a bullish breakout from the current pattern. Beyond this, $1.8028 (R2) serves as the next significant challenge, which if surpassed, could signal a strong bullish phase. Projection and Strategy: The chart suggests a potential upward move if the price can maintain its position above the ascending trendline and break through the symmetrical triangle to the upside. An effective strategy might be to watch for a strong daily close above the upper descending trendline for a buy signal, with a stop-loss order placed below the ascending trendline to manage risk. Conclusion: In summary, FRONT/USDT presents a cautiously optimistic scenario for bulls, provided it can sustain the support and break above the immediate resistance levels. Given the current indicators and price structure, monitoring for a breakout with accompanying volume would be prudent before initiating any trades. As always, it’s vital to consider the wider market context and any relevant news that could impact price movements.
Disclaimer
Any content and materials included in Sahmeto's website and official communication channels are a compilation of personal opinions and analyses and are not binding. They do not constitute any recommendation for buying, selling, entering or exiting the stock market and cryptocurrency market. Also, all news and analyses included in the website and channels are merely republished information from official and unofficial domestic and foreign sources, and it is obvious that users of the said content are responsible for following up and ensuring the authenticity and accuracy of the materials. Therefore, while disclaiming responsibility, it is declared that the responsibility for any decision-making, action, and potential profit and loss in the capital market and cryptocurrency market lies with the trader.