
FLUX
Flux
| تریدر | نوع سیگنال | حد سود/ضرر | زمان انتشار | مشاهده پیام |
|---|---|---|---|---|
No results found. | ||||
Price Chart of Flux
سود 3 Months :
سیگنالهای Flux
Filter
Sort messages by
Trader Type
Time Frame

CryptoAnalystSignal
شکست قطعی FLUX/USDT: استراتژی صعود با اهداف قیمتی دقیق

#FLUX The price is moving in a descending channel on the 1-hour timeframe. It has reached the lower boundary and is heading towards breaking above it, with a retest of the upper boundary expected. We have a downtrend on the RSI indicator, which has reached near the lower boundary, and an upward rebound is expected. There is a key support zone in green at 0.1000. The price has bounced from this zone multiple times and is expected to bounce again. We have a trend towards consolidation above the 100-period moving average, as we are moving close to it, which supports the upward movement. Entry price: 0.1029 First target: 0.1048 Second target: 0.1072 Third target: 0.1098 Stop loss: Below the support zone in green. Don't forget a simple thing: capital management. For inquiries, please leave a comment. Thank you.#FLUX First target: 0.1048 Reached Second target: 0.1072 Reached
CryptoAnalystSignal
پیشبینی صعودی قوی برای FLUX/USDT: زمان ورود و اهداف قیمتی دقیق!

#FLUX The price is moving in a descending channel on the 1-hour timeframe. It has reached the lower boundary and is heading towards breaking above it, with a retest of the upper boundary expected. We have a downtrend on the RSI indicator, which has reached near the lower boundary, and an upward rebound is expected. There is a key support zone in green at 0.0970. The price has bounced from this level multiple times and is expected to bounce again. We have a trend towards consolidation above the 100-period moving average, as we are moving close to it, which supports the upward movement. Entry price: 0.0978 First target: 0.1005 Second target: 0.1035 Third target: 0.1069 Don't forget a simple principle: money management. Place your stop-loss below the support zone in green. For any questions, please leave a comment. Thank you.#FLUX First target: 0.1005 Reached Second target: 0.1035 Reached#FLUX First target: 0.1005 Reached Second target: 0.1035 Reached Third target: 0.1069 Reached

Cryptojobs
$FLUX - Update: [H4 view]

FLUX - Update: [H4 view] Bearish momentum for now 📉 Price seems to be stuck inside this downtrend channel. Upper big level to break: $ 0.1090 My bias: Double bottom likely & dump to visit the yellow zone again 📉 Will history repeat and are we gonna see a huge rally like we saw on 07/11? 🤔 📊 Key levels & more data in my chart. ⚠️ Not financial advice - DYOR. #trading
CryptoAnalystSignal
#FLUX/USDT breakout confirmed.
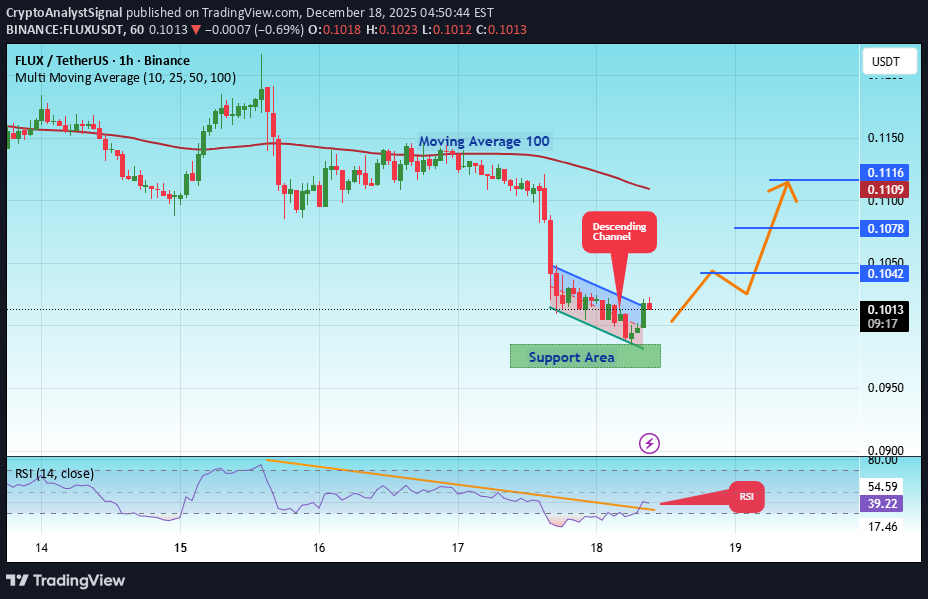
#FLUX The price is moving in a descending channel on the 1-hour timeframe. It has reached the lower boundary and is heading towards breaking above it, with a retest of the upper boundary expected. We have a downtrend on the RSI indicator, which has reached near the lower boundary, and an upward rebound is expected. There is a key support zone in green at 0.0974. The price has bounced from this level multiple times and is expected to bounce again. We have a trend towards consolidation above the 100-period moving average, as we are moving close to it, which supports the upward movement. Entry price: 0.1017 First target: 0.1042 Second target: 0.1078 Third target: 0.1109 Don't forget a simple principle: money management. Place your stop-loss order below the support zone in green. For any questions, please leave a comment. Thank you.#FLUX First target: 0.1042 Reached Second target: 0.1078 Reached
CryptoAnalystSignal
تحلیل فنی FLUX/USDT: آماده انفجار صعودی با الگوی گوه نزولی!
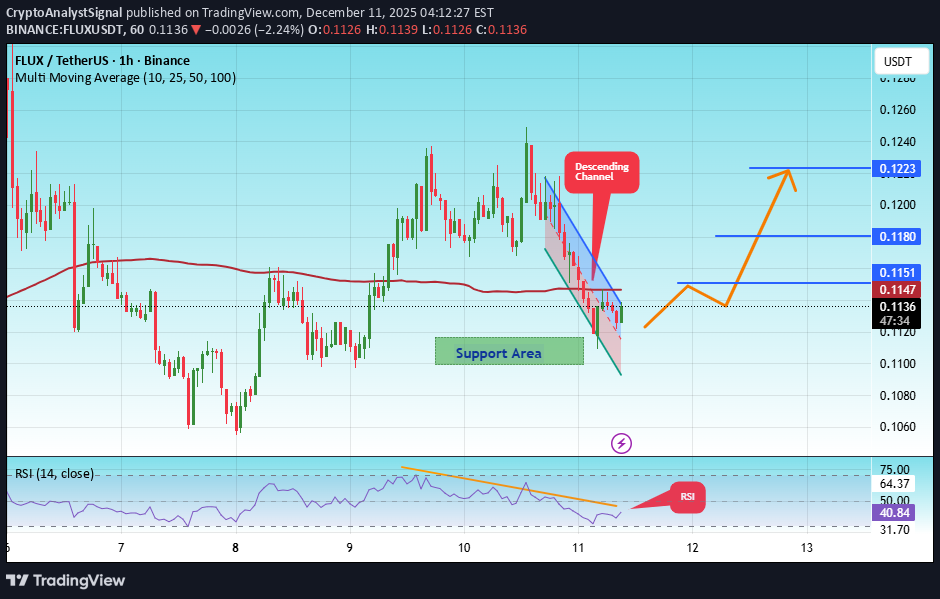
#FLUX The price is moving in a descending channel on the 1-hour timeframe. It has reached the lower boundary and is heading towards breaking above it, with a retest of the upper boundary expected. We have a downtrend on the RSI indicator, which has reached near the lower boundary, and an upward rebound is expected. There is a key support zone in green at 0.1100. The price has bounced from this level multiple times and is expected to bounce again. We have a trend towards consolidation above the 100-period moving average, as we are moving close to it, which supports the upward movement. Entry price: 0.1139 First target: 0.1150 Second target: 0.1180 Third target: 0.1223 Don't forget a simple principle: money management. Place your stop-loss order below the support zone in green. For any questions, please leave a comment. Thank you.#FLUX First target: 0.1150 Reached Second target: 0.1180 Reached#FLUX First target: 0.1150 Reached Second target: 0.1180 Reached Third target: 0.1223 Reached
CryptoAnalystSignal
تحلیل تکنیکال FLUX/USDT: سیگنال صعودی قدرتمند در انتظار شکست کانال نزولی!
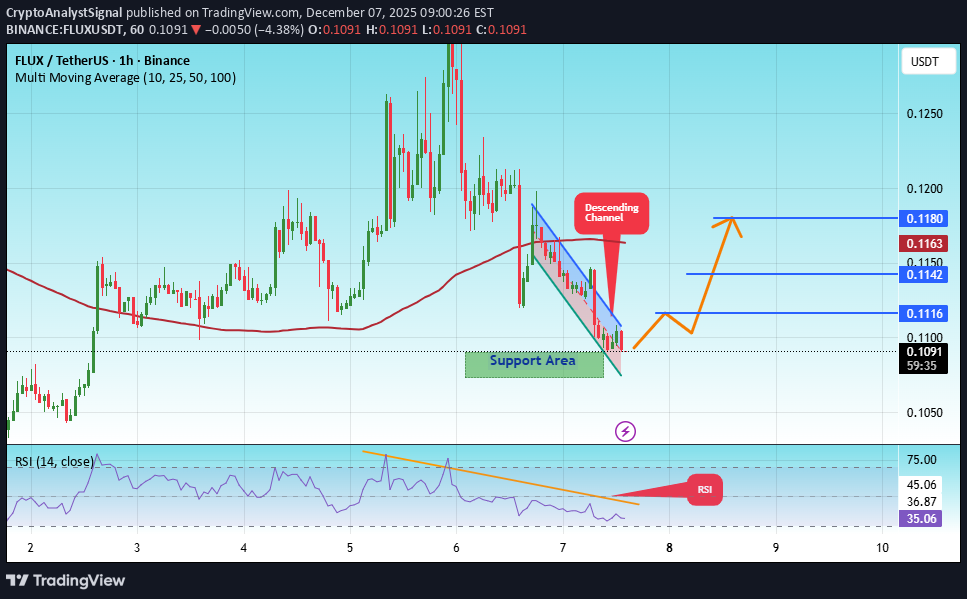
#FLUX The price is moving in a descending channel on the 1-hour timeframe. It has reached the lower boundary and is heading towards breaking above it, with a retest of the upper boundary expected. We have a downtrend on the RSI indicator, which has reached near the lower boundary, and an upward rebound is expected. There is a key support zone in green at 0.1077. The price has bounced from this zone multiple times and is expected to bounce again. We have a trend towards consolidation above the 100-period moving average, as we are moving close to it, which supports the upward movement. Entry price: 0.1094 First target: 0.1116 Second target: 0.1142 Third target: 0.1180 Don't forget a simple principle: money management. Place your stop-loss below the support zone in green. For any questions, please leave a comment. Thank you.#FLUX First target: 0.1116 Reached Second target: 0.1142 Reached#FLUX First target: 0.1116 Reached Second target: 0.1142 Reached Third target: 0.1180 Reached
CryptoAnalystSignal
پیشبینی صعودی قدرتمند FLUX/USDT: راز شکلگیری گوه صعودی پنهان!
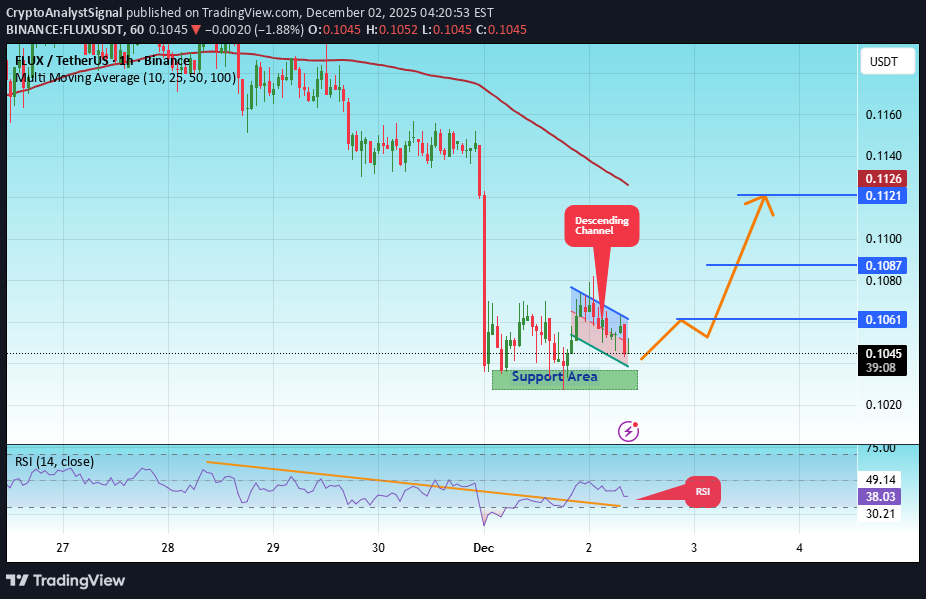
#FLUX The price is moving in a descending channel on the 1-hour timeframe. It has reached the lower boundary and is heading towards breaking above it, with a retest of the upper boundary expected. We have a downtrend on the RSI indicator, which has reached near the lower boundary, and an upward rebound is expected. There is a key support zone in green at 0.1030. The price has bounced from this level multiple times and is expected to bounce again. We have a trend towards consolidation above the 100-period moving average, as we are moving close to it, which supports the upward movement. Entry price: 0.1045 First target: 0.1060 Second target: 0.1087 Third target: 0.1121 Don't forget a simple principle: money management. Place your stop-loss below the support zone in green. For any questions, please leave a comment. Thank you.
CryptoAnalystSignal
آینده فلکس (FLUX/USDT): سیگنال صعودی قوی در کف حمایت!
#FLUX The price is moving in a descending channel on the 1-hour timeframe. It has reached the lower boundary and is heading towards breaking above it, with a retest of the upper boundary expected. We have a downtrend on the RSI indicator, which has reached near the lower boundary, and an upward rebound is expected. There is a key support zone in green at 0.1030. The price has bounced from this level multiple times and is expected to bounce again. We have a trend towards consolidation above the 100-period moving average, as we are moving close to it, which supports the upward movement. Entry price: 0.1045 First target: 0.1060 Second target: 0.1087 Third target: 0.1121 Don't forget a simple principle: money management. Place your stop-loss below the support zone in green. For any questions, please leave a comment. Thank you.#FLUX First target: 0.1060 Reached Second target: 0.1087 Reached Third target: 0.1121 Reached
CryptoAnalystSignal
احتمال انفجار قیمت FLUX/USDT: سیگنال صعودی قوی و نقطه ورود طلایی!
#FLUX The price is moving in a descending channel on the 1-hour timeframe. It has reached the lower boundary and is heading towards breaking above it, with a retest of the upper boundary expected. We have a downtrend on the RSI indicator, which has reached near the lower boundary, and an upward rebound is expected. There is a key support zone in green at 0.1030. The price has bounced from this level multiple times and is expected to bounce again. We have a trend towards consolidation above the 100-period moving average, as we are moving close to it, which supports the upward movement. Entry price: 0.1045 First target: 0.1060 Second target: 0.1087 Third target: 0.1121 Don't forget a simple principle: money management. Place your stop-loss below the support zone in green. For any questions, please leave a comment. Thank you.
CryptoAnalystSignal
خیزش قریبالوقوع FLUX: پیشبینی بازگشت صعودی از الگوی گوه نزولی!
#FLUX The price is moving in a descending channel on the 1-hour timeframe. It has reached the lower boundary and is heading towards breaking above it, with a retest of the upper boundary expected. We have a downtrend on the RSI indicator, which has reached near the lower boundary, and an upward rebound is expected. There is a key support zone in green at 0.1030. The price has bounced from this level multiple times and is expected to bounce again. We have a trend towards consolidation above the 100-period moving average, as we are moving close to it, which supports the upward movement. Entry price: 0.1045 First target: 0.1060 Second target: 0.1087 Third target: 0.1121 Don't forget a simple principle: money management. Place your stop-loss below the support zone in green. For any questions, please leave a comment. Thank you.
Disclaimer
Any content and materials included in Sahmeto's website and official communication channels are a compilation of personal opinions and analyses and are not binding. They do not constitute any recommendation for buying, selling, entering or exiting the stock market and cryptocurrency market. Also, all news and analyses included in the website and channels are merely republished information from official and unofficial domestic and foreign sources, and it is obvious that users of the said content are responsible for following up and ensuring the authenticity and accuracy of the materials. Therefore, while disclaiming responsibility, it is declared that the responsibility for any decision-making, action, and potential profit and loss in the capital market and cryptocurrency market lies with the trader.