
CELR
Celer Network
| تریدر | نوع سیگنال | حد سود/ضرر | زمان انتشار | مشاهده پیام |
|---|---|---|---|---|
No results found. | ||||
Price Chart of Celer Network
سود 3 Months :
سیگنالهای Celer Network
Filter
Sort messages by
Trader Type
Time Frame

CryptoAnalystSignal
#CELR/USDT Ready to go higher
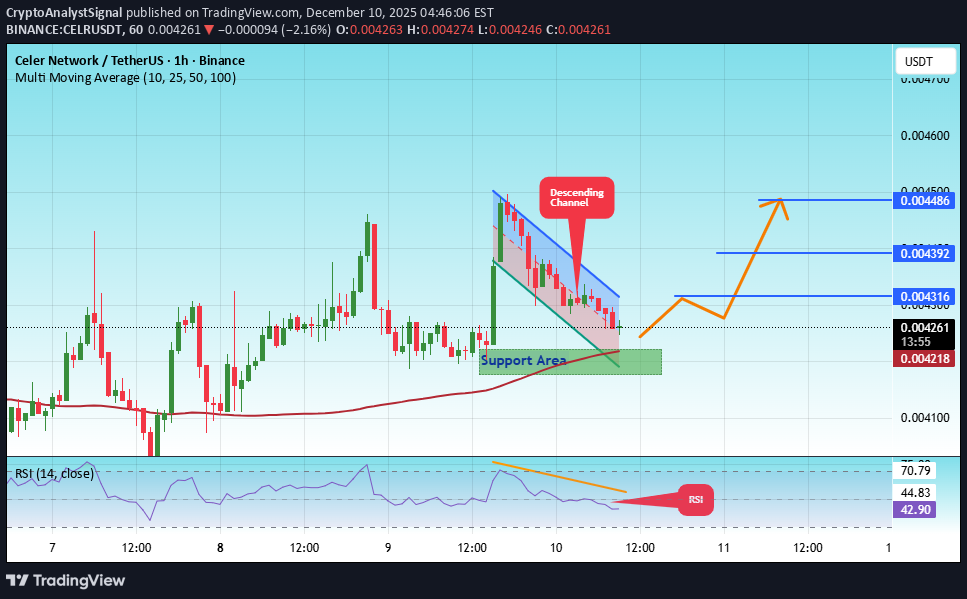
#CELR The price is moving in a descending channel on the 1-hour timeframe. It has reached the lower boundary and is heading towards breaking above it, with a retest of the upper boundary expected. We have a downtrend on the RSI indicator, which has reached near the lower boundary, and an upward rebound is expected. There is a key support zone in green at 0.004200. The price has bounced from this zone multiple times and is expected to bounce again. We have a trend towards consolidation above the 100-period moving average, as we are moving close to it, which supports the upward movement. Entry price: 0.004260 First target: 0.004316 Second target: 0.004392 Third target: 0.004486 Don't forget a simple principle: money management. Place your stop-loss below the support zone in green. For any questions, please leave a comment. Thank you.#CELR First target: 0.004316 Reached Second target: 0.004392 Reached

MohamedSewid

Bithereum_io
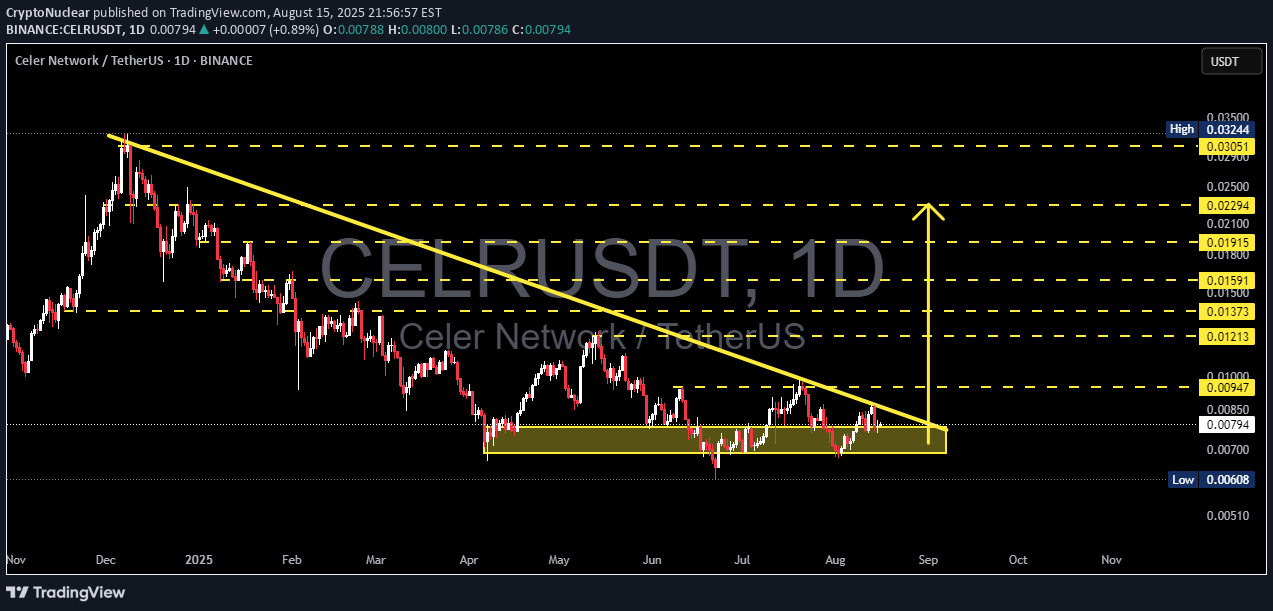
پیشبینی صعودی CELR: حرکت در الگوی گوه نزولی و اهداف قیمتی هیجانانگیز!
#CELR is moving inside a falling wedge pattern on the daily chart. In case of a bounce from the support and a breakout above the daily EMA100 and the wedge resistance, the potential targets are: 🎯 $0.007639 🎯 $0.009216 🎯 $0.010490 🎯 $0.011764 🎯 $0.013579 🎯 $0.015890 ⚠️ Always remember to use a tight stop-loss and maintain proper risk management.

saviour25
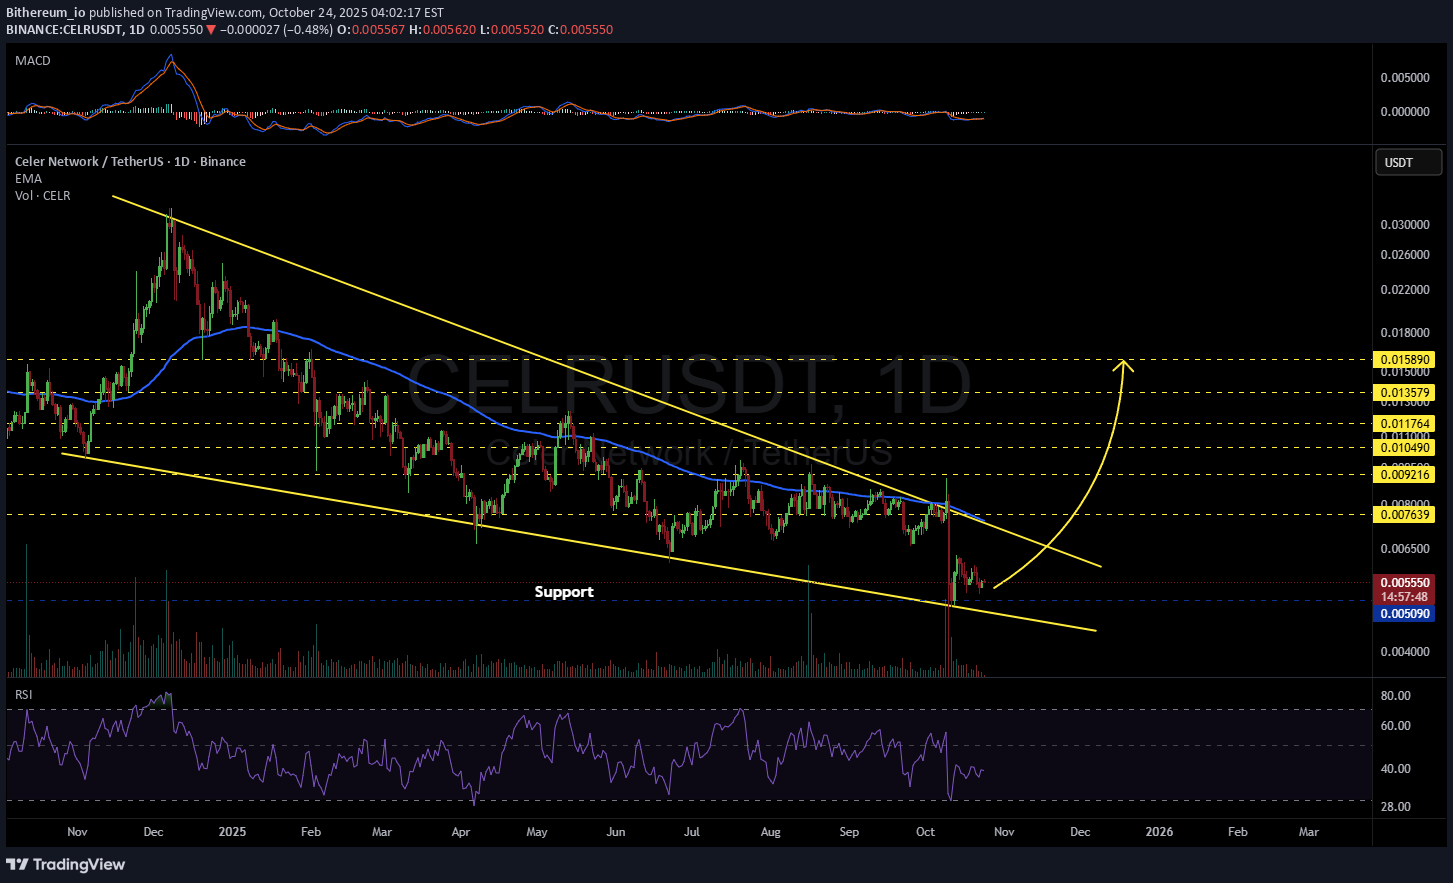
تحلیل تکنیکال CEL/USDT: آیا قیمت در آستانه سقوط است؟ (بررسی ناحیه شکست ۱۲ ساعته)

Price is currently retesting the 12h breaker zone after doing a huge sweep of liquidity. MACD is showing bearish weakness, RSI is sold and EMAs are bearish. Price needs to break above this 12h breaker zone in order to expect further bullish movements.

Hamdi_chrt
شروع رالی بزرگ CELRUSDT: پایان اصلاح و آغاز صعود قدرتمند!

It seems that the currency has ended a long correction in time and price, and we have reached areas of strong demand from which the price rebounded appropriately. Now, we are supposed to start an upward trend for a long time.

CryptoWithJames
تحلیل تکنیکال CELR: شکست گوه نزولی و پتانسیل سود 80 درصدی!

#CELR UPDATE CELR Technical Setup Pattern: Bullish falling wedge pattern Current Price: $0.0075 Target Price: $0.0136 Target % Gain: 80.54% $CELR is breaking out of a falling wedge pattern on the 1D timeframe. Current price is $0.0075 with a target near $0.0136, showing about 80% potential upside. The breakout indicates renewed bullish momentum with potential for further continuation. Always use proper risk management. Time Frame: 1D Risk Management Tip: Always use proper risk management.

CryptoNuclear
تحلیل CELR: نقطه عطف بزرگ در آستانه شکست؛ آیا روند صعودی آغاز میشود؟

Celer Network (CELR) is currently standing at a critical juncture that could define its next major move. After months trapped below a long-term descending trendline, price is once again testing a crucial area — the accumulation zone between 0.008 and 0.0072. This yellow zone has consistently acted as a strong demand area, showing that buyers have been quietly absorbing sell pressure. At the same time, the long-term downtrend line remains a heavy ceiling that has capped every rally attempt so far. Now, both forces are converging — making this a true decision point for CELR. --- Pattern Description The chart displays a descending triangle pattern characterized by: A sequence of lower highs (declining selling pressure). A horizontal support base around 0.008–0.0072 (firm buying interest). This structure typically signals a compression phase — the market builds energy for its next big move. A breakout could mark the beginning of a major trend reversal, while a breakdown could trigger a continuation of the broader downtrend. --- Bullish Scenario — The Start of a Reversal? If CELR manages to break and close above the descending trendline, especially with a daily close above 0.0094–0.0095, it would signal the first technical shift in momentum after months of decline. A breakout accompanied by rising volume would confirm that buyers are taking control. 📈 Upside targets: Target 1: 0.0095 – initial breakout retest zone. Target 2: 0.0121 – first horizontal resistance. Target 3: 0.0135 – a psychological level often triggering follow-up buying. Extended targets: 0.0159 – 0.019 – medium-term expansion zone if bullish momentum sustains. If CELR can hold above the breakout level on a successful retest, it may mark the beginning of a significant trend reversal phase driven by renewed demand. --- Bearish Scenario — Continuation Risk If CELR fails to break above the trendline and gets rejected around 0.0085–0.0090, selling pressure could return. A daily close below 0.0072 would confirm a bearish breakdown and could lead price toward: 0.0068 – 0.0065 → the previous local low zone. 0.00608 → the next key support if selling continues. This scenario would indicate that buyers are still weak and the long-term downtrend remains dominant. --- Technical Context The long-term descending trendline remains a major resistance area monitored by technical traders. The yellow accumulation zone (0.008–0.0072) has acted as a high-liquidity demand region. Volume confirmation is crucial — a breakout without volume often leads to a false move. Momentum appears to be shifting slowly, but true confirmation will depend on how the next few daily closes unfold. --- Conclusion > CELR stands at a historic inflection point. The clash between long-term selling pressure and strong accumulation support will determine its next trend direction. A breakout above resistance could trigger a long-awaited trend reversal, while a breakdown below support could extend the bearish structure. Patience and confirmation are key — not anticipation. --- #CELRUSDT #CELR #CelerNetwork #CryptoAnalysis #TechnicalAnalysis #DescendingTriangle #BreakoutSetup #TrendReversal #DecisionPoint #CryptoTrading #SupportResistance #SwingTrade

SatochiTrader
سِیلِر (CELR) در کف قیمتی: آغاز چرخه جدید و اهداف بزرگ تا 32 سنت!

CELER NETWORK (CELR/USDT) — Cycle Bottom Formed, Reversal Phase Loading 🔄 CELR is showing clear signs of accumulation near the cycle bottom zone between $0.0066 – $0.0088, a range historically known for reversals and strong recovery moves. 📉 Accumulation Base: $0.0066 – $0.0088 🟢 Current Structure: CELR is stabilizing after prolonged downtrend pressure, building strength in a low volatility range — often a signal before a new expansion phase. 📈 Next Major Targets: First resistance zone: $0.0205 Main cycle target: $0.0326 A breakout confirmation above $0.0100 would likely activate a new bullish cycle, potentially mirroring previous macro moves from similar levels. Summary: CELR/USDT is trading in its historical low region, suggesting a high-reward accumulation zone. As momentum returns to mid-cap alts, CELR could be among those leading the next cycle push. 🎯 Targets: $0.0205 → $0.0326 📊 Bias: Bullish Accumulation PhaseWe follow this coin to see if it's able to break up $0,01 in the coming 24H
CryptoNuclear
CELRUSDT – Descending Triangle: Breakout or Breakdown?
Summary Overall trend remains bearish since the late 2024/early 2025 peak (downtrend line in yellow). Price is now compressed into a Descending Triangle: – Falling resistance (yellow diagonal). – Flat support / demand zone in 0.0074–0.0086. Key horizontal levels (yellow dashed lines): 0.00947, 0.01213, 0.01373, 0.01591, 0.01915–0.02100, 0.02294, and higher resistance at 0.0305–0.0324. Critical low: 0.00608. Bullish Scenario Catalyst: Daily close above the downtrend line and a confirmed breakout above 0.00947, ideally supported by stronger volume. Targets: 1. From 0.00947 → 0.01213 (TP1). 2. Next → 0.01373 (TP2) and 0.01591 (TP3). 3. If momentum continues: 0.01915–0.02100 → 0.02294 → 0.0305–0.0324 (local highs). Invalidation: Rejection and daily close back below 0.0086 (inside triangle/demand zone). Bearish Scenario Catalyst: Daily close below 0.0079 and more importantly, breakdown of the demand zone at ≤0.0074. Targets: Descending Triangle measured move (0.0095 − 0.0074 ≈ 0.0021) projects to ≈0.0053. Intermediate levels: 0.00608 and ≈0.0051. Failed retest of 0.0074–0.0079 after breakdown would strengthen the bearish case. Invalidation: Price reclaims 0.00947 and breaks above the downtrend line. Pattern Notes & Risk Management Descending Triangles at strong support often trigger sharp moves once a breakout/breakdown occurs. Beware of fakeouts near the apex (late August–early September) – wait for daily close confirmation or a retest. Strategy: entry based on break & retest, with stop-loss outside invalidation zones (e.g. below 0.0072 for longs; above 0.0098 for shorts). This is not financial advice – manage your own risk. #CELR #CELRUSDT #CelerNetwork #CryptoAnalysis #PriceAction #DescendingTriangle #SupportResistance #Breakout #BullishScenario #BearishScenario
Bithereum_io
CELRUSDT 1D
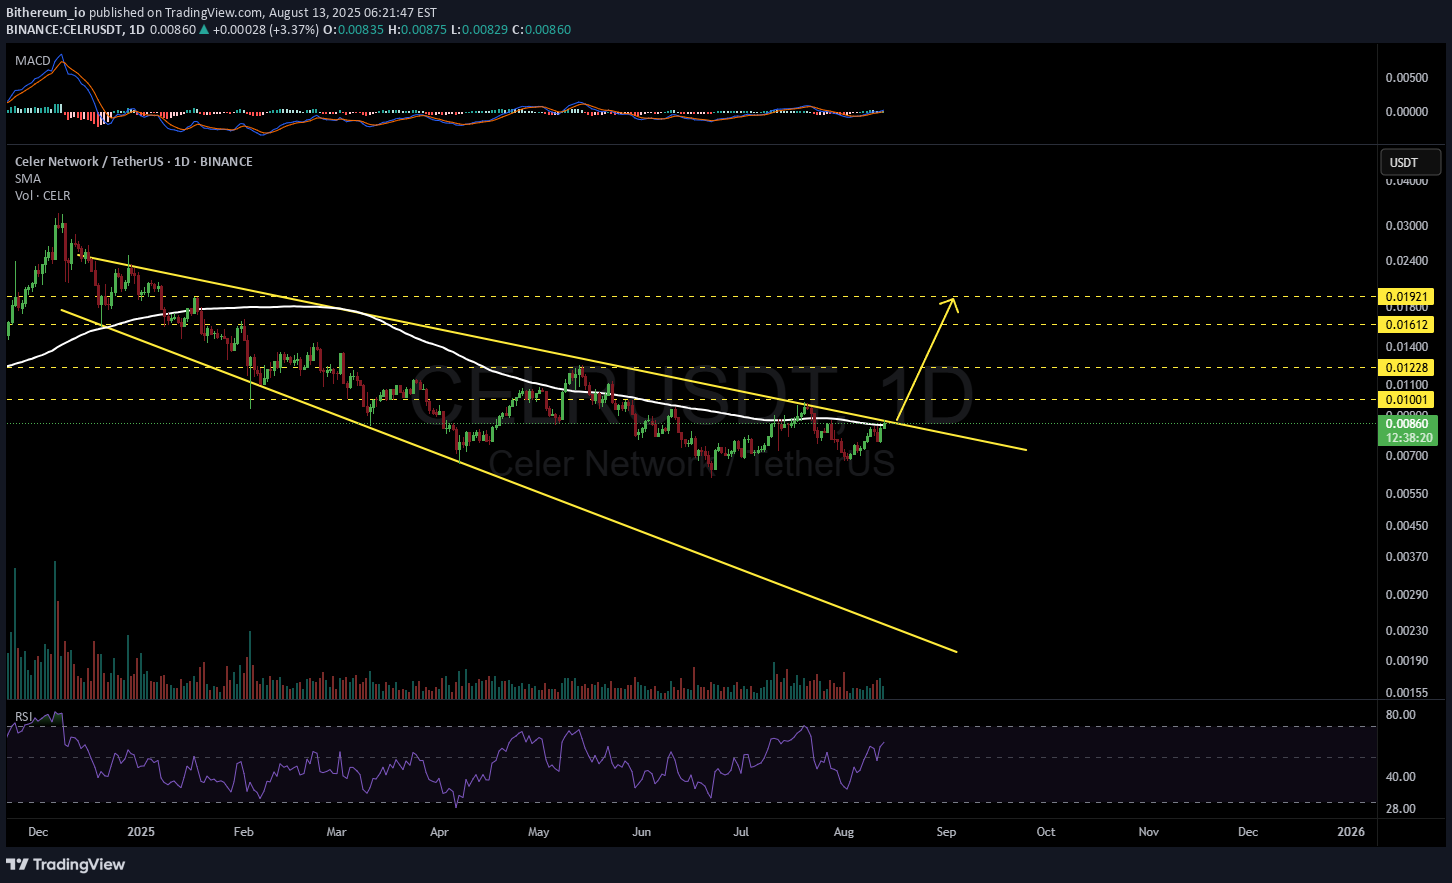
#CELR is on the verge of breaking above the Descending Broadening Wedge and the SMA100 on the daily chart. A confirmed breakout could set the stage for a move toward the following targets: 🎯 $0.01001 🎯 $0.01228 🎯 $0.01612 🎯 $0.01921 ⚠️ As always, use a tight stop-loss and apply proper risk management.
Disclaimer
Any content and materials included in Sahmeto's website and official communication channels are a compilation of personal opinions and analyses and are not binding. They do not constitute any recommendation for buying, selling, entering or exiting the stock market and cryptocurrency market. Also, all news and analyses included in the website and channels are merely republished information from official and unofficial domestic and foreign sources, and it is obvious that users of the said content are responsible for following up and ensuring the authenticity and accuracy of the materials. Therefore, while disclaiming responsibility, it is declared that the responsibility for any decision-making, action, and potential profit and loss in the capital market and cryptocurrency market lies with the trader.