
BAR
FC Barcelona Fan Token
| تریدر | نوع سیگنال | حد سود/ضرر | زمان انتشار | مشاهده پیام |
|---|---|---|---|---|
No results found. | ||||
Price Chart of FC Barcelona Fan Token
سود 3 Months :
سیگنالهای FC Barcelona Fan Token
Filter
Sort messages by
Trader Type
Time Frame

TraderNexusX
تحلیل انفجاری BAR: آماده جهش به ۲.۵۰ دلار باشید! (صعود قوی در راه است)

BINANCE:BARUSDT - This coin is seemingly entering a strong bullish divergence on the 2W chart which prompts a huge upside in BAR. Channel support has reached and also an increasing bullish pressure on the MACD. I reckon a $2.00 - $2.50 target on this coin easily. Additionally, even if a dump occurs it will be a shake out for SL's and a bear trap, so in my opinion this position is safe to hold. All eyes on BAR for now. Ofcourse please DYOR as this is a volatile coin. Cheers!

MrBolt451
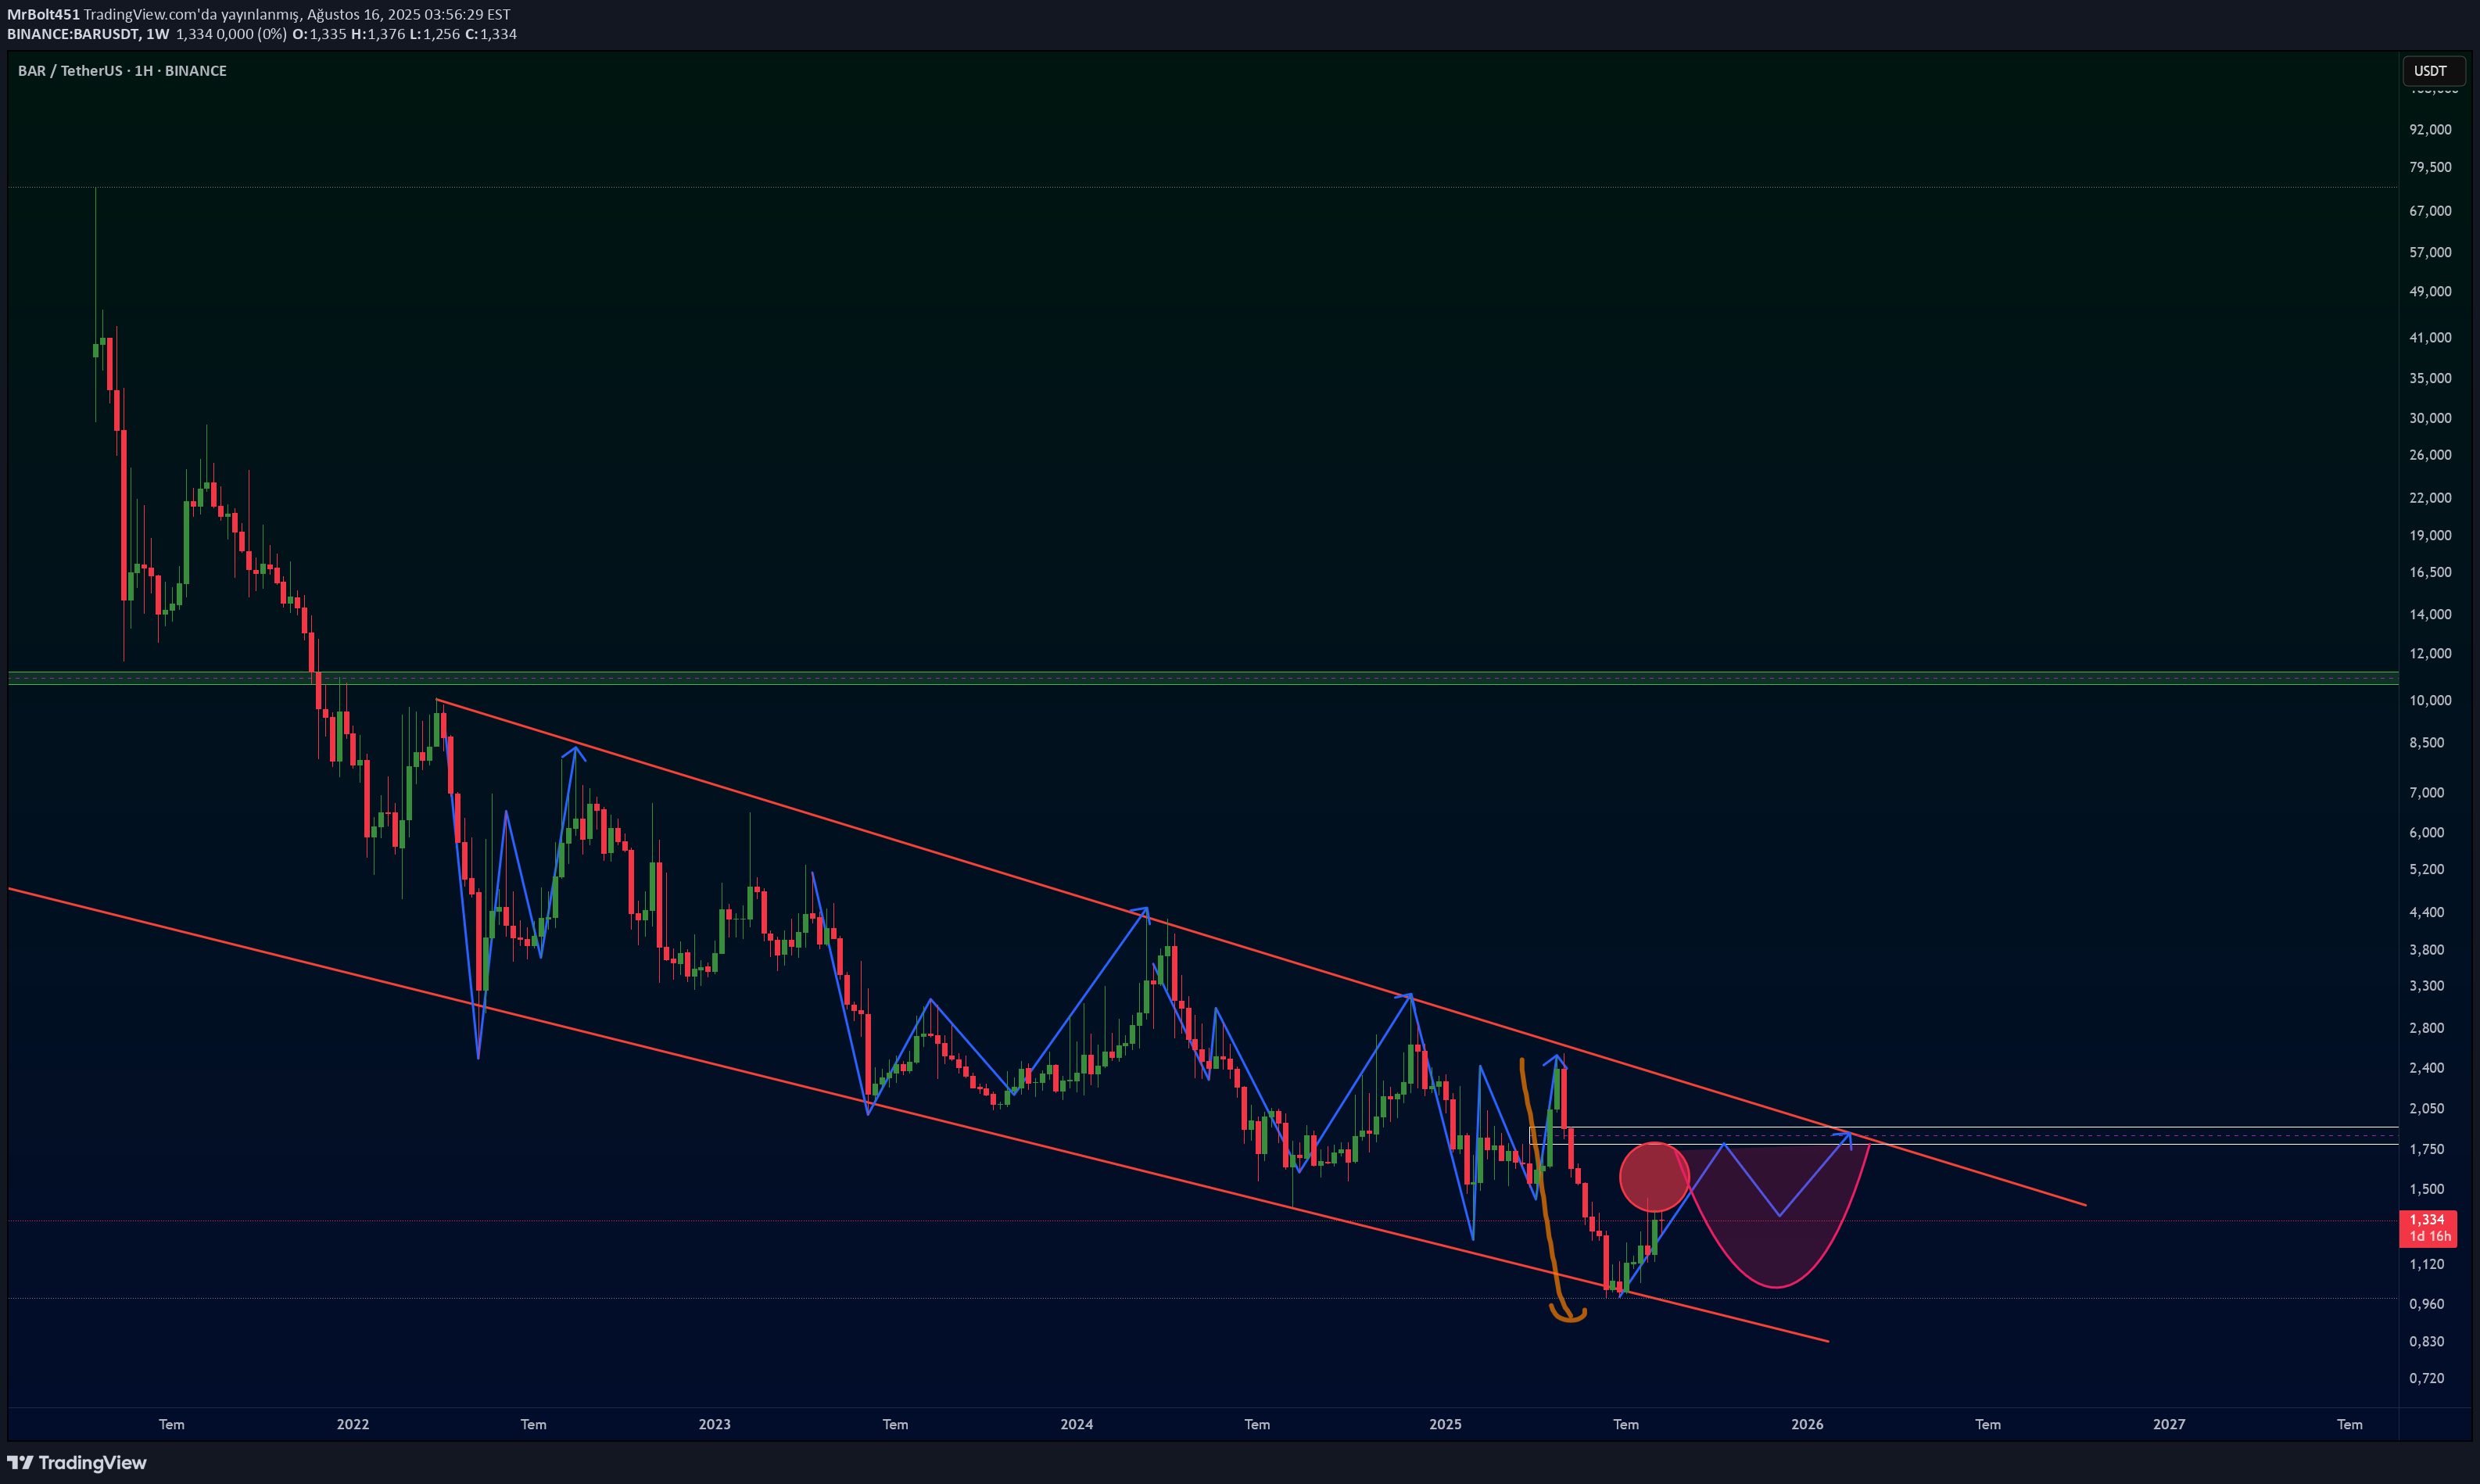
In FAN TOKEN, a tendency to rise in general is remarkable. Many fan Token has recently approached the hill areas, while others are still close to the bottom levels. This analysis was prepared especially based on technical structures formed in the weekly graph. BAR A long -standing downward trend in the past is observed. However, during this decline, the Adam-EV has started to produce technically possible return signals with cup-house and various harmonic pattern structures. The region I mentioned in the graph is remarkable in terms of both the channel alt band and its creation of a potential return formation. After this point, the BAR Token has the possibility of breaking the falling trend to a upward structure. If this scenario occurs, the bar, which is one of the tokens with low market caps, may have the potential to increase the market value up to 4 to 5 times, similar to token, such as ASR. 🔔 It is not an investment advice. Technical analysis work.
MrBolt451
In FAN TOKEN, a tendency to rise in general is remarkable. Many fan Token has recently approached the hill areas, while others are still close to the bottom levels. This analysis was prepared especially based on technical structures formed in the weekly graph. BAR A long -standing downward trend in the past is observed. However, during this decline, the Adam-EV has started to produce technically possible return signals with cup-house and various harmonic pattern structures. The region I mentioned in the graph is remarkable in terms of both the channel alt band and its creation of a potential return formation. After this point, the BAR Token has the possibility of breaking the falling trend to a upward structure. If this scenario occurs, the bar, which is one of the tokens with low market caps, may have the potential to increase the market value up to 4 to 5 times, similar to token, such as ASR. 🔔 It is not an investment advice. Technical analysis work.
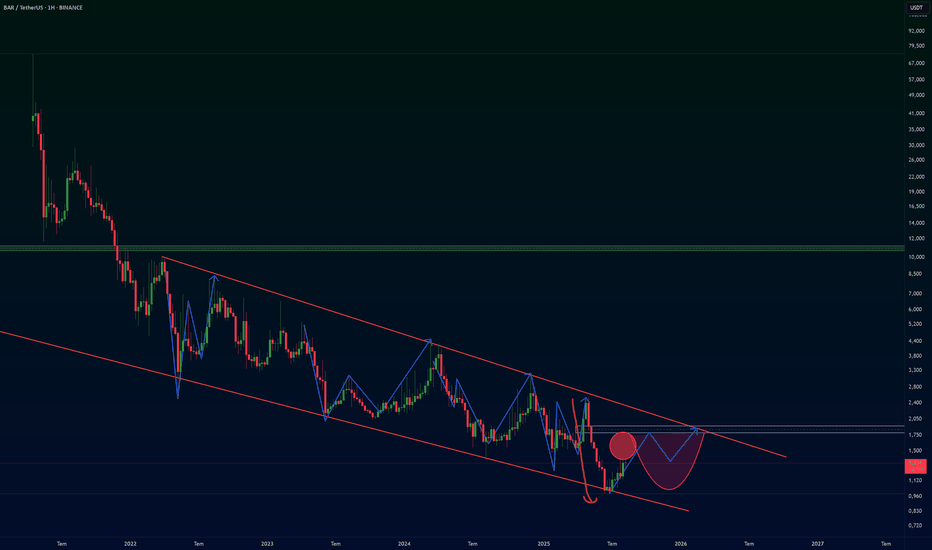
MrBolt451
Fan Tokens are generally low supply and are very sensitive to social media movements. I am at this stage: I am waiting for the re -testing of the upper resistance zone, However, with a single 4 -hour strong movement, the price is possible to make a quick needle up to $ 10. In summary: Low supply - high volatility - high risk, high return.

CryptoAnalystSignal

#BARThe price is moving within a descending channel on the 1-hour frame and is expected to break and continue upward.We have a trend to stabilize above the 100 moving average once again.We have a downtrend on the RSI indicator that supports the upward move by breaking it upward.We have a support area at the lower limit of the channel at 1.65, or a price rebound from it.This area acts as strong support from which the price can rebound.Entry price: 1.67First target: 1.70Second target: 1.57Third target: 1.78

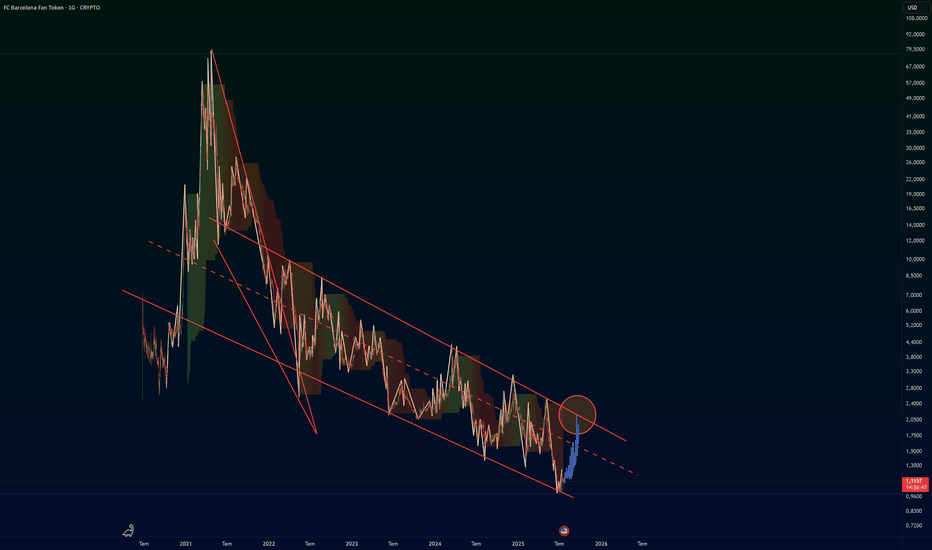
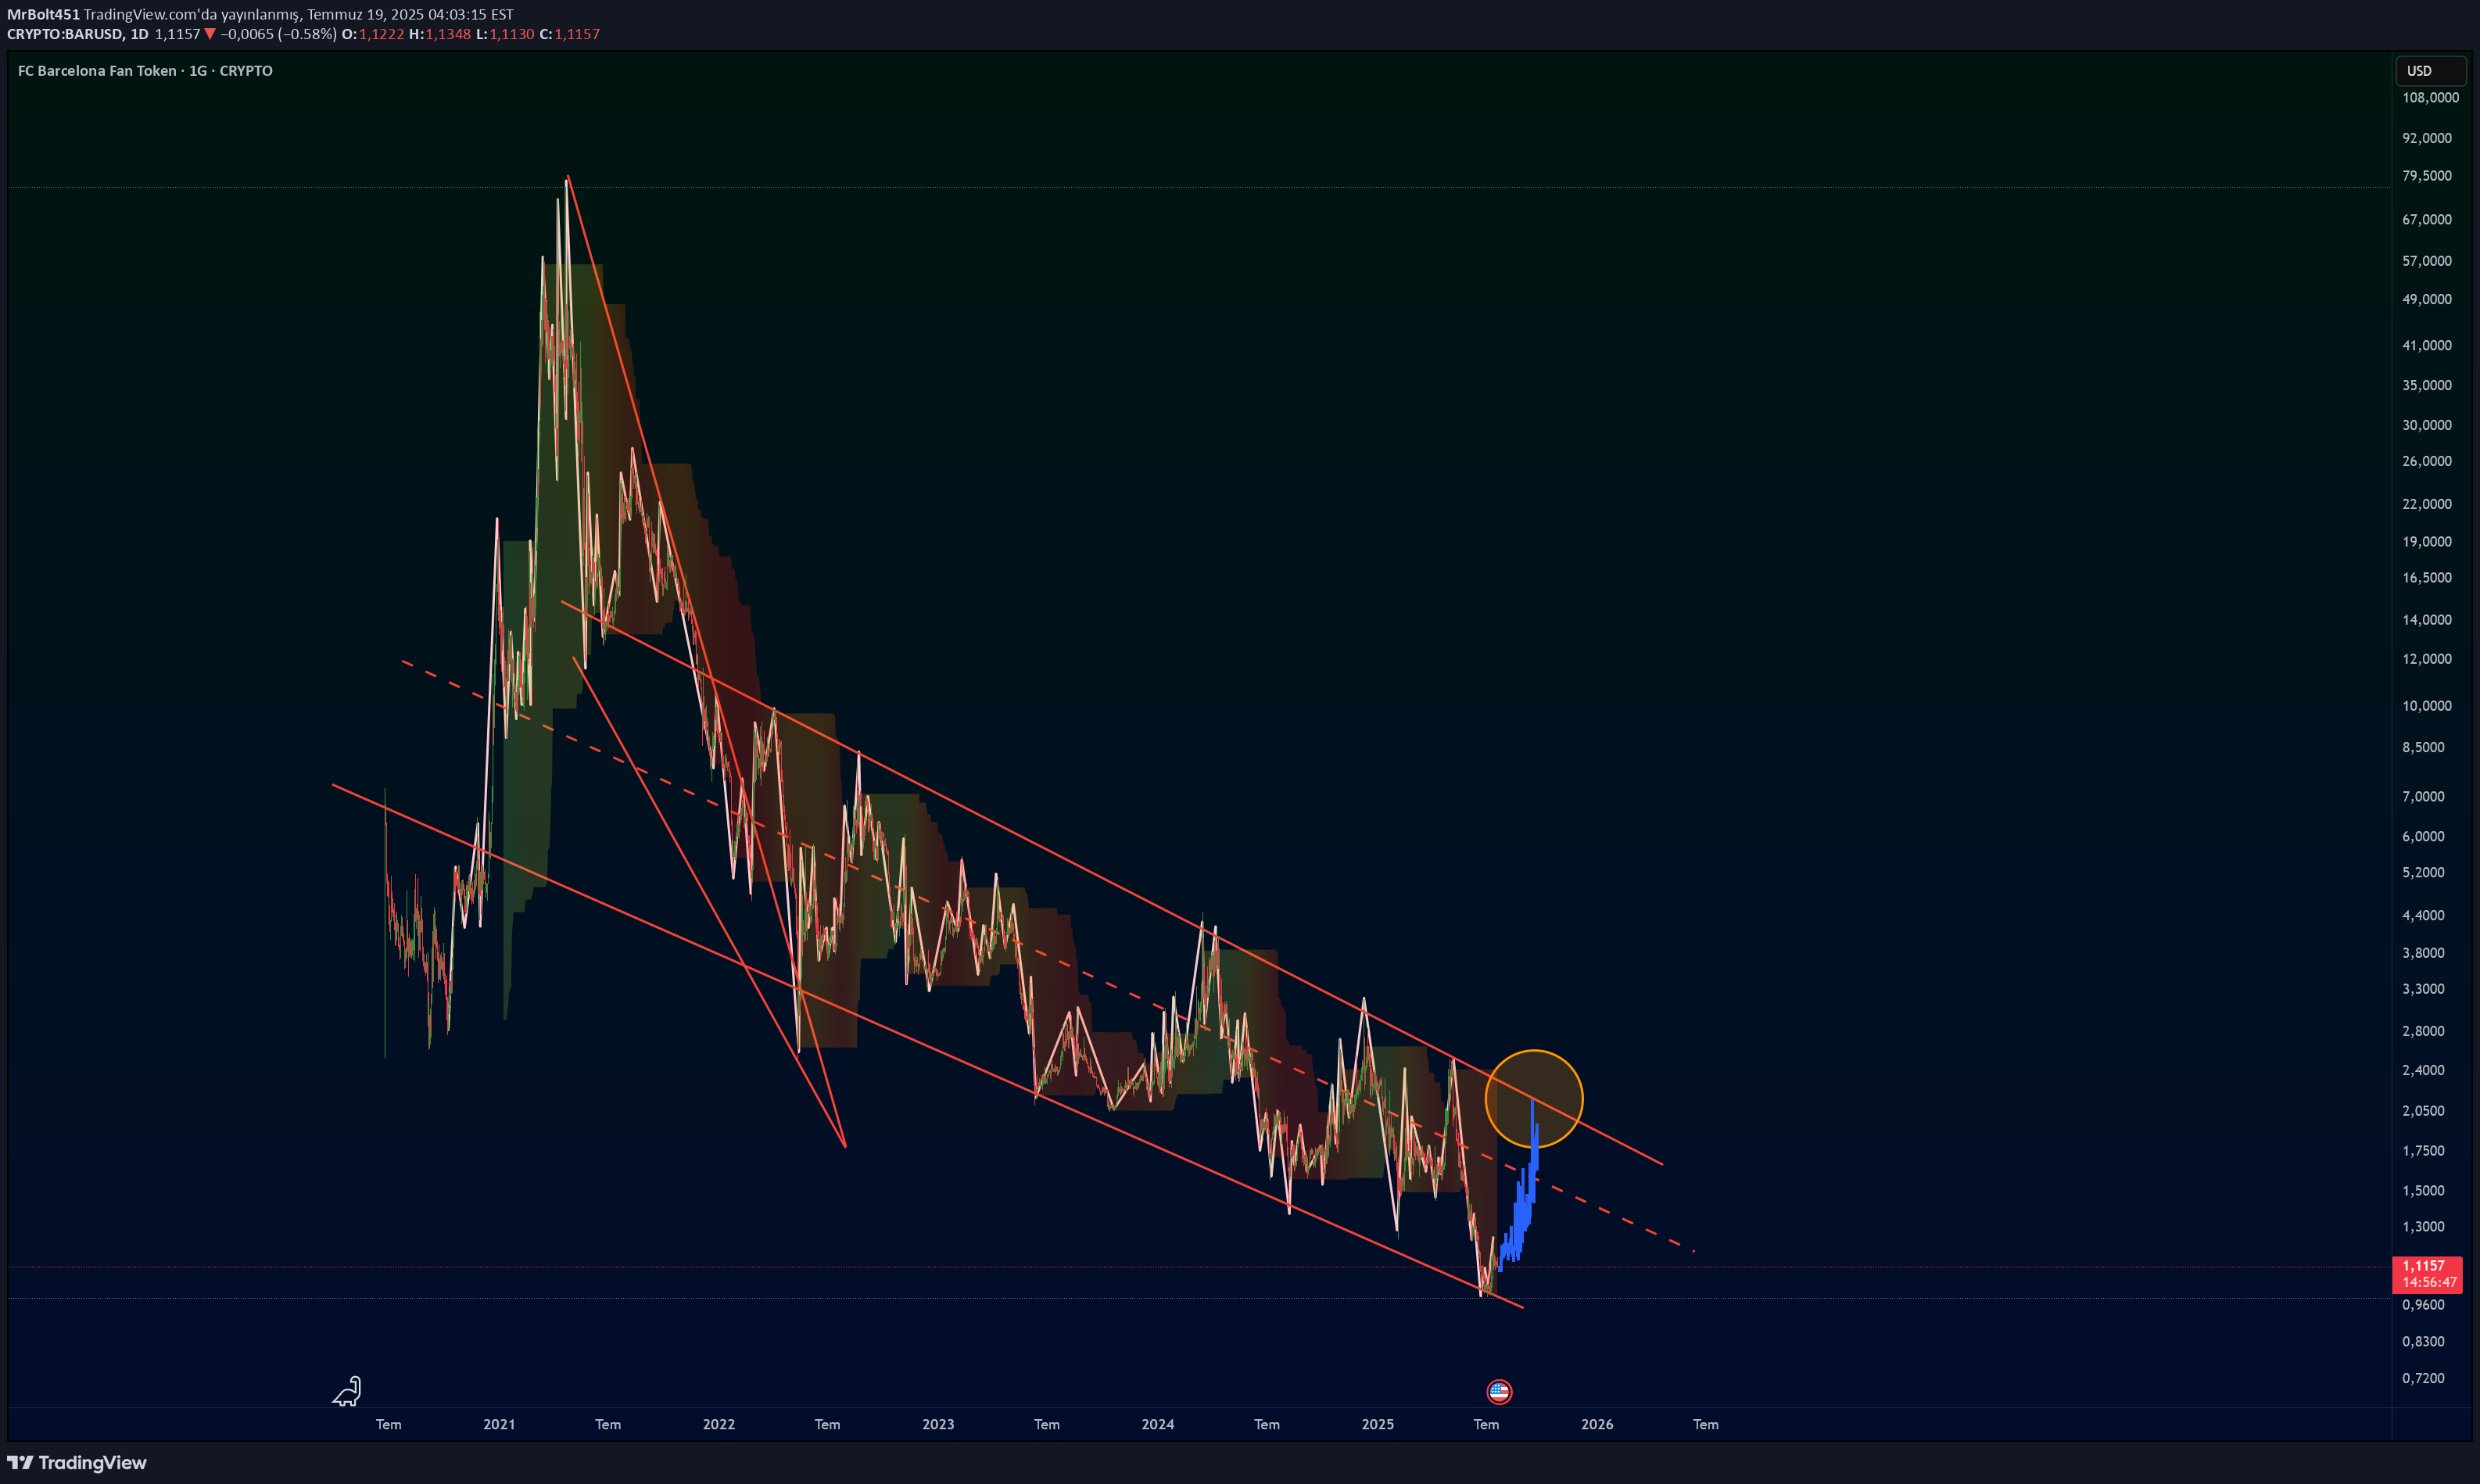
trpiyasa

Bar شکست خط روند نزولی و پولبک زد. اگر از اینجا به بالا ادامه دهد، پیش بینی من این است که گام به گام به هدف ارتفاع مثلث رسید. این یک پیش بینی است، توصیه سرمایه گذاری نیست. به امید موفقیت...
trpiyasa

یک الگوی کنج زیبا تشکیل داده. خط زرد هدف من است. توصیه سرمایهگذاری ارائه نمیکنم.


Sports Token IndexSports Token IndexSports Token Index

AlanSantana

Follow me! Let's do this together. What I am trying to show here is a short-term move. Let's use this chart to predict what will happen next.The main signal we want to consider is trading volume. Trading volume became really high starting the 10th of October. As volume grows, we are seeing bullish action.There is a period with bearish action on the left side of the chart. Price dynamics transition from bearish to sideways, from sideways to bullish. This is all we need.Seeing how prices are slowly moving up, now that the action is happening above support (previous resistance), we can expect next a strong jump.We are aiming at $4.05, $5.68 and $7.32 on the next move up. This is short-term and we are looking at a fast advance, a sudden jump.This is a bullish chart but things can change. The purple range marked on the chart is the main support. Above this range, the bullish bias remains strong and we can expect our targets to hit within days. If the action moves below this range, below $2, we will have to consider a longer wait before a higher high shows up.This is a short-term analysis —BARUSDT is going up. That is what the chart is saying right now.Thanks a lot for your continued support.Namaste.
Disclaimer
Any content and materials included in Sahmeto's website and official communication channels are a compilation of personal opinions and analyses and are not binding. They do not constitute any recommendation for buying, selling, entering or exiting the stock market and cryptocurrency market. Also, all news and analyses included in the website and channels are merely republished information from official and unofficial domestic and foreign sources, and it is obvious that users of the said content are responsible for following up and ensuring the authenticity and accuracy of the materials. Therefore, while disclaiming responsibility, it is declared that the responsibility for any decision-making, action, and potential profit and loss in the capital market and cryptocurrency market lies with the trader.