
ADX
AdEx Network
| تریدر | نوع سیگنال | حد سود/ضرر | زمان انتشار | مشاهده پیام |
|---|---|---|---|---|
No results found. | ||||
Price Chart of AdEx Network
سود 3 Months :
سیگنالهای AdEx Network
Filter
Sort messages by
Trader Type
Time Frame

ALSHIHRY
آغاز صعود بزرگ: سهم AdEx پس از اتمام دوره تجمّع، آماده پرواز ۲۰۰ درصدی!
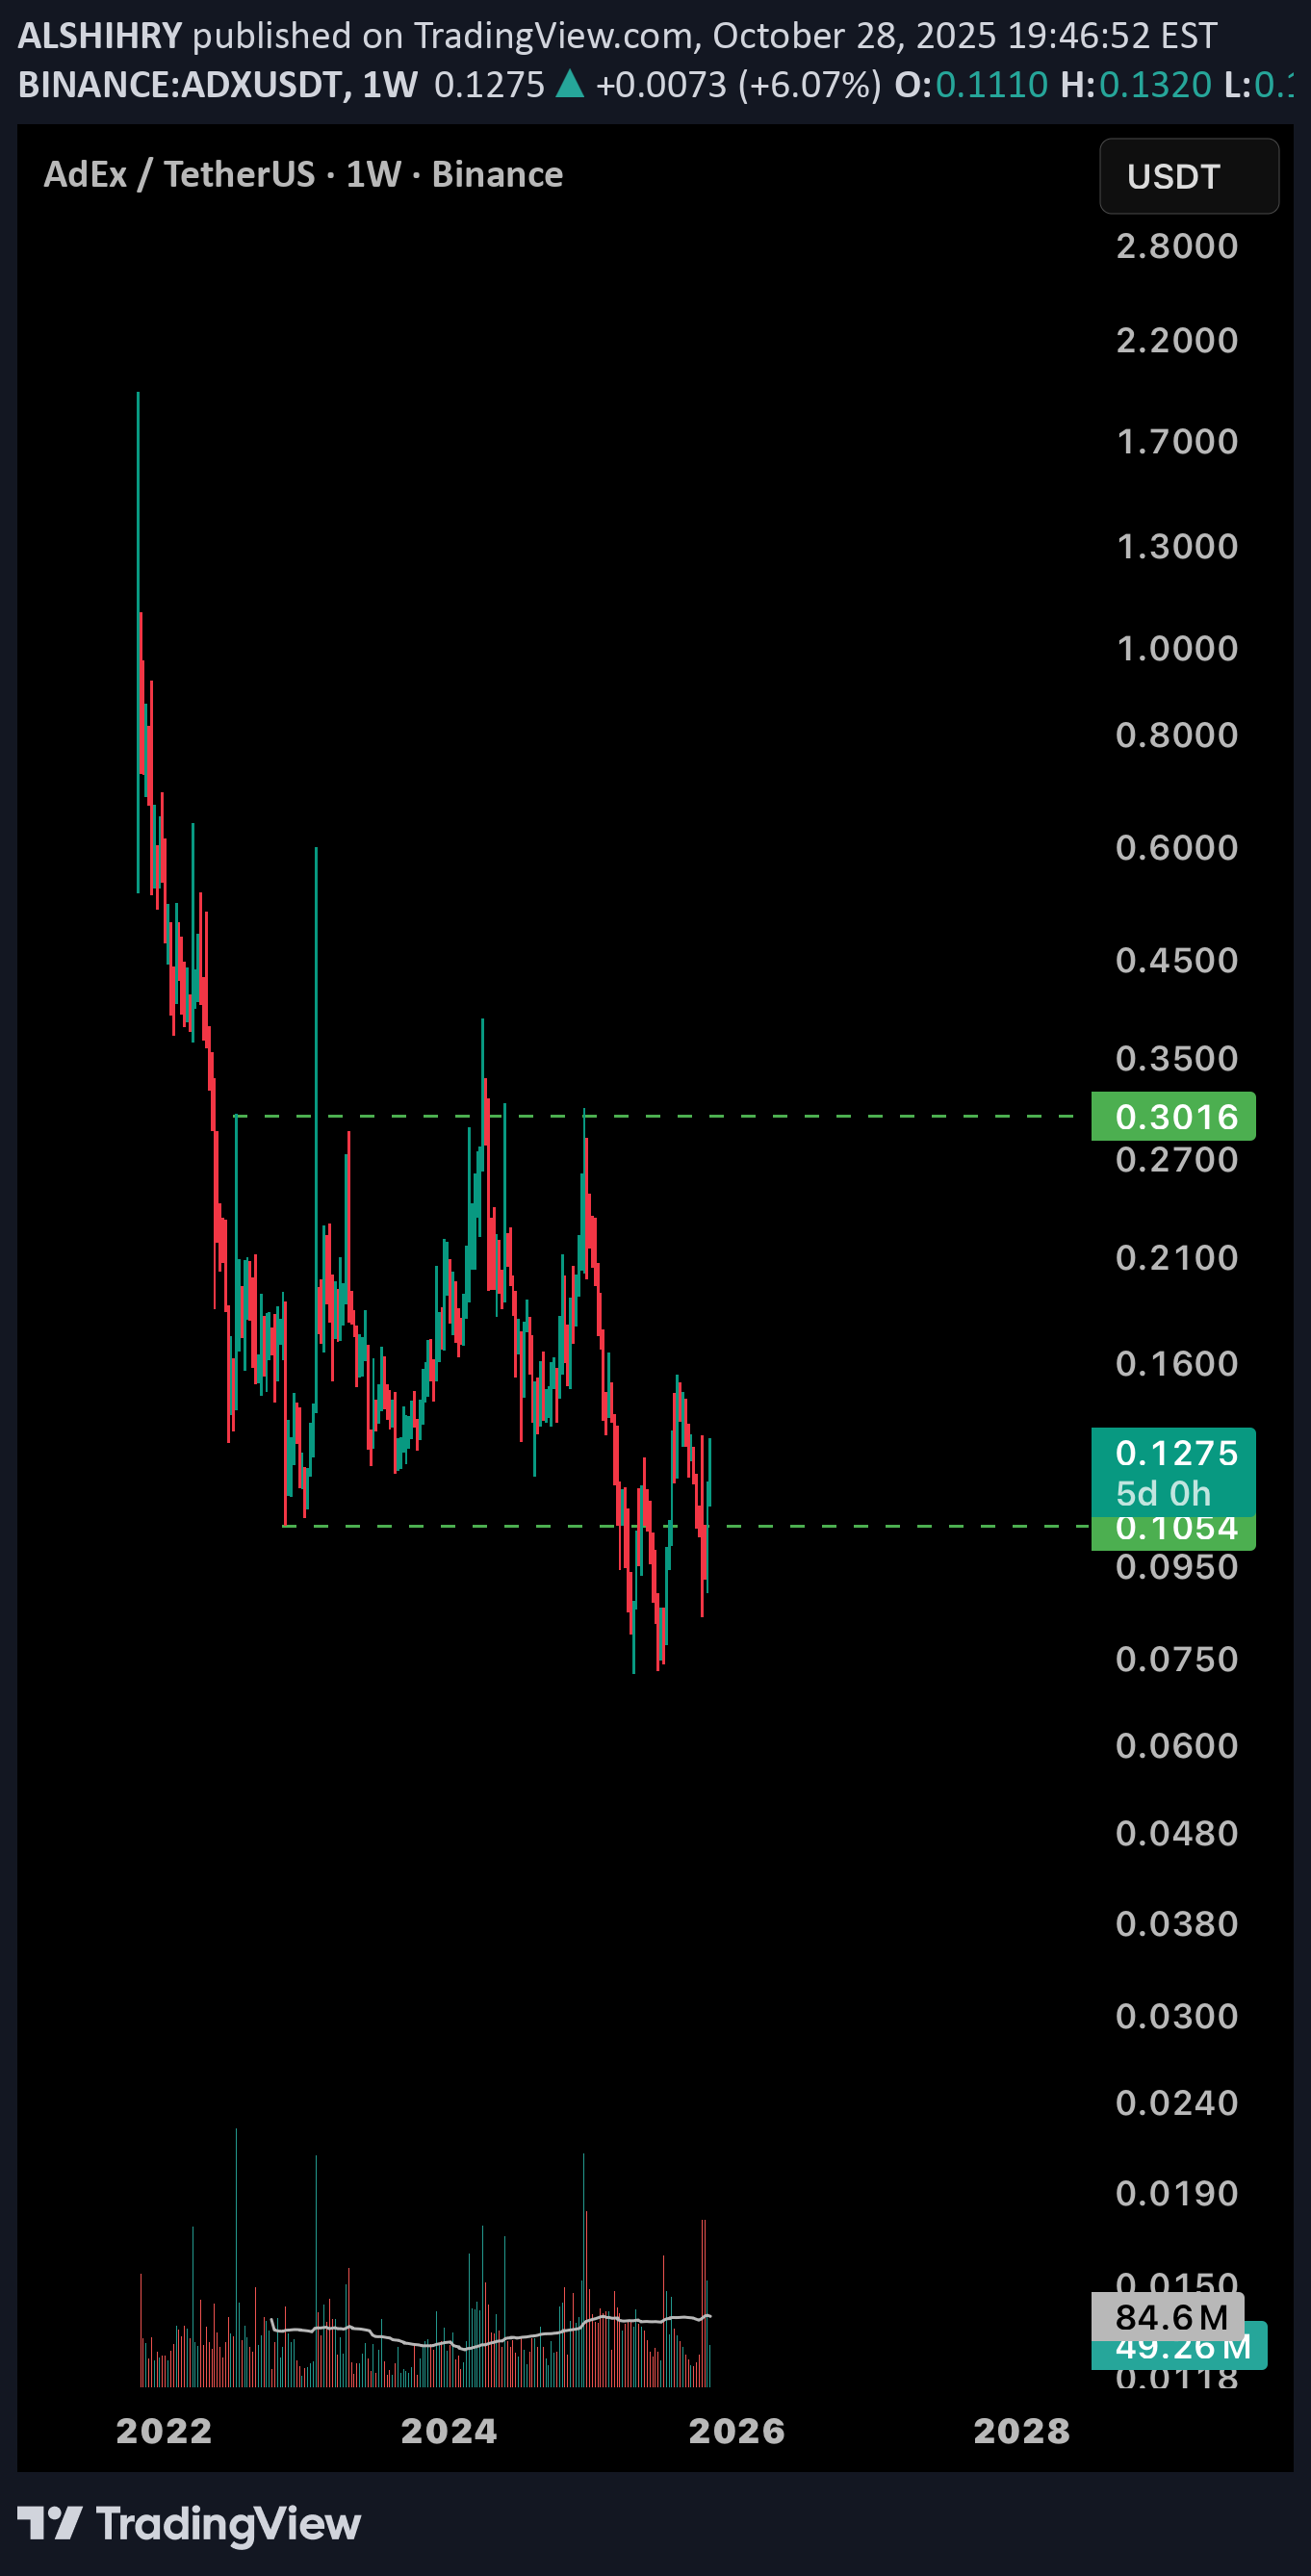
AdEx (ADX) has completed its Wyckoff accumulation phase, confirming a fully developed Spring (false breakout). The move was validated by the formation of a double-bottom pattern, highlighting the strength of the underlying base. The structure suggests a strong upside breakout is imminent, with a potential rally exceeding +200% as buying momentum and liquidity expansion continue to build.

Bithereum_io
تحلیل ADX: آماده شکست مثلث متقارن؛ اهداف صعودی بزرگ در انتظار کدام سطح؟
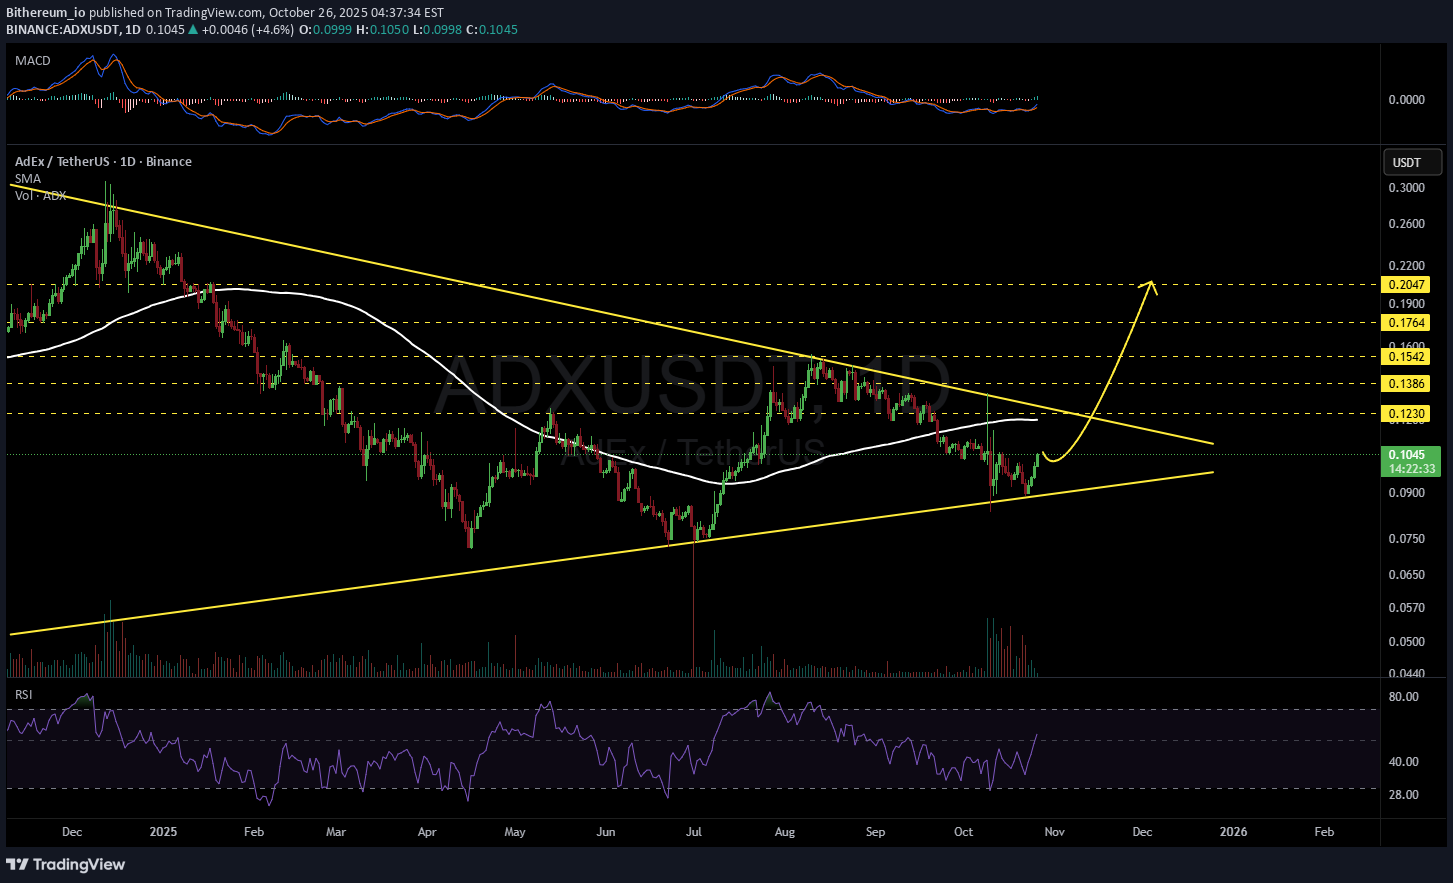
#ADX is moving inside a symmetrical triangle on the daily chart. In case of a breakout above the triangle resistance and the SMA100, the potential targets are: 🎯 $0.1230 🎯 $0.1386 🎯 $0.1542 🎯 $0.1764 🎯 $0.2047 ⚠️ Always remember to use a tight stop-loss and maintain proper risk management.

pullbacksignal
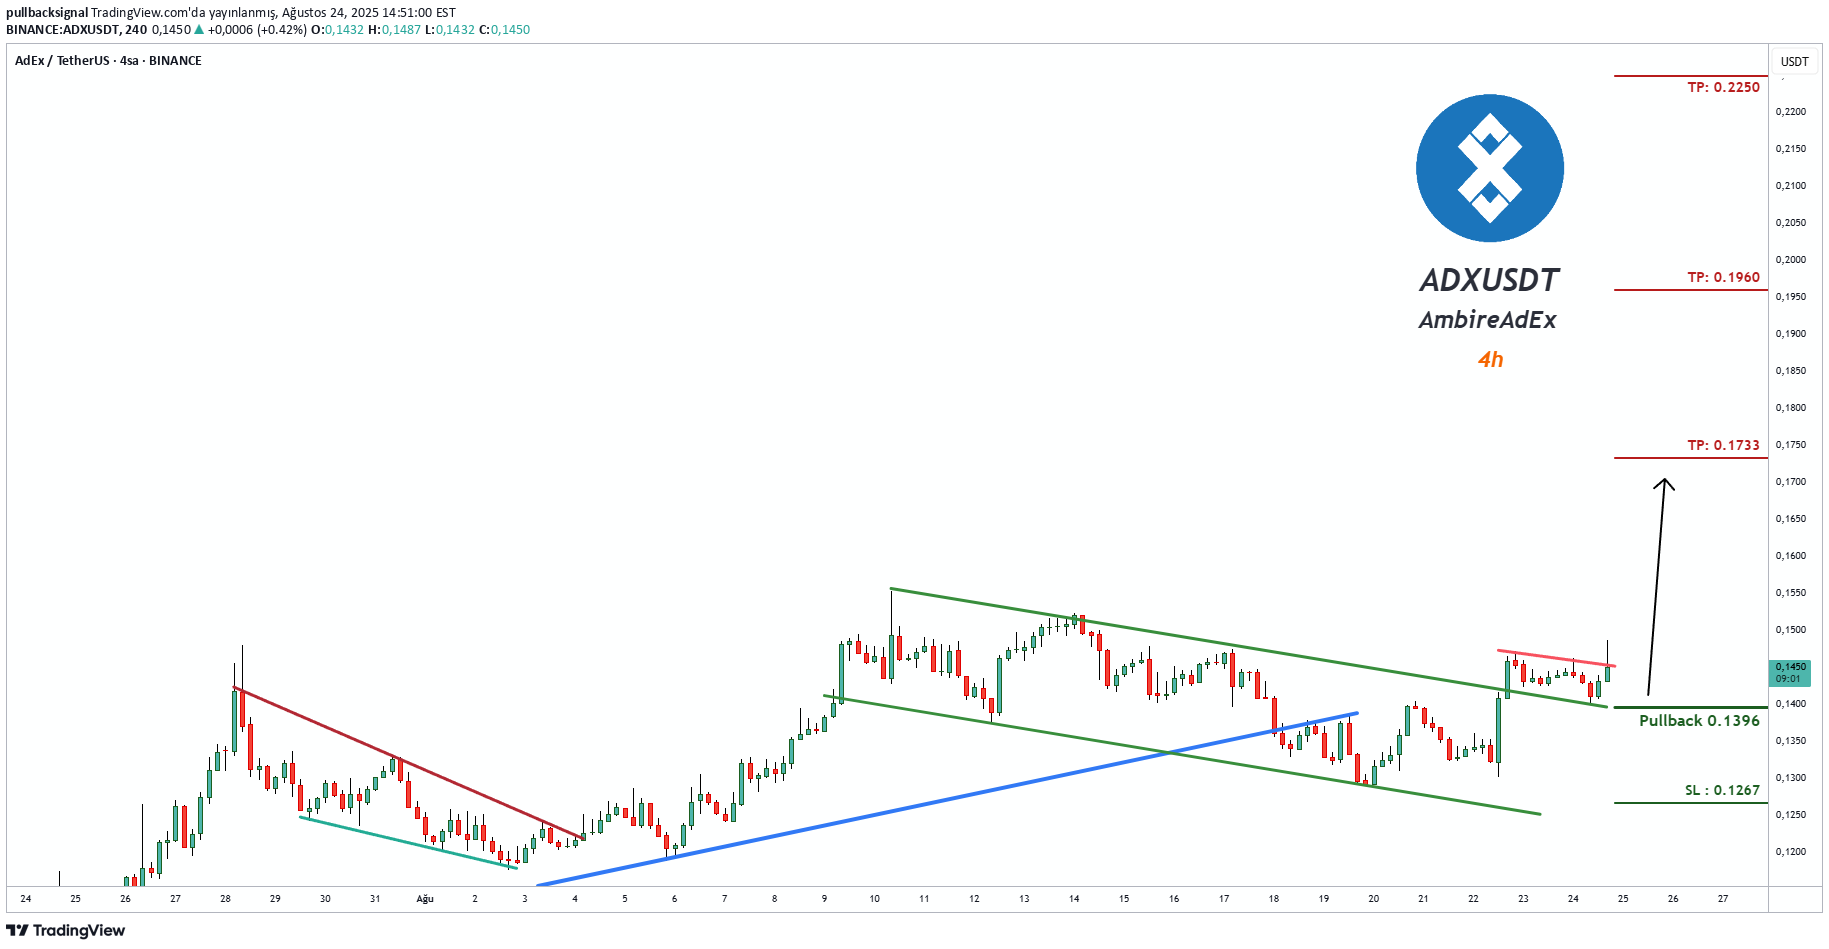
İşlem Kurulumu: ADXUSDT AmbireAdEx'te (4s) bir İşlem Sinyali görülüyor İşlemciler ŞİMDİ Alım İşlemlerini açabilirler ⬆️Şimdi Al veya 0,1396'da Al ⭕️SL @ 0,1267 🔵TP1 @ 0,1733 🔵TP2 @ 0,1960 🔵TP3 @ 0,2250 Bu sinyaller neye dayanıyor? Klasik Teknik Analiz Fiyat Hareketi Mum Grafikleri Fibonacci RSI, Hareketli Ortalama, Ichimoku, Bollinger Bantları Risk Uyarısı Forex, CFD, Kripto, Vadeli İşlemler ve Hisse Senetleri ticareti kayıp riski içerir. Lütfen bu tür işlemlerin sizin için uygun olup olmadığını dikkatlice değerlendirin. Geçmiş performans, gelecekteki sonuçların göstergesi değildir. Fikirlerimizi beğendiyseniz, lütfen beğenileriniz 👍 ve yorumlarınızla bizi destekleyin.
pullbacksignal
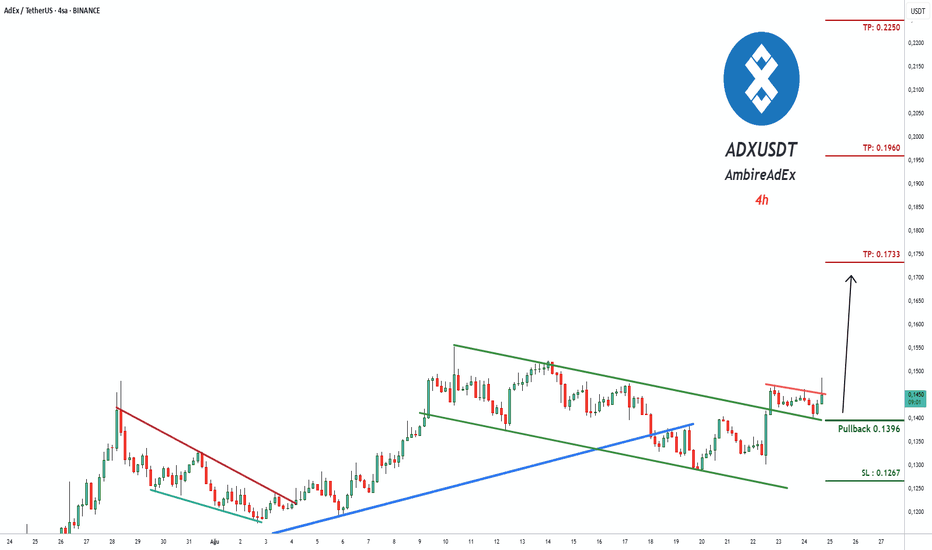
İşlem Kurulumu: ADXUSDT AmbireAdEx'te (4s) bir İşlem Sinyali görülüyor İşlemciler ŞİMDİ Alım İşlemlerini açabilirler ⬆️Şimdi Al veya 0,1396'da Al ⭕️SL @ 0,1267 🔵TP1 @ 0,1733 🔵TP2 @ 0,1960 🔵TP3 @ 0,2250 Bu sinyaller neye dayanıyor? Klasik Teknik Analiz Fiyat Hareketi Mum Grafikleri Fibonacci RSI, Hareketli Ortalama, Ichimoku, Bollinger Bantları Risk Uyarısı Forex, CFD, Kripto, Vadeli İşlemler ve Hisse Senetleri ticareti kayıp riski içerir. Lütfen bu tür işlemlerin sizin için uygun olup olmadığını dikkatlice değerlendirin. Geçmiş performans, gelecekteki sonuçların göstergesi değildir. Fikirlerimizi beğendiyseniz, lütfen beğenileriniz 👍 ve yorumlarınızla bizi destekleyin.
pullbacksignal
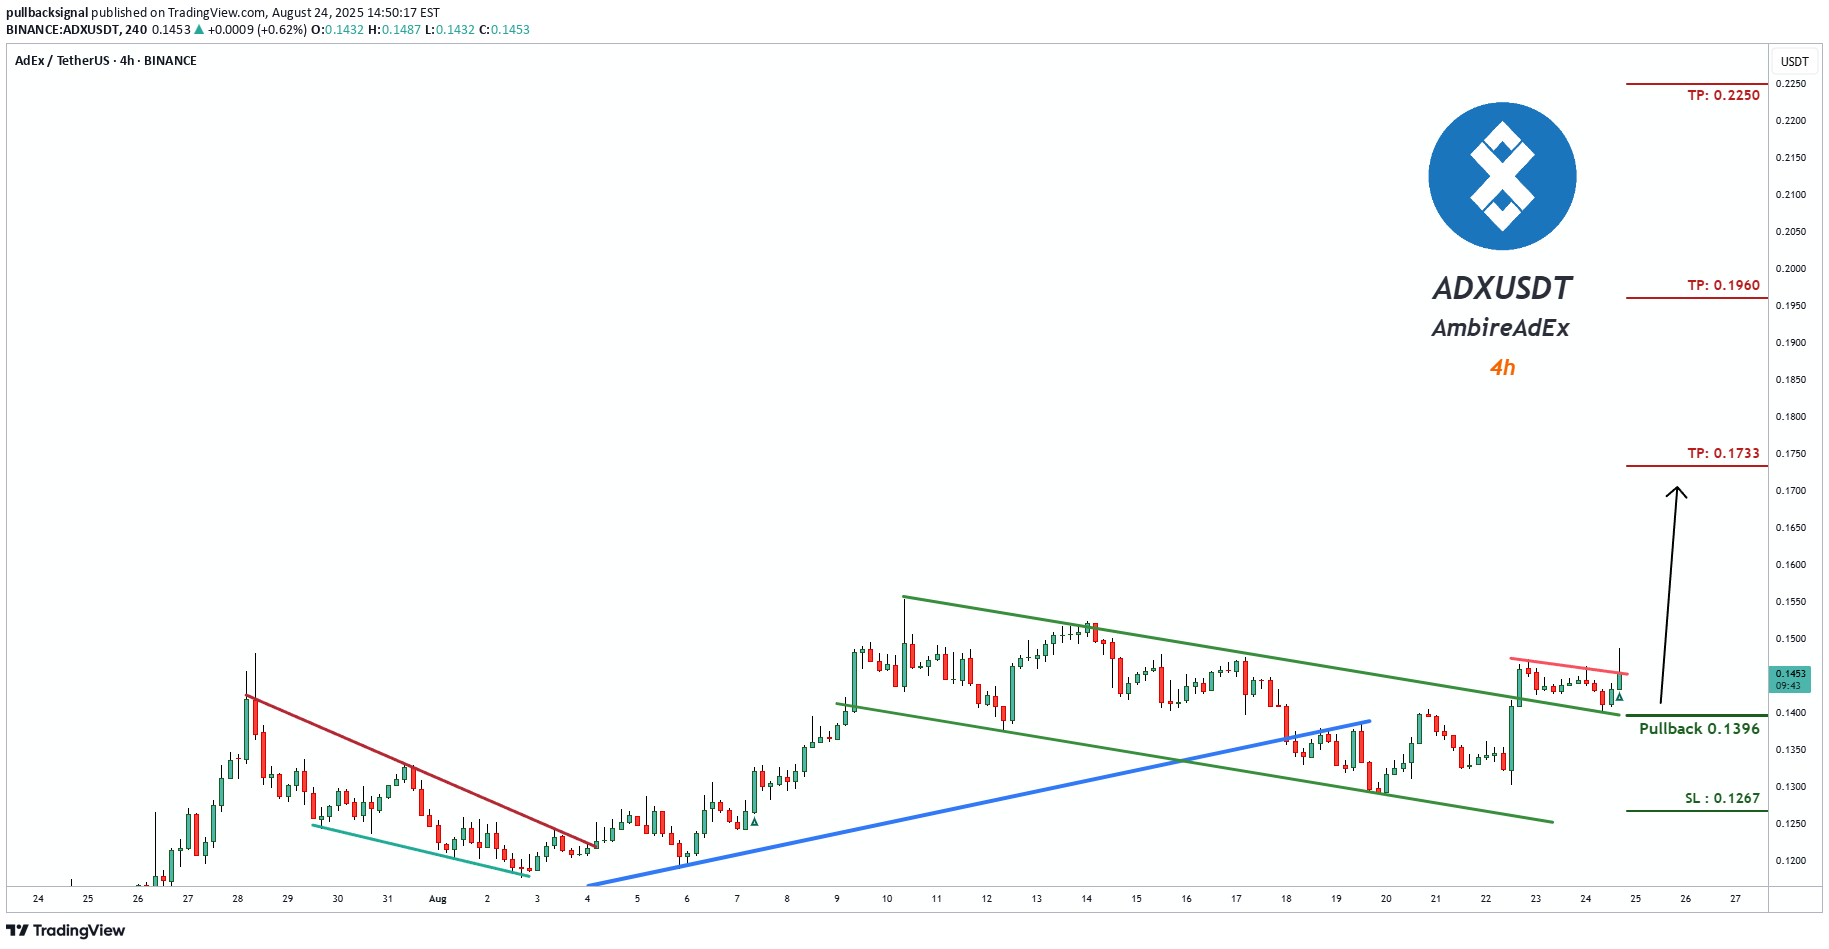
Trading Setup: A Trading Signal is seen in the ADXUSDT AmbireAdEx (4h) Traders can open their Buy Trades NOW ⬆️Buy now or Buy on 0.1396 ⭕️SL @ 0.1267 🔵TP1 @ 0.1733 🔵TP2 @ 0.1960 🔵TP3 @ 0.2250 What are these signals based on? Classical Technical Analysis Price Action Candlesticks Fibonacci RSI, Moving Average , Ichimoku , Bollinger Bands Risk Warning Trading Forex, CFDs, Crypto, Futures, and Stocks involve a risk of loss. Please consider carefully if such trading is appropriate for you. Past performance is not indicative of future results. If you liked our ideas, please support us with your likes 👍 and comments .

CryptoWithJames

Pattern: Falling Wedge Breakout Current Price: \$0.0971 Target Price: \$0.1300 Target % Gain: 55.44% Technical Analysis: ADX has broken out of a falling wedge pattern on the 12H chart with strong bullish momentum and a clear breakout candle. Volume surge confirms the breakout. Time Frame: 12H

muhammettasdelen80

پس از یک افت بزرگ، شکست حجمی خوبی اتفاق افتاد. اهداف همانطور که نشان دادم هستند، فقط صبر کنید.

CryptoAnalystSignal

#ADX The price is moving within a descending channel on the 1-hour frame, adhering well to it, and is heading for a strong breakout and retest. We are seeing a bounce from the lower boundary of the descending channel, which is support at 0.0914. We have a downtrend on the RSI indicator that is about to break and retest, supporting the upward trend. We are looking for stability above the 100 moving average. Entry price: 0.0935 First target: 0.0951 Second target: 0.0966 Third target: 0.0986#ADX First target: 0.0951 Reached Second target: 0.0966 Reached Third target: 0.0986 Reached

CryptoNuclear

ADX ~ 1D Analysis#ADX Buy after successfully penetrating this resistant line with a short -term target of at least 15%+.
CryptoAnalystSignal

#ADEX The price is moving in a descending channel on the 1-hour frame and is expected to continue upward. We have a trend to stabilize above the 100 moving average once again. We have a downtrend on the RSI indicator that supports the upward move with a breakout. We have a support area at the lower boundary of the channel at 0.1006. Entry price: 0.1050 First target: 0.1066 Second target: 0.1084 Third target: 0.1111#ADEX First target: 0.1066 Reached Second target: 0.1084 Reached Third target: 0.1111 Reached
Disclaimer
Any content and materials included in Sahmeto's website and official communication channels are a compilation of personal opinions and analyses and are not binding. They do not constitute any recommendation for buying, selling, entering or exiting the stock market and cryptocurrency market. Also, all news and analyses included in the website and channels are merely republished information from official and unofficial domestic and foreign sources, and it is obvious that users of the said content are responsible for following up and ensuring the authenticity and accuracy of the materials. Therefore, while disclaiming responsibility, it is declared that the responsibility for any decision-making, action, and potential profit and loss in the capital market and cryptocurrency market lies with the trader.