
SPX
SPX6900
| تریدر | نوع سیگنال | حد سود/ضرر | زمان انتشار | مشاهده پیام |
|---|---|---|---|---|
لم يتم العثور على نتائج. | ||||
مخطط سعر SPX6900
سود ثلاثة أشهر :
سیگنالهای SPX6900
مرشح
فرز الرسالة بناءً على
نوع التاجر
الإطار الزمني

Saitamasignal
SPX potential breakout
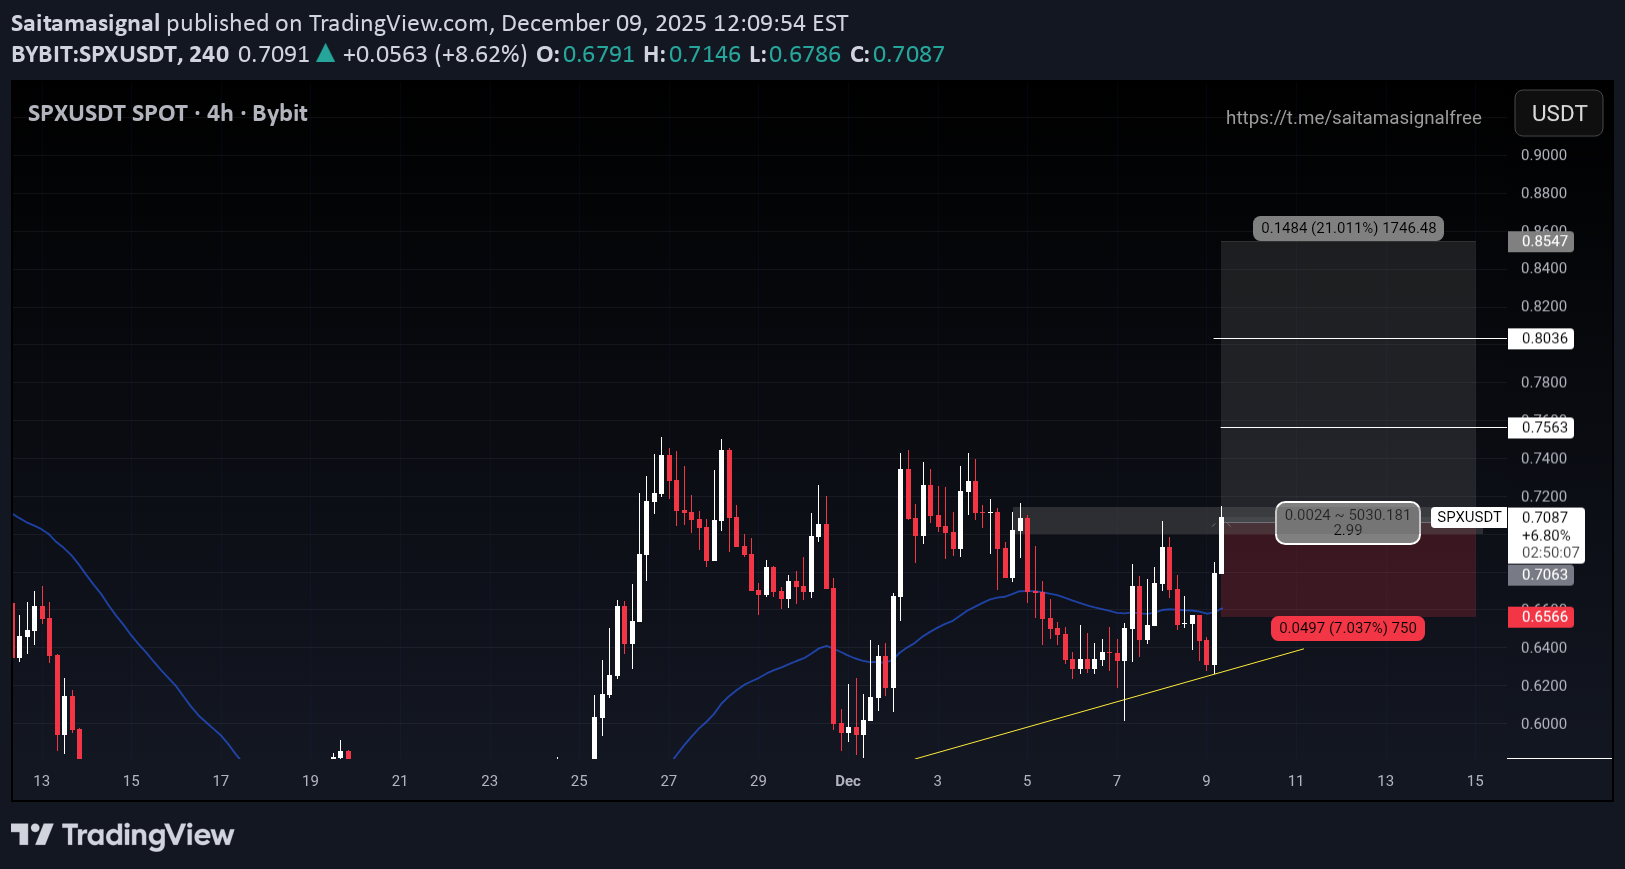
اسم العملة: SPXUSDT (معزولة) شراء منطقة طویلة: 1) 0.7063 جنی الربح : 1) 0.7563 2) 0.8036 3) 0.8547 وقف الخسارة: 0.6566 الحد الأقصى للرافعة المالیة: 7x المبلغ : 2.0% إخلاء المسؤولیة: هذه لیست نصیحة مالیة. قم دائمًا بإجراء الأبحاث الخاصة بک واستخدم إدارة المخاطر الصارمة. سوق التشفیر متقلب للغایة.

BandForBands
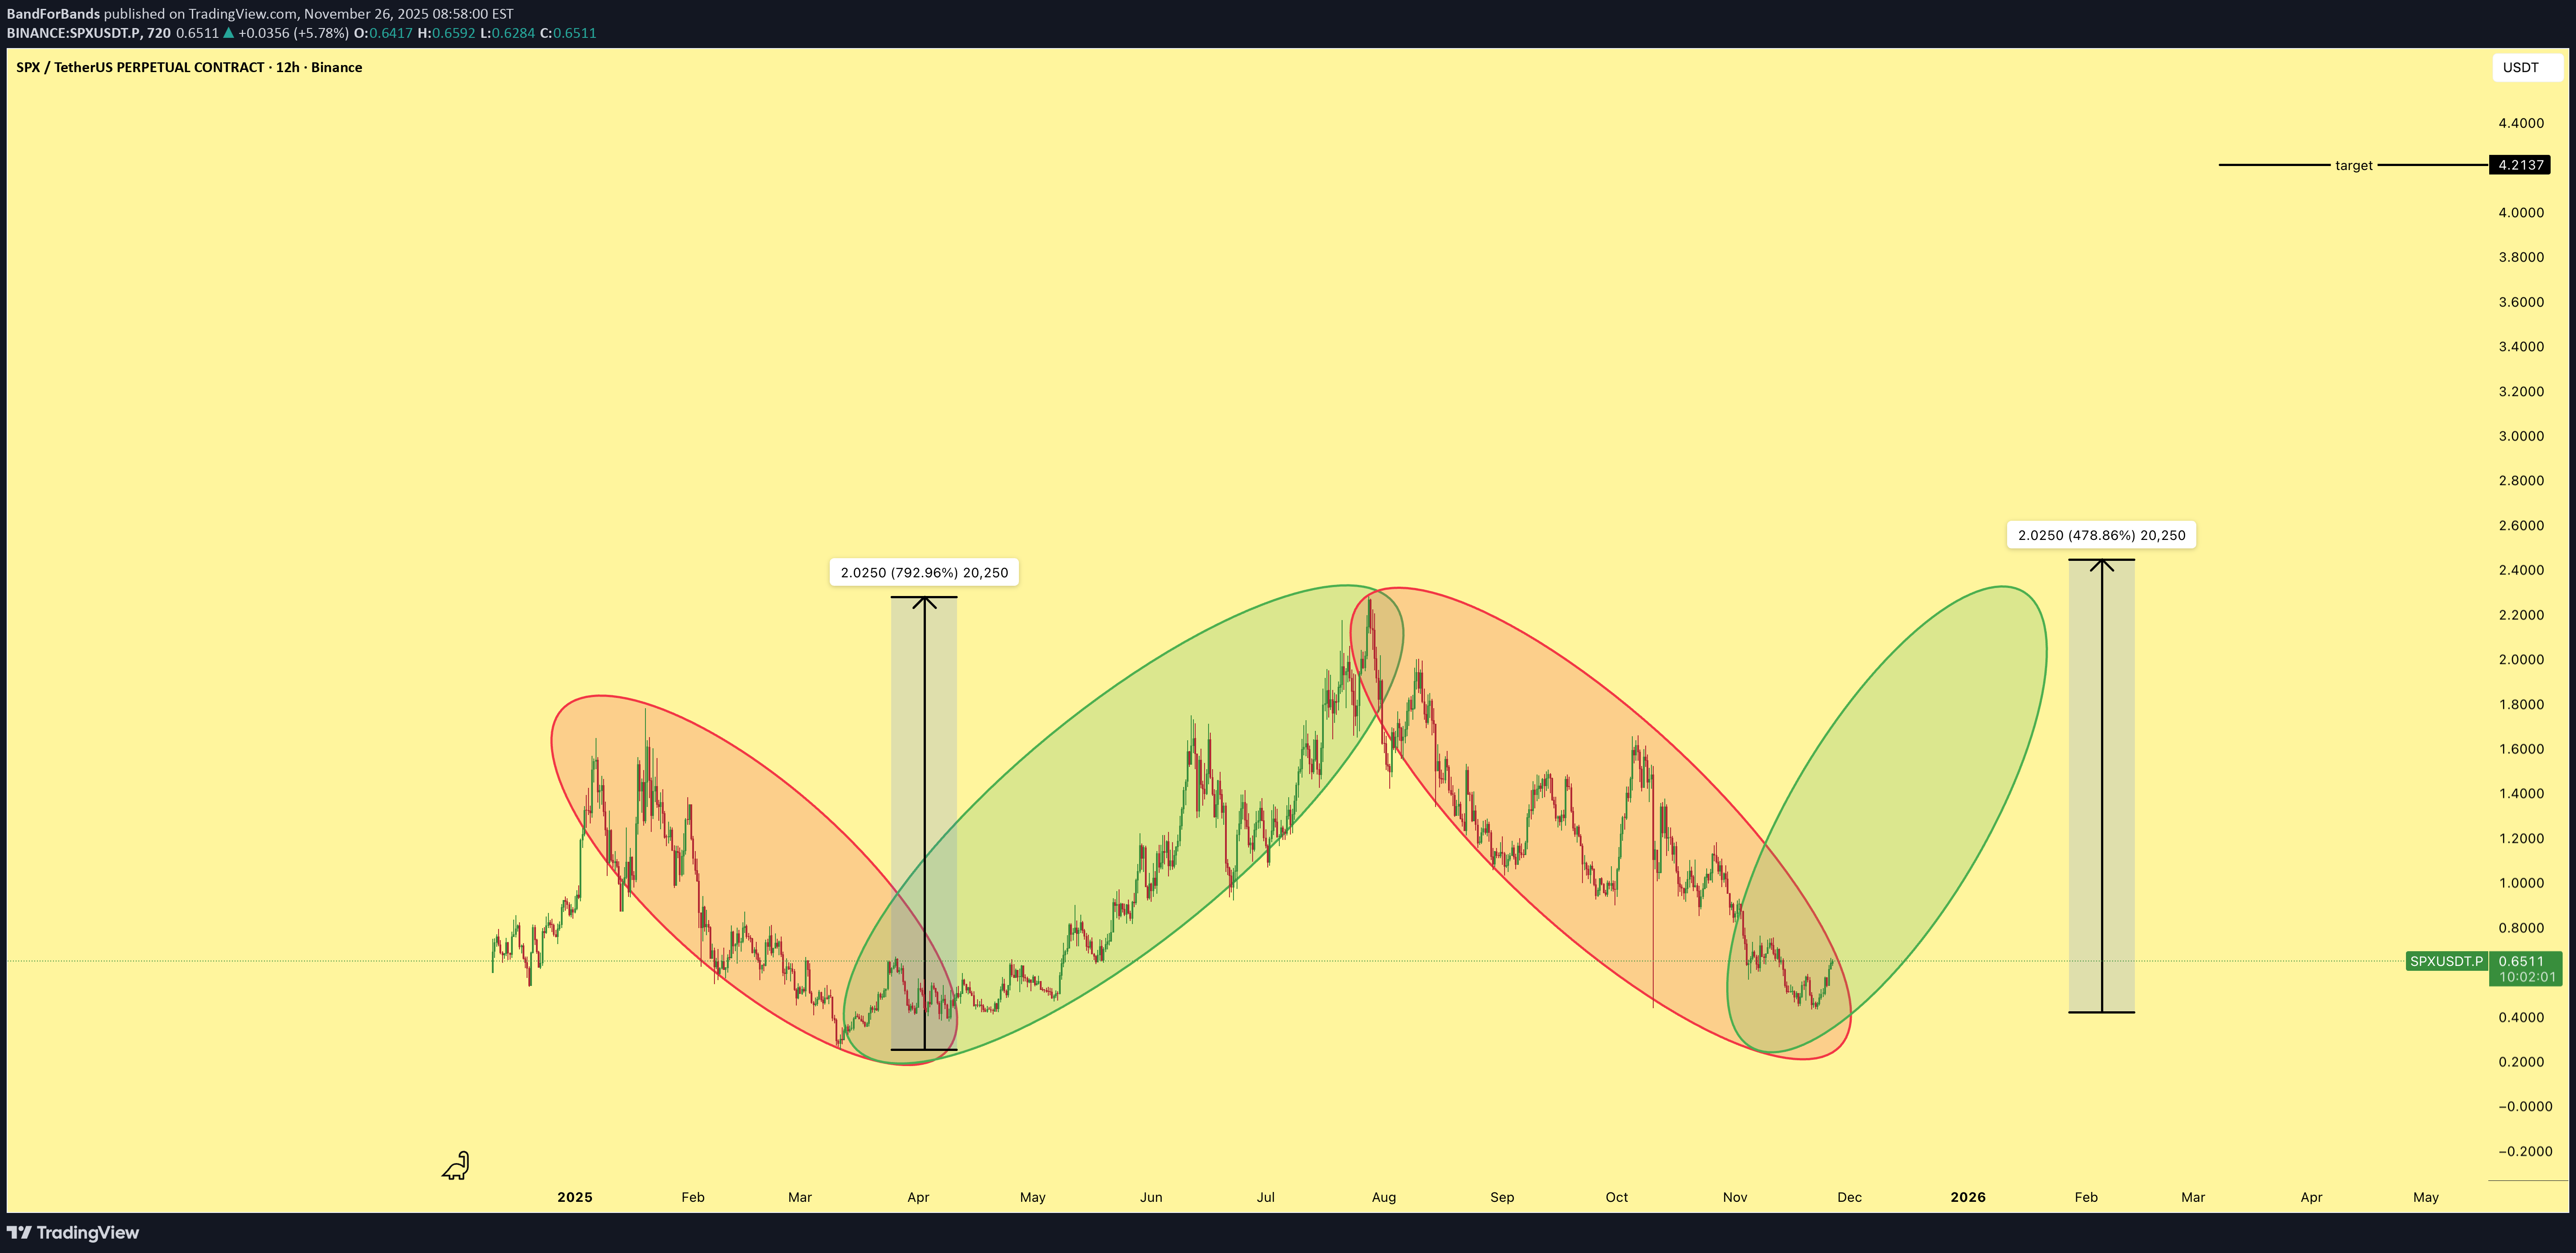
هدف نهایی SPX کجاست؟ رمزگشایی از هدف ۴.۲ دلاری برای شاخص S&P 500
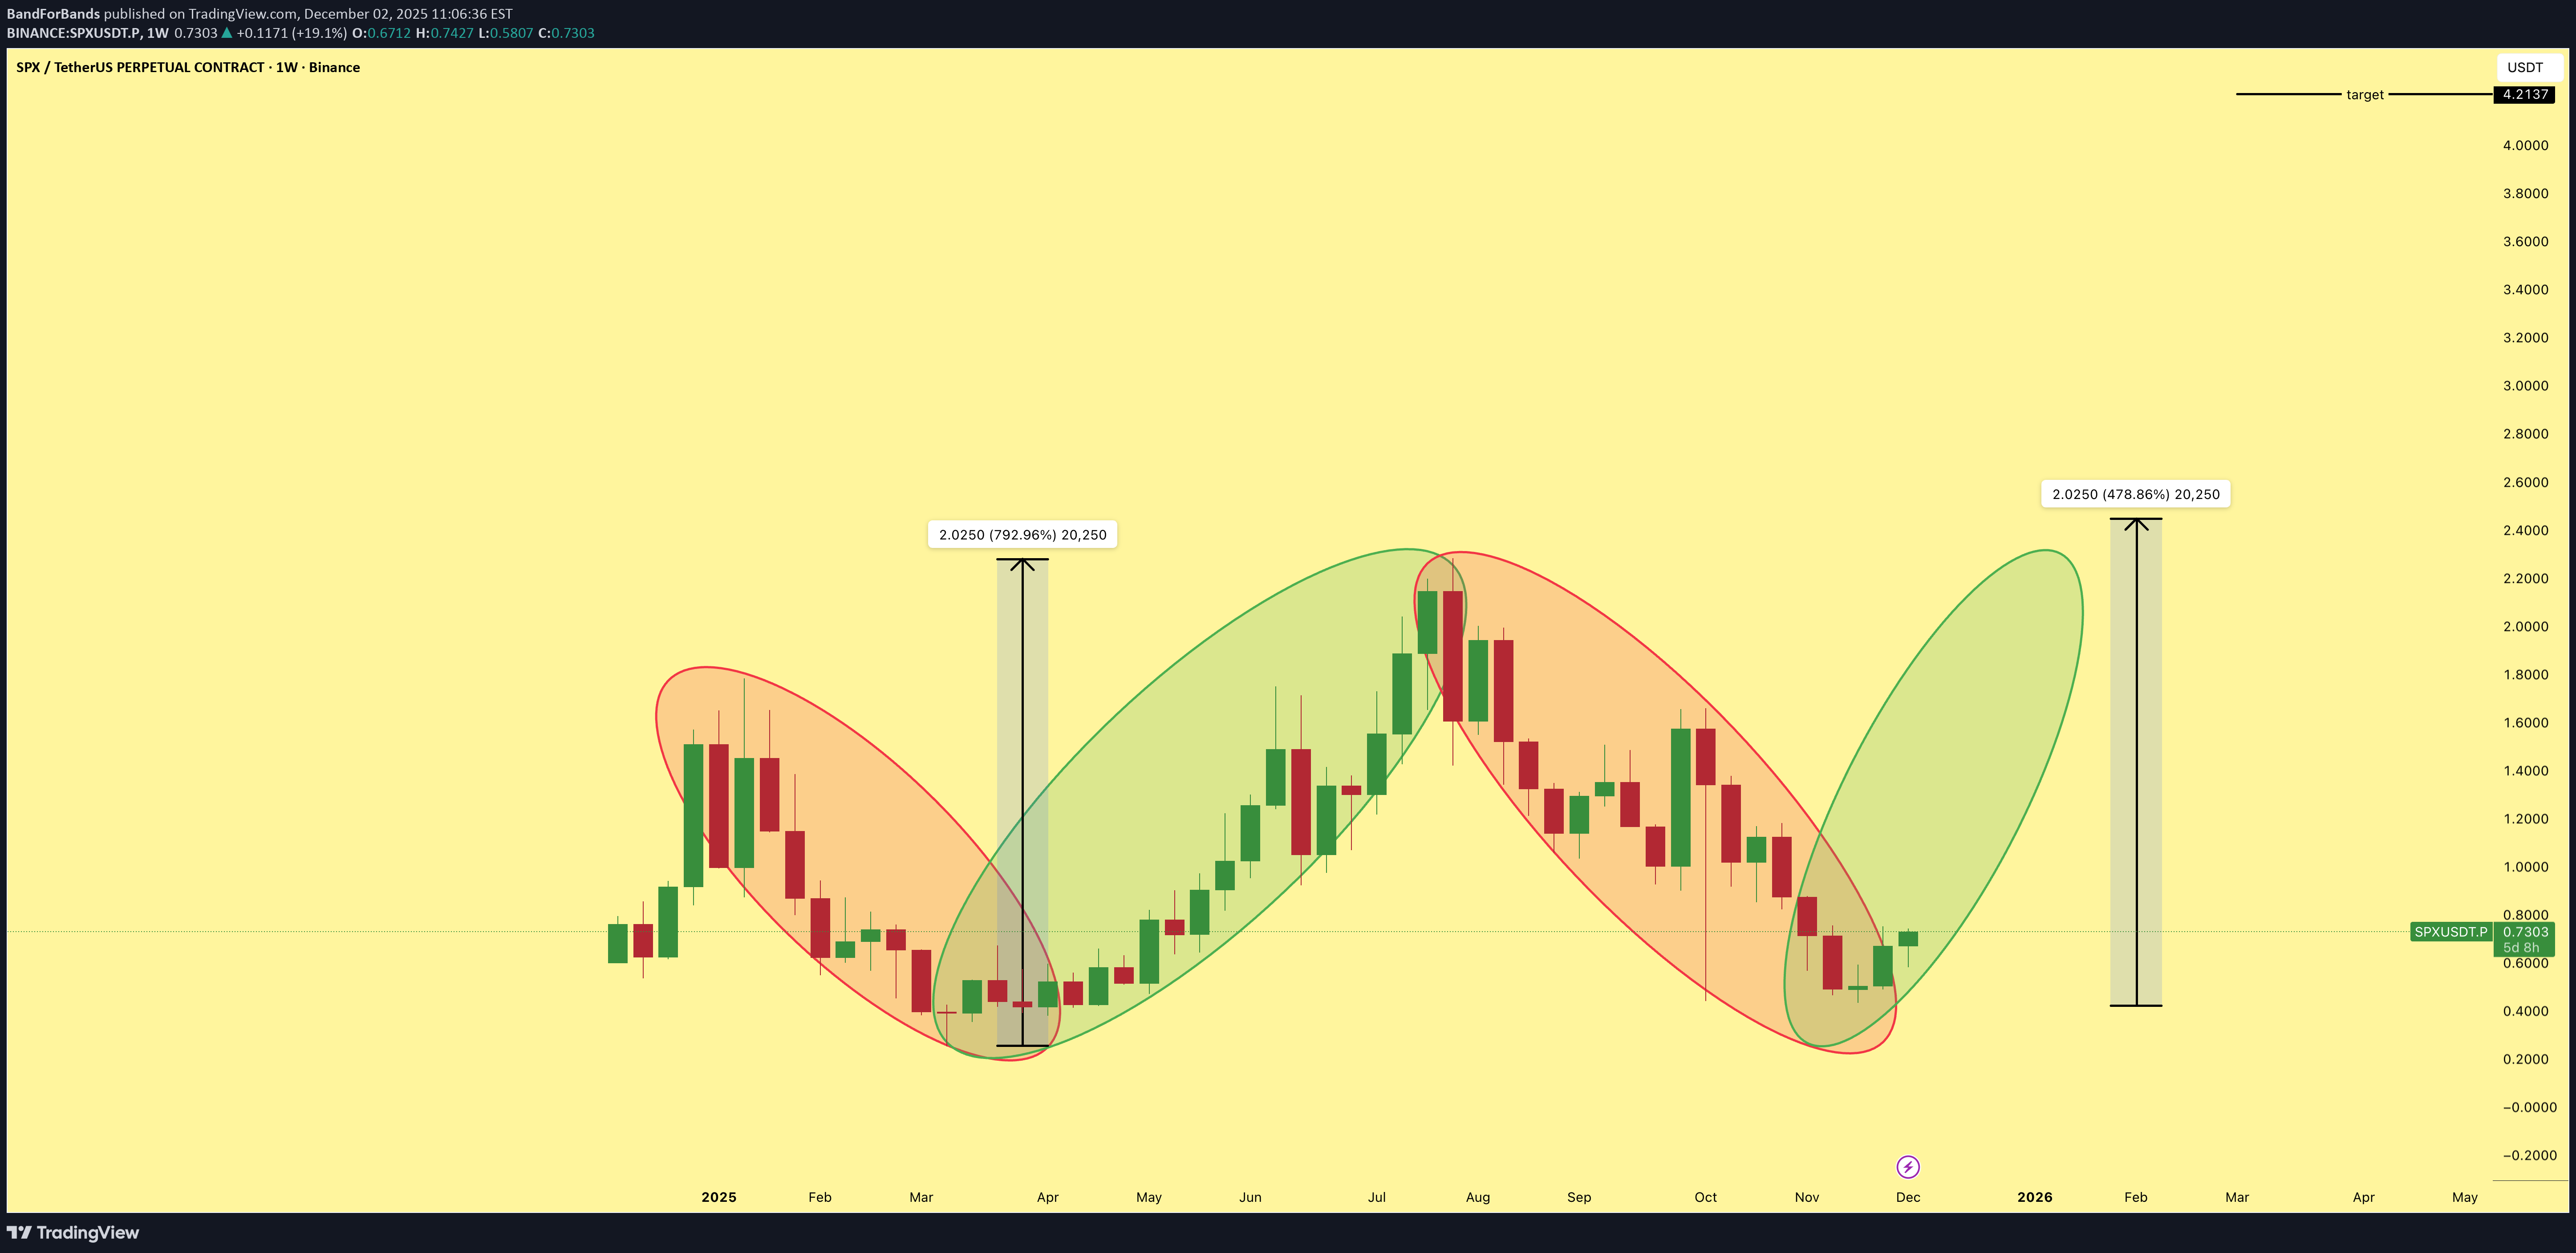
4.2 دولار هو الهدف $سبس. لقد دخلنا بشکل جماعی عند القاع ونحتفظ عند مستوى 4.2$ لأننا نؤمن بشیء ما. الهیکل نظیف، والزخم آخذ فی التزاید، والاتجاه فی صالحنا.

sladkamala123
SPX: آیا سقوط تمام شده؟ تحلیل کلیدی حمایت و مقاومت مهم
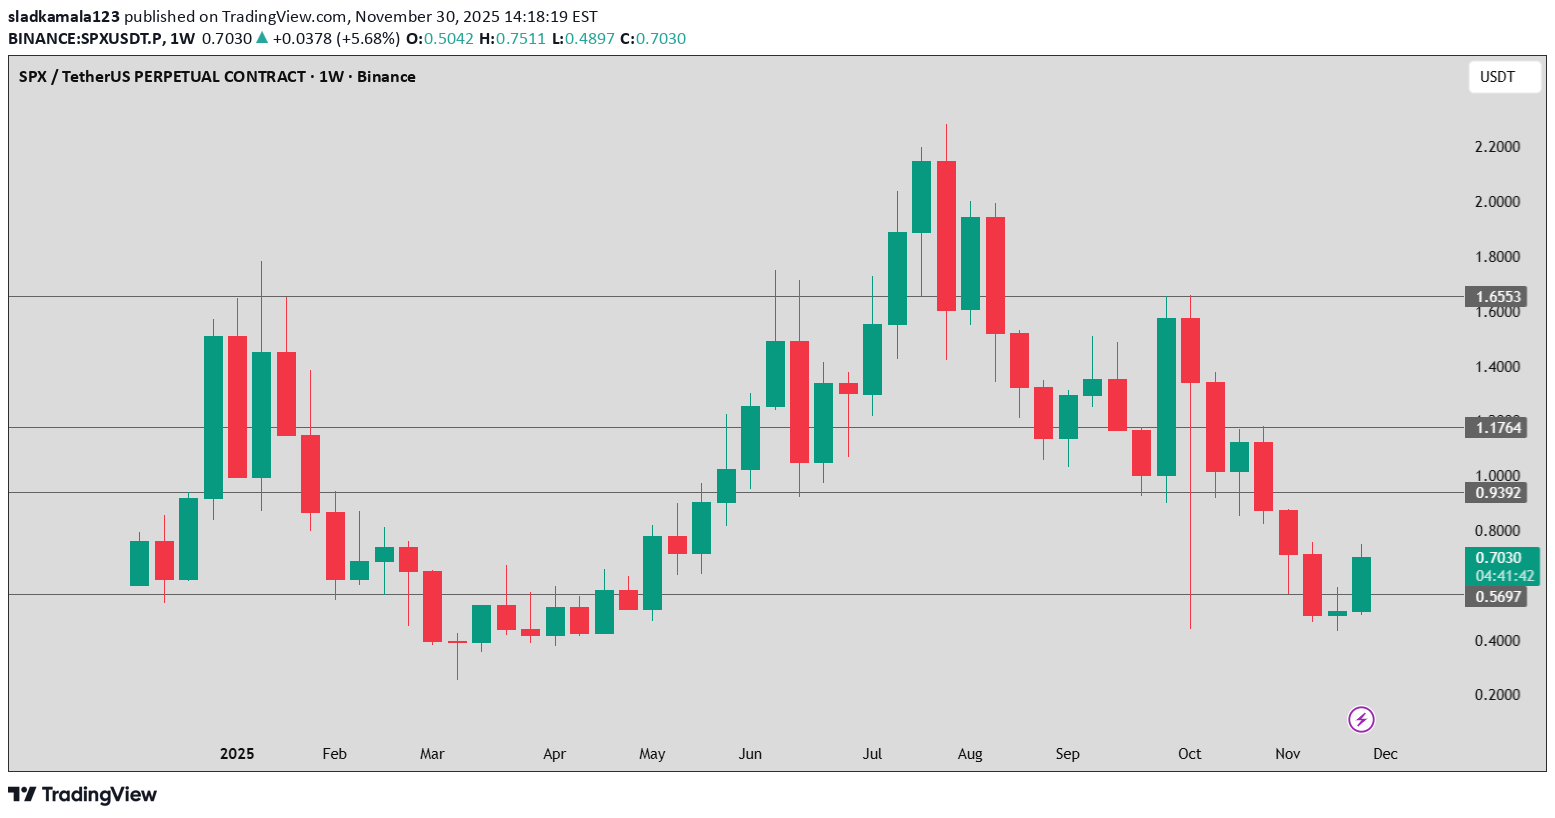
SPX فی اتجاه هبوطی واسع النطاق بعد دورة صعودیة کاملة. تشیر الشمعة الخضراء الأخیرة إلى ارتداد مؤقت، ولیس انعکاسًا مؤکدًا. المقاومة الرئیسیة: 1.00 دولار أمریکی الدعم الرئیسی: 0.5697 دولار أمریکی الاختراق فوق 1.00 سیکون أول تأکید صعودی حقیقی.

iMoneyTeam
تحلیل تکنیکال SPX: منتظر سقوط بیشتر با اهداف مشخص (استراتژی فروش)
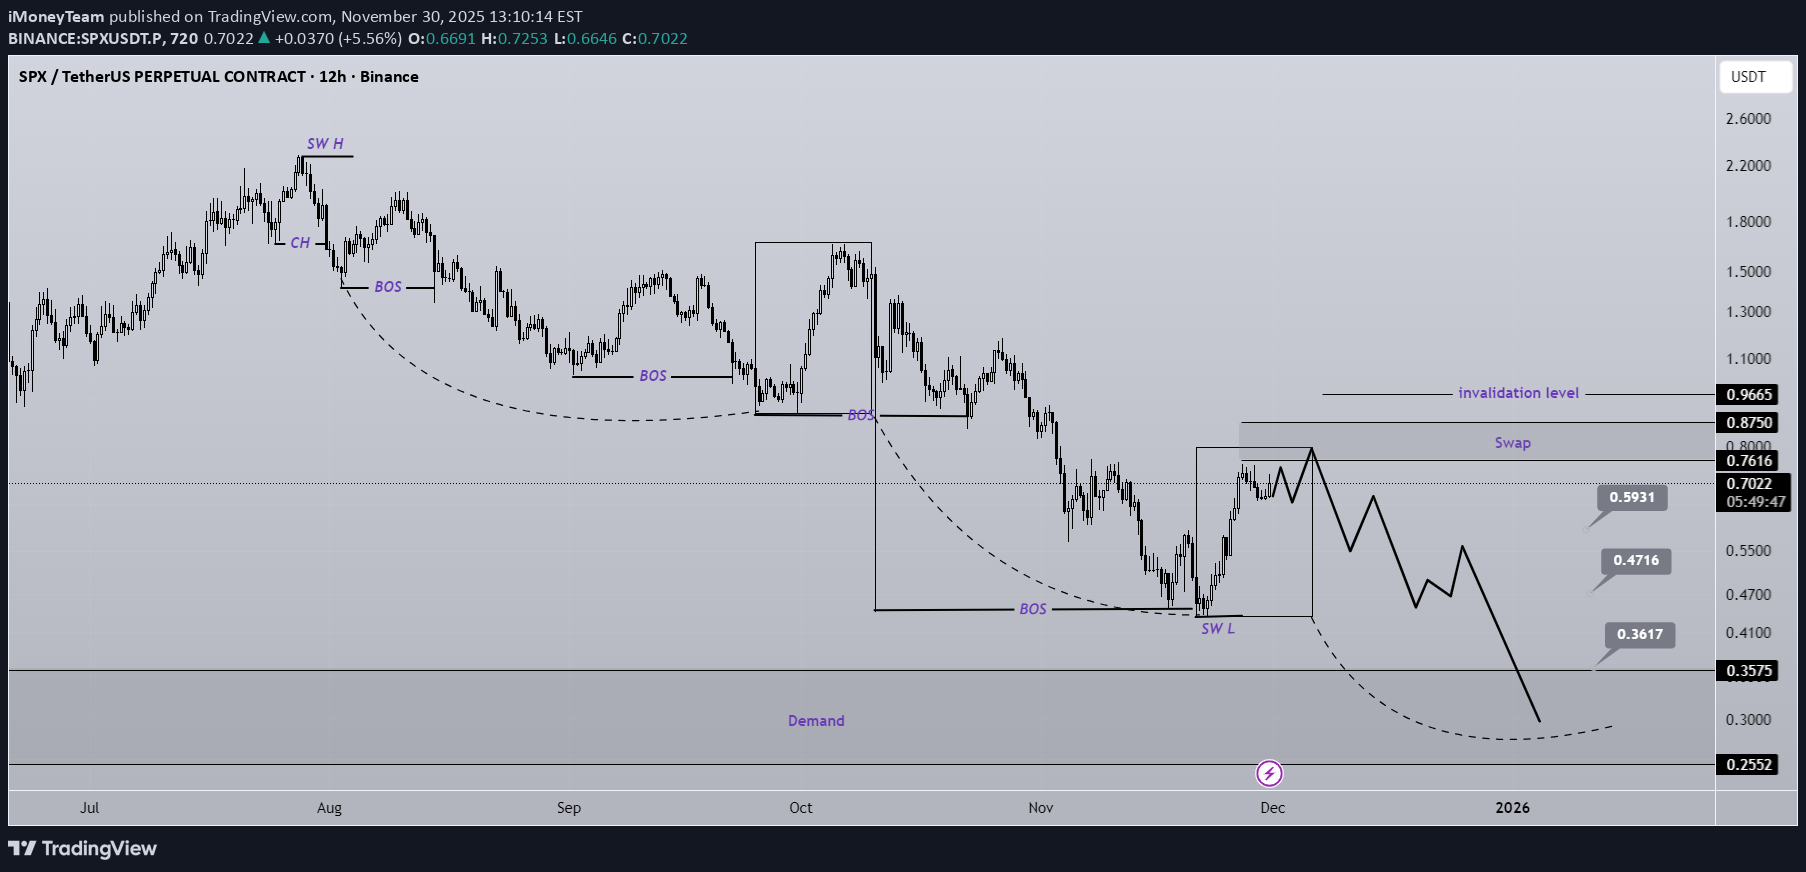
کما هو موضح فی الرسم البیانی، فإن الهیکل SPX هبوطی لأن لدینا CH (تغییر الشخصیة) و BOS (کسر الهیکل) هبوطی. بناءً على الفرکتلات المشار إلیها بالخطوط المتقطعة والمستطیلات المرسومة، یجب أن نتوقع موجة هبوطیة أخرى فی هذا الإطار الزمنی. نحن نبحث عن مراکز بیع/بیع حول منطقة المبادلة. تم تحدید الأهداف على الرسم البیانی. إغلاق الشمعة الیومیة فوق مستوى الإبطال سوف یبطل هذا التحلیل. لا تدخل المرکز بدون إدارة رأس المال وتوقف عن الإعداد التعلیق إذا کان لدیک أی أسئلة شکرا لک

WaveRiders2
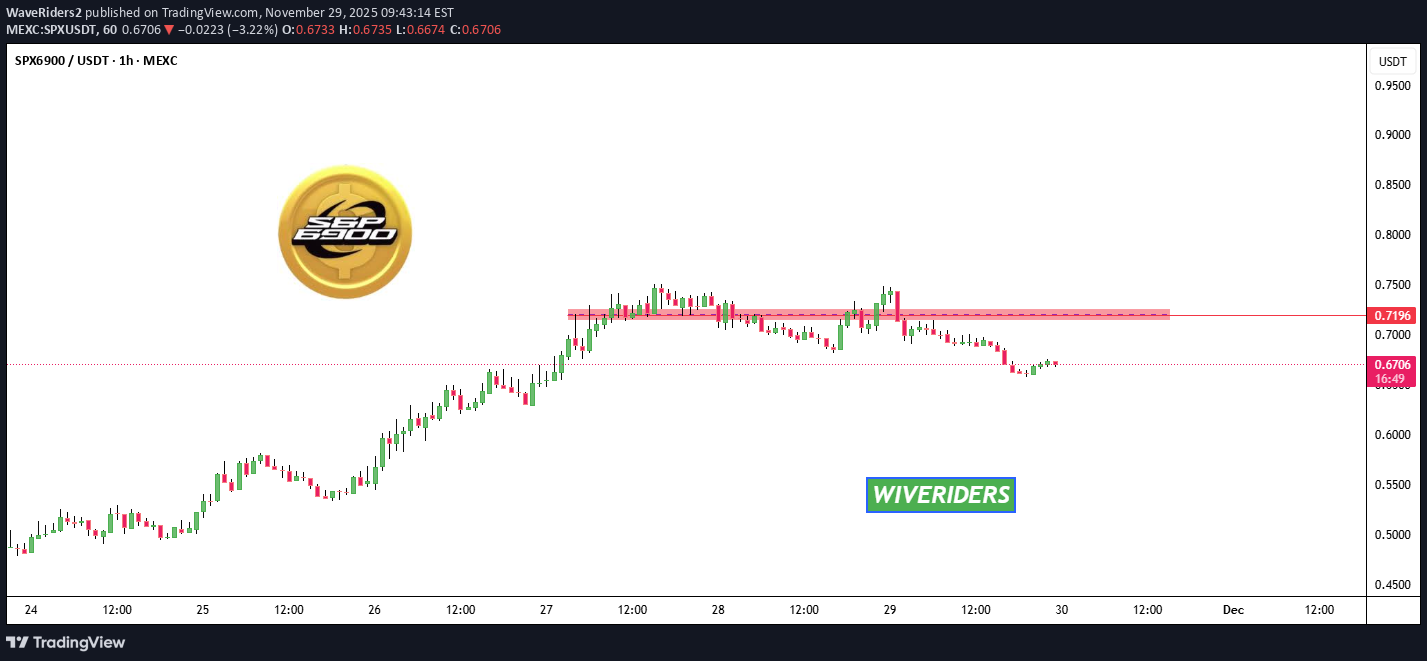
مقاومت جدید SPX: سقف قرمز بازار کجاست و چه زمانی خریداران قدرت میگیرند؟

TuffyBro
پیشنهاد معامله فروش SPX: آیا این ارز دیجیتال غیرمنتظره قوی است؟
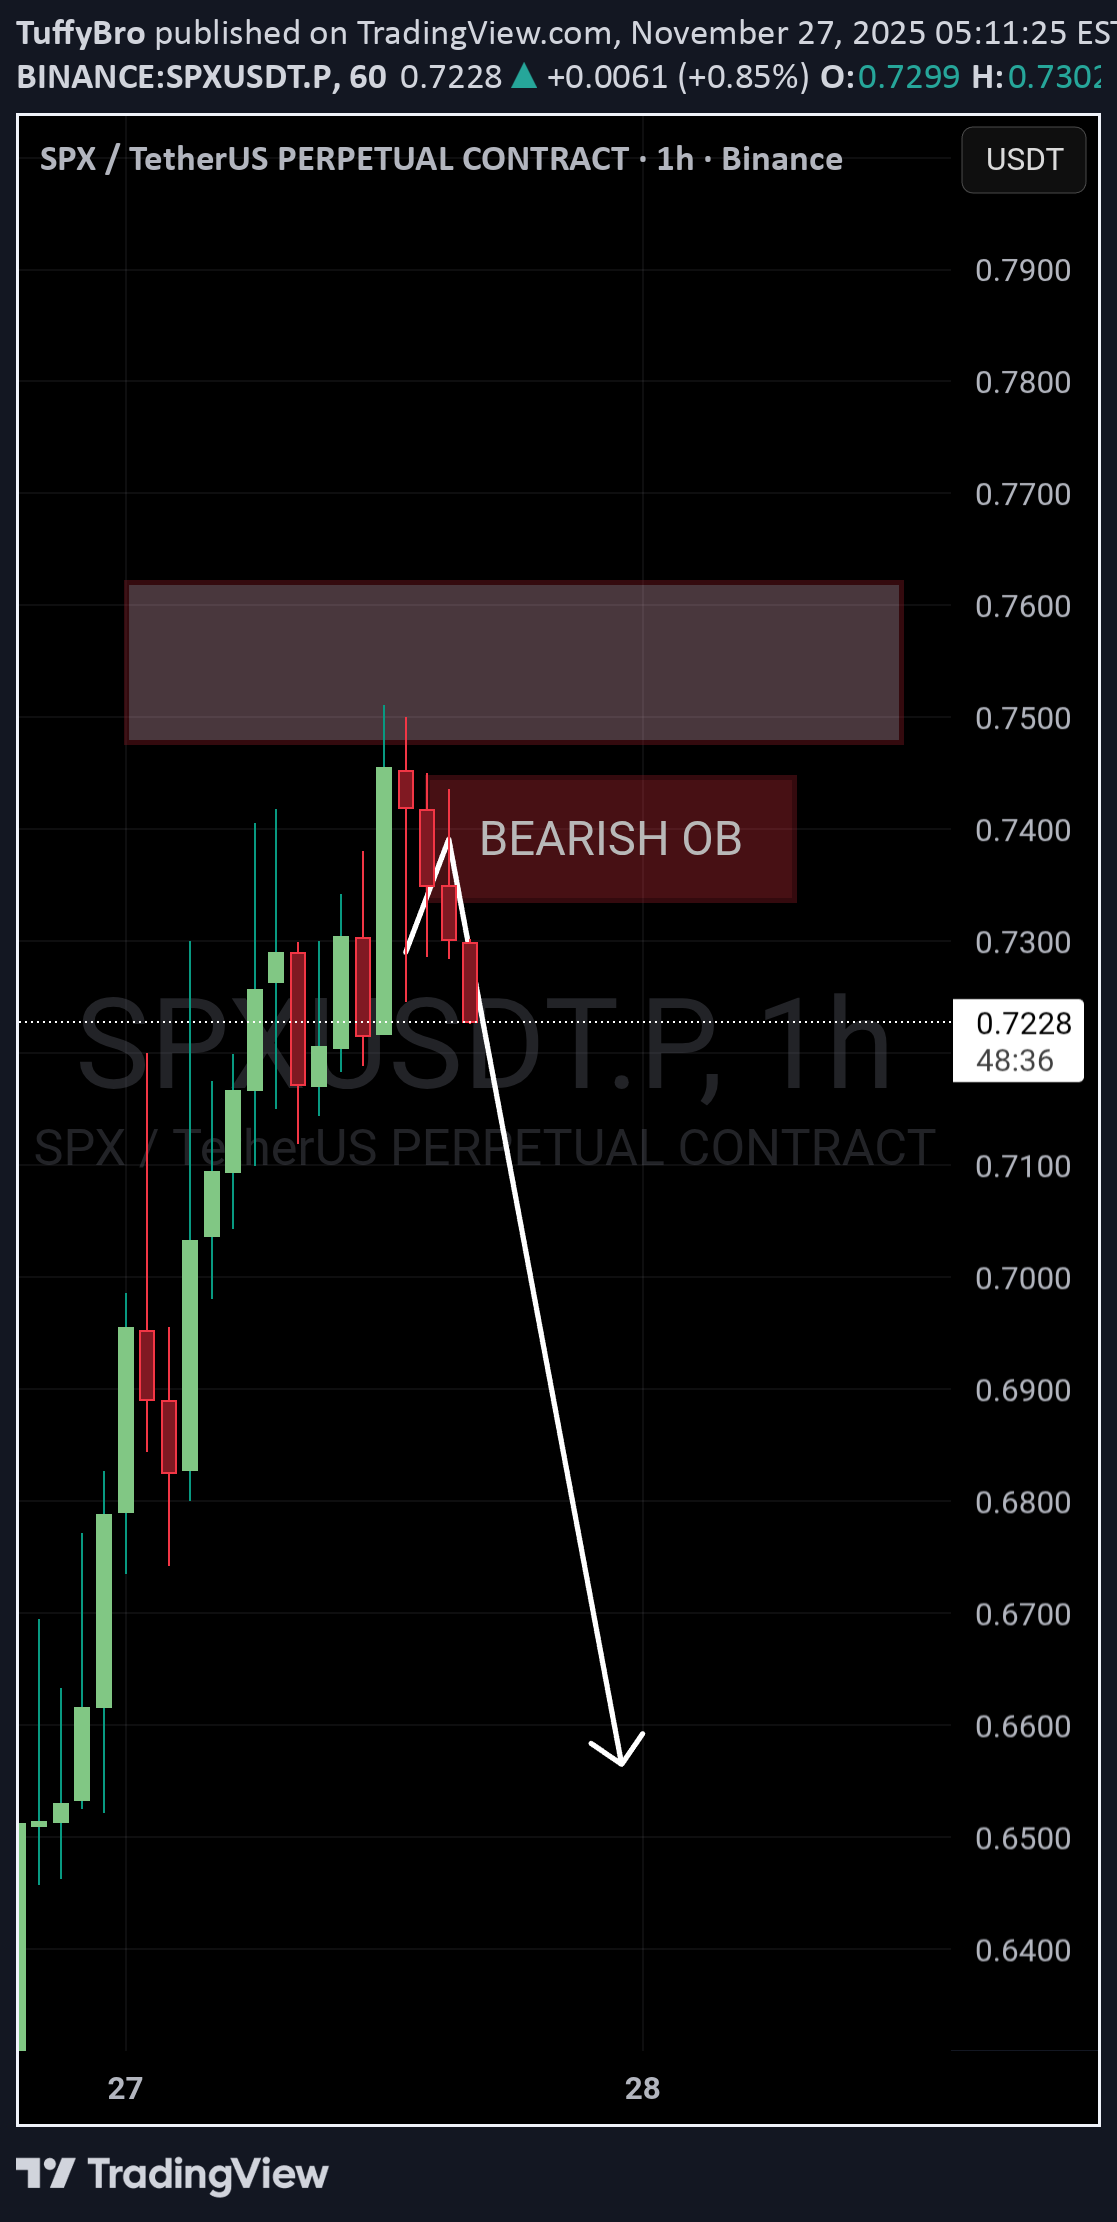
↳البیع على المکشوف SPX6900 هنا، لست متأکدًا من سبب قوة عملة الشیتکوین هذه ملاحظة: لا یوجد الکثیر من السیولة/حجم التداول فی Hyperliquid، والعقود الآجلة لـ Binance أفضل، إذا کنت تتداول فی بورصات أخرى، تحقق من السیولة.
WaveRiders2
BandForBands
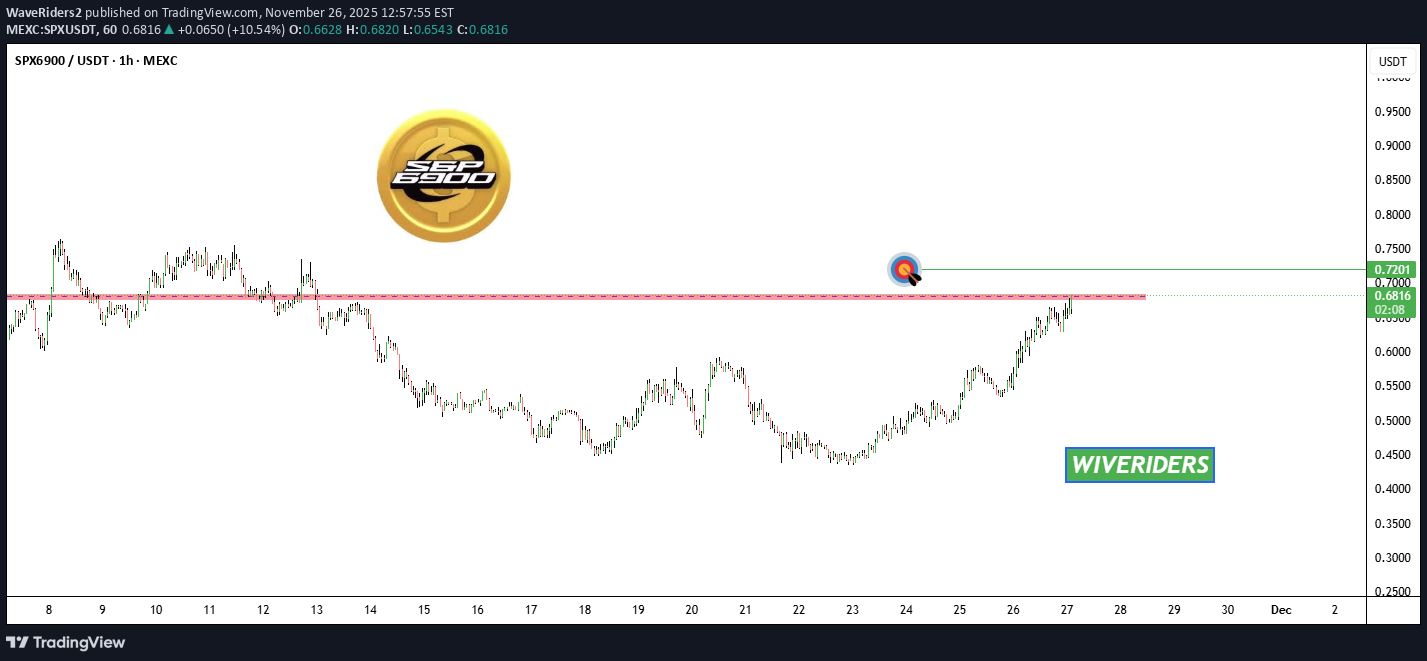
تحلیل SPX: آیا کف بازار زده شد؟ حرکت بزرگ صعودی بعدی آغاز میشود!
یمکنک أن ترى بوضوح ما یحدث مع $سبس. لقد وصل إلى القاع. کان لدینا اتجاه هبوطی، واتجاه صعودی، واتجاه هبوطی، والآن حان الوقت للاتجاه الصعودی التالی. یشیر الهیکل مباشرة نحو move إلى 4 دولارات زائد. یتغیر الزخم ویصطف الدوران.

c_views
الگوی دوقلو در SPX: آیا سقوط نهایی آغاز میشود؟
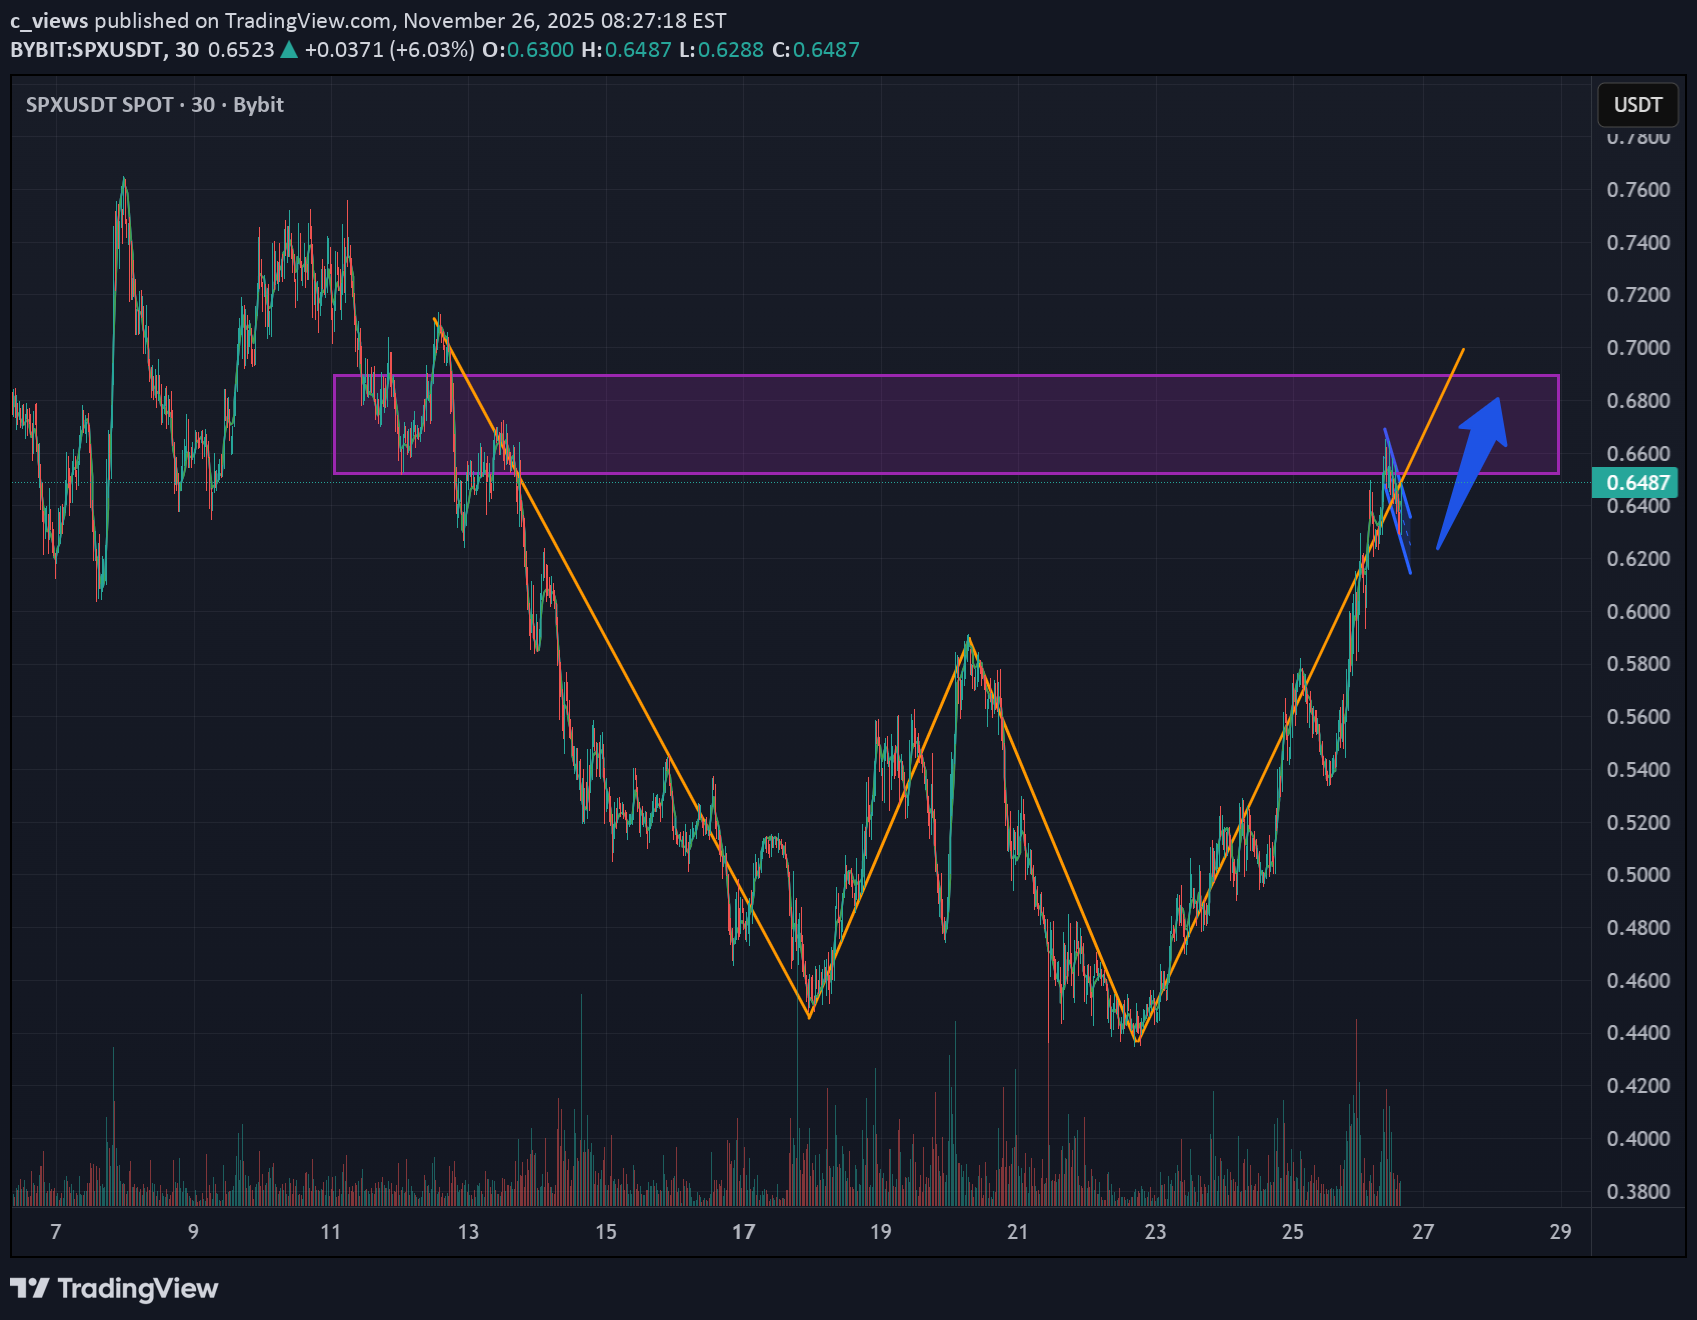
لقد شکل SPX عالمیًا W نمط، أو قاع مزدوج ، وهو حالیاً فی المرحلة النهائیة من التشکیل، والذی من المرجح أن یصل إلى منطقة التصفیة المظللة باللون الأرجوانی. السعر الحالی: 0.6333 دولار إذا کسر السعر المستوى الذی وصلت إلیه القمة السابقة، فمن المرجح أن یتم کسر الهیکل الصعودی، وقد یستمر movement فی الانخفاض. تفصیل کامل على الموقع
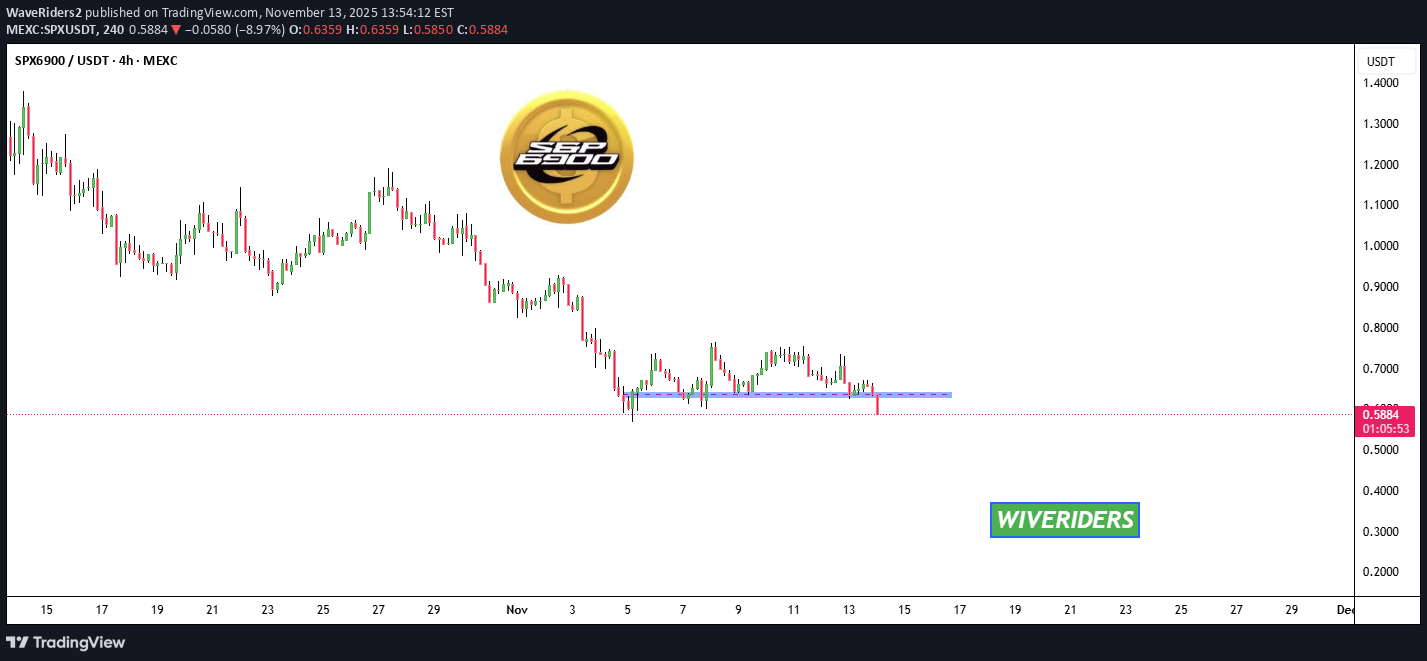
WaveRiders2
هشدار تحلیل تکنیکال: سقوط SPX زیر سطح حیاتی آبی – آیا بازار نزولی میشود؟
إخلاء المسؤولية
أي محتوى ومواد مدرجة في موقع Sahmeto وقنوات الاتصال الرسمية هي عبارة عن تجميع للآراء والتحليلات الشخصية وغير ملزمة. لا تشكل أي توصية للشراء أو البيع أو الدخول أو الخروج من سوق الأوراق المالية وسوق العملات المشفرة. كما أن جميع الأخبار والتحليلات المدرجة في الموقع والقنوات هي مجرد معلومات منشورة من مصادر رسمية وغير رسمية محلية وأجنبية، ومن الواضح أن مستخدمي المحتوى المذكور مسؤولون عن متابعة وضمان أصالة ودقة المواد. لذلك، مع إخلاء المسؤولية، يُعلن أن المسؤولية عن أي اتخاذ قرار وإجراء وأي ربح وخسارة محتملة في سوق رأس المال وسوق العملات المشفرة تقع على عاتق المتداول.