
OMNI
Omni Network
| تریدر | نوع سیگنال | حد سود/ضرر | زمان انتشار | مشاهده پیام |
|---|---|---|---|---|
لم يتم العثور على نتائج. | ||||
مخطط سعر Omni Network
سود ثلاثة أشهر :
سیگنالهای Omni Network
مرشح
فرز الرسالة بناءً على
نوع التاجر
الإطار الزمني

Bithereum_io
OMNIUSDT 1D
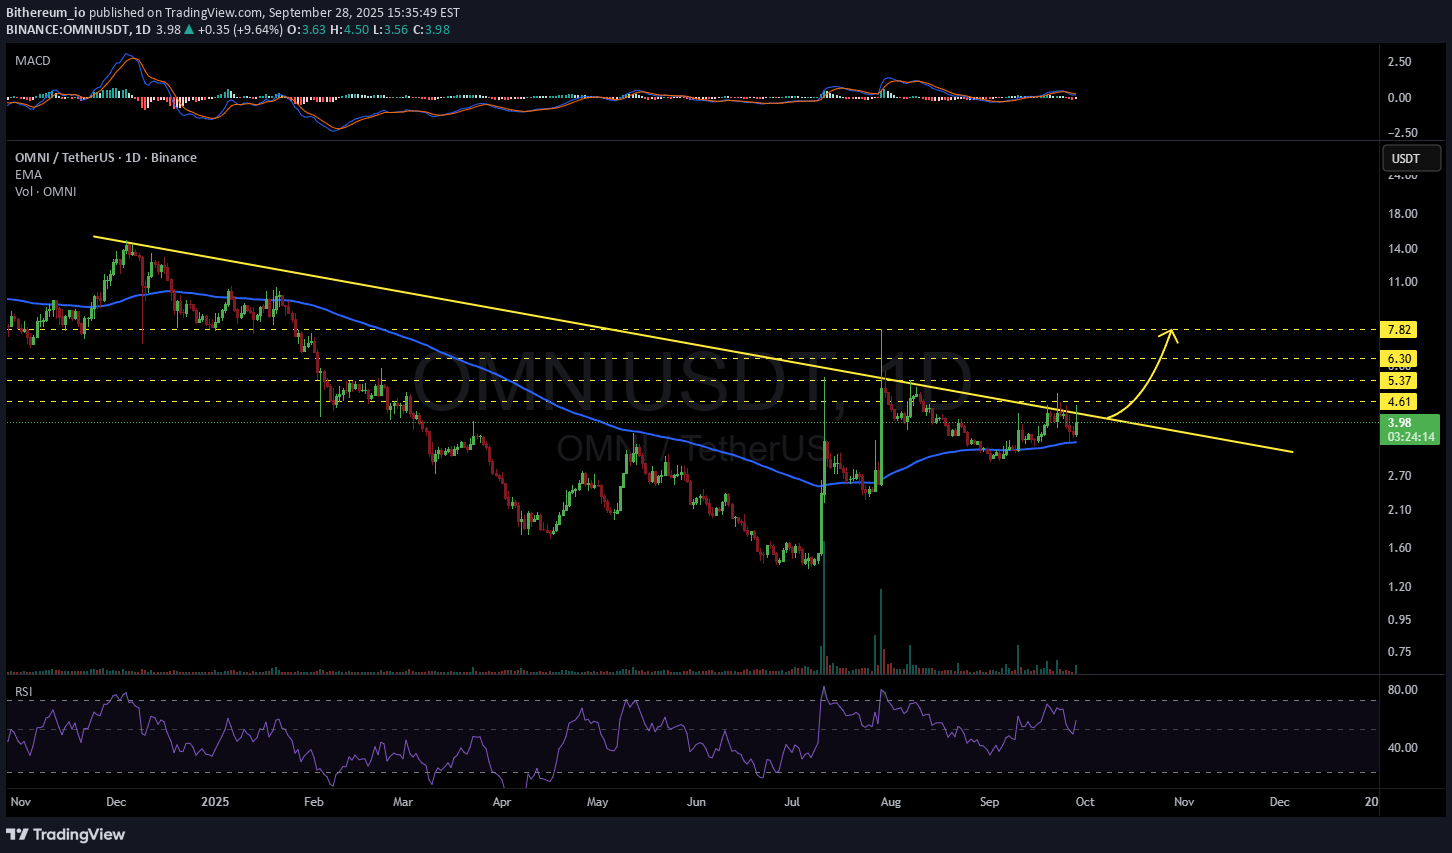
#OMNI یضغط على خط التنازلی طویل الأجل على الرسم البیانی الیومی. فی حالة حدوث اندلاع فوقه ، فإن الأهداف المحتملة هی: 🎯 $ 4.61 🎯 $ 5.37 🎯 $ 6.30 🎯 $ 7.82 ⚠ تذکر دائمًا استخدام الخسارة الضیقة واتبع إدارة المخاطر المناسبة.

Alpha-GoldFX
OMNIUSDT Forming Bullish Wave
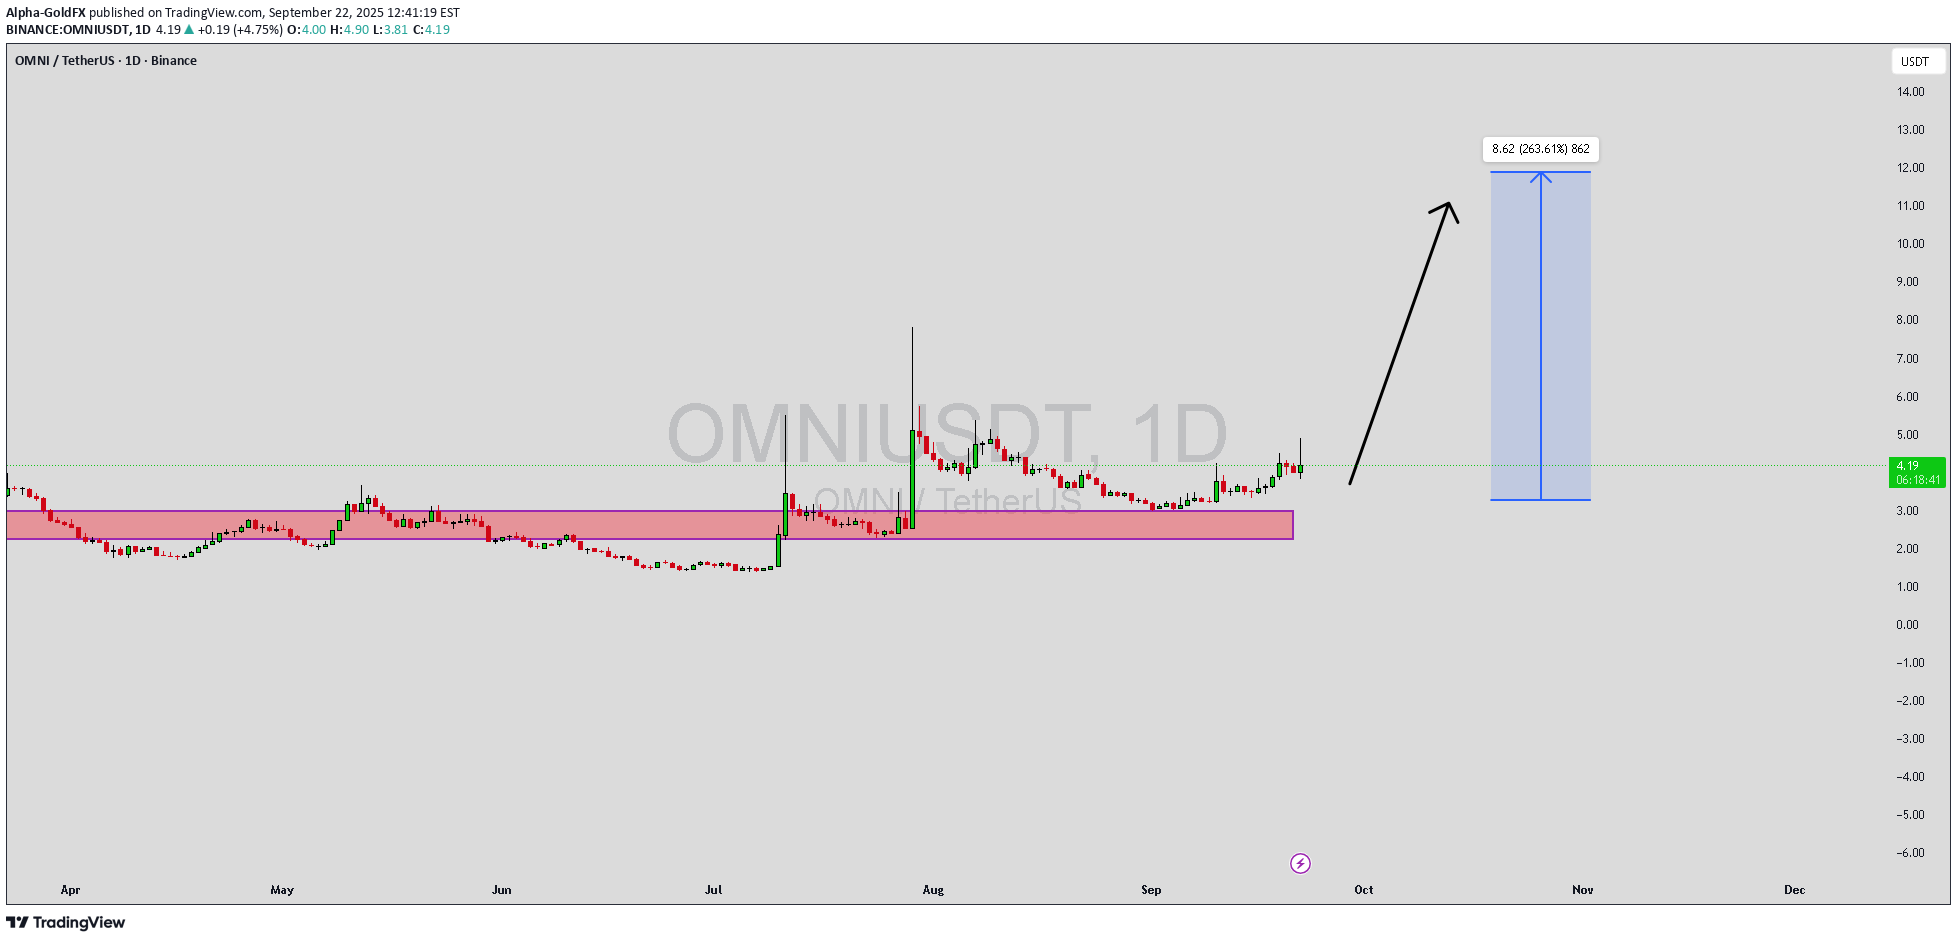
یقوم Omniusdt حالیًا بتکوین نمط موجة صعودیة ، والذی یُنظر إلیه غالبًا على أنه إعداد تقنی قوی لإمکانات الاتجاه الصعودی الکبیر. یعکس هذا النوع من النمط عادة مراحل التراکم تلیها حرکات تصاعدیة متدفقة ، مما یشیر إلى مشارکة قویة من المشترین. من خلال هیکل المخطط الحالی ، یُظهر Omniusdt بناءًا واضحًا للزخم ، وتشیر التوقعات إلى أنه یمکن أن یحقق ربحًا مثیرًا للإعجاب من 190 ٪ إلى 200 ٪+ إذا استمر الاختراق. یظل حجم التداول صلبًا ، مما یعزز القضیة الصعودیة. یعد الحجم الصحی خلال نمط الموجة أمرًا بالغ الأهمیة لأنه یقوم بالتحقق من صحة السعر ویظهر أن المشارکین فی السوق یضعون أنفسهم بنشاط فی الکبیر move التالی. طالما أن الحجم یبقى متسقًا ، فإن Omniusdt لدیه الأساس لتوسیع نطاق تجمعه وجذب المزید من ثقة المستثمرین. کانت معنویات السوق متفائلة بشکل متزاید ، حیث أظهر المزید من المتداولین والمستثمرین اهتمامًا بهذا المشروع. غالبًا ما تدعو أنماط الموجة الصعودیة کل من التجار على المدى القصیر والمستثمرین على المدى الطویل للاستفادة من تقلبات الأسعار الکبیرة. مع توافق الزخم التقنی مع انتباه المستثمر المتزاید ، یمکن أن تصبح Omniusdt واحدة من أکثر الفرص إثارة فی السوق الآن. ✅ إظهار دعمک عن طریق الضغط على زر مثل و ✅ ترک تعلیق أدناه! (ما رأیک فی هذه العملة) ملاحظاتک ومشارکتک تبقینی مصدر إلهام لتبادل المزید من تحلیل السوق معک!

Captain-MAO
OMNI/USDT - Bottom Formation & Reversal
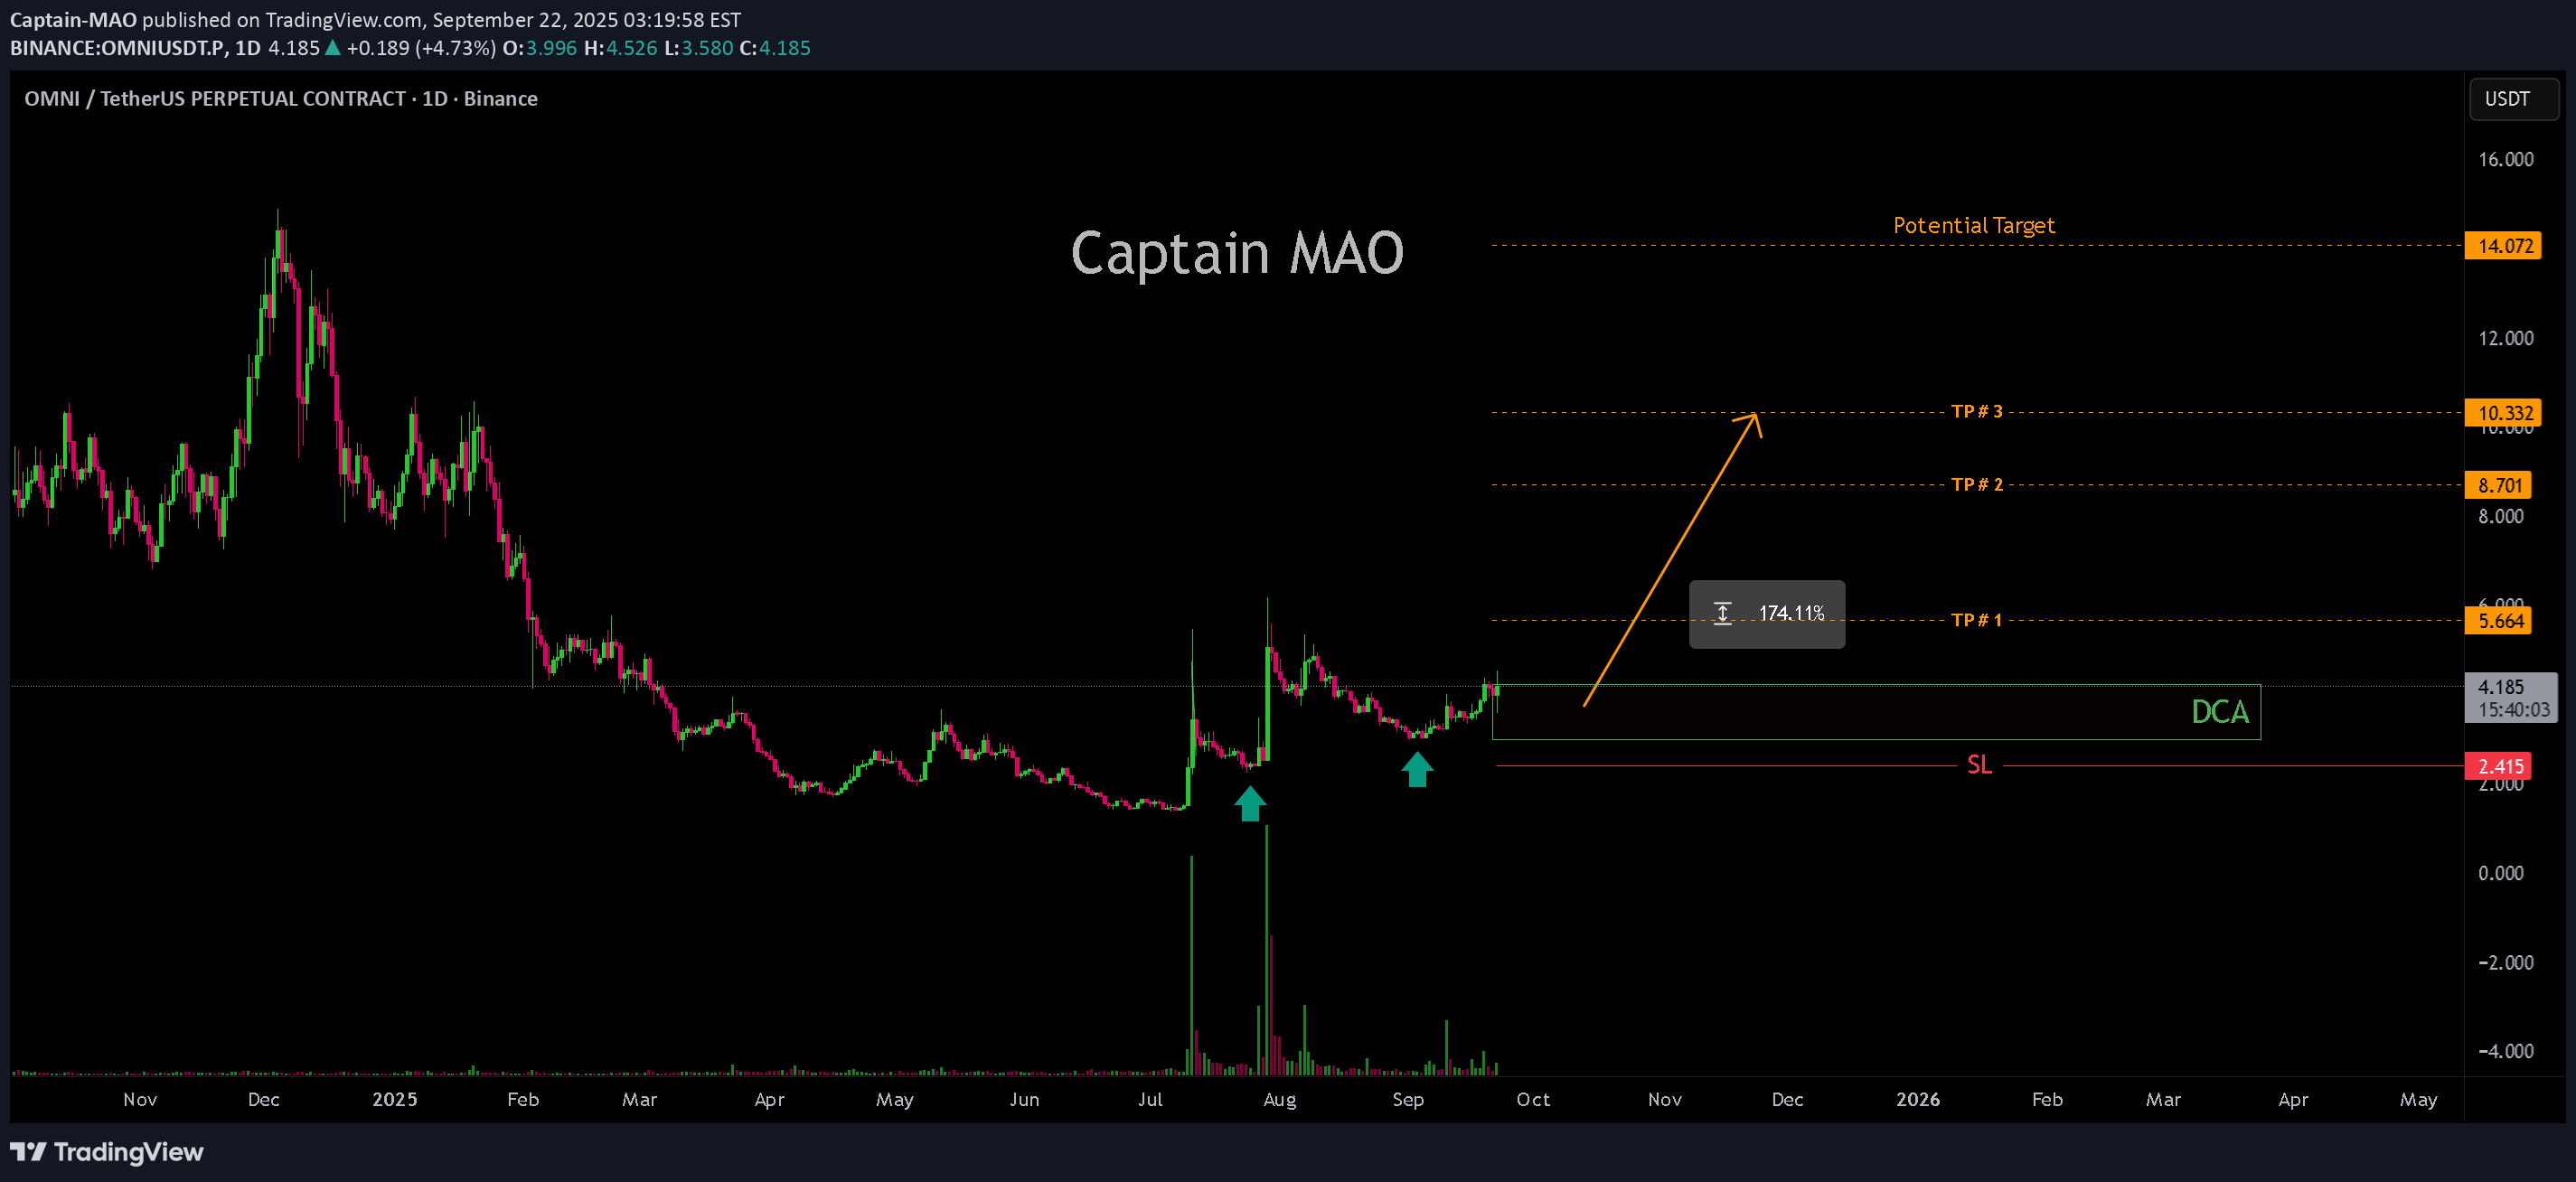
على مدار الشهرین الماضیین ، قام Omni/USDT ببناء وتشکیل بنیة صلبة ، مع إجراء سعر حدیث تظهر علامات التراکم. تشیر سلسلة من الدفعات العدوانیة من الحیتان إلى أن الجزء السفلی محتمل ، وقد یقترب الاتجاه الهادم المطول.

unichartz
OMNI: On the Brink of a Breakout
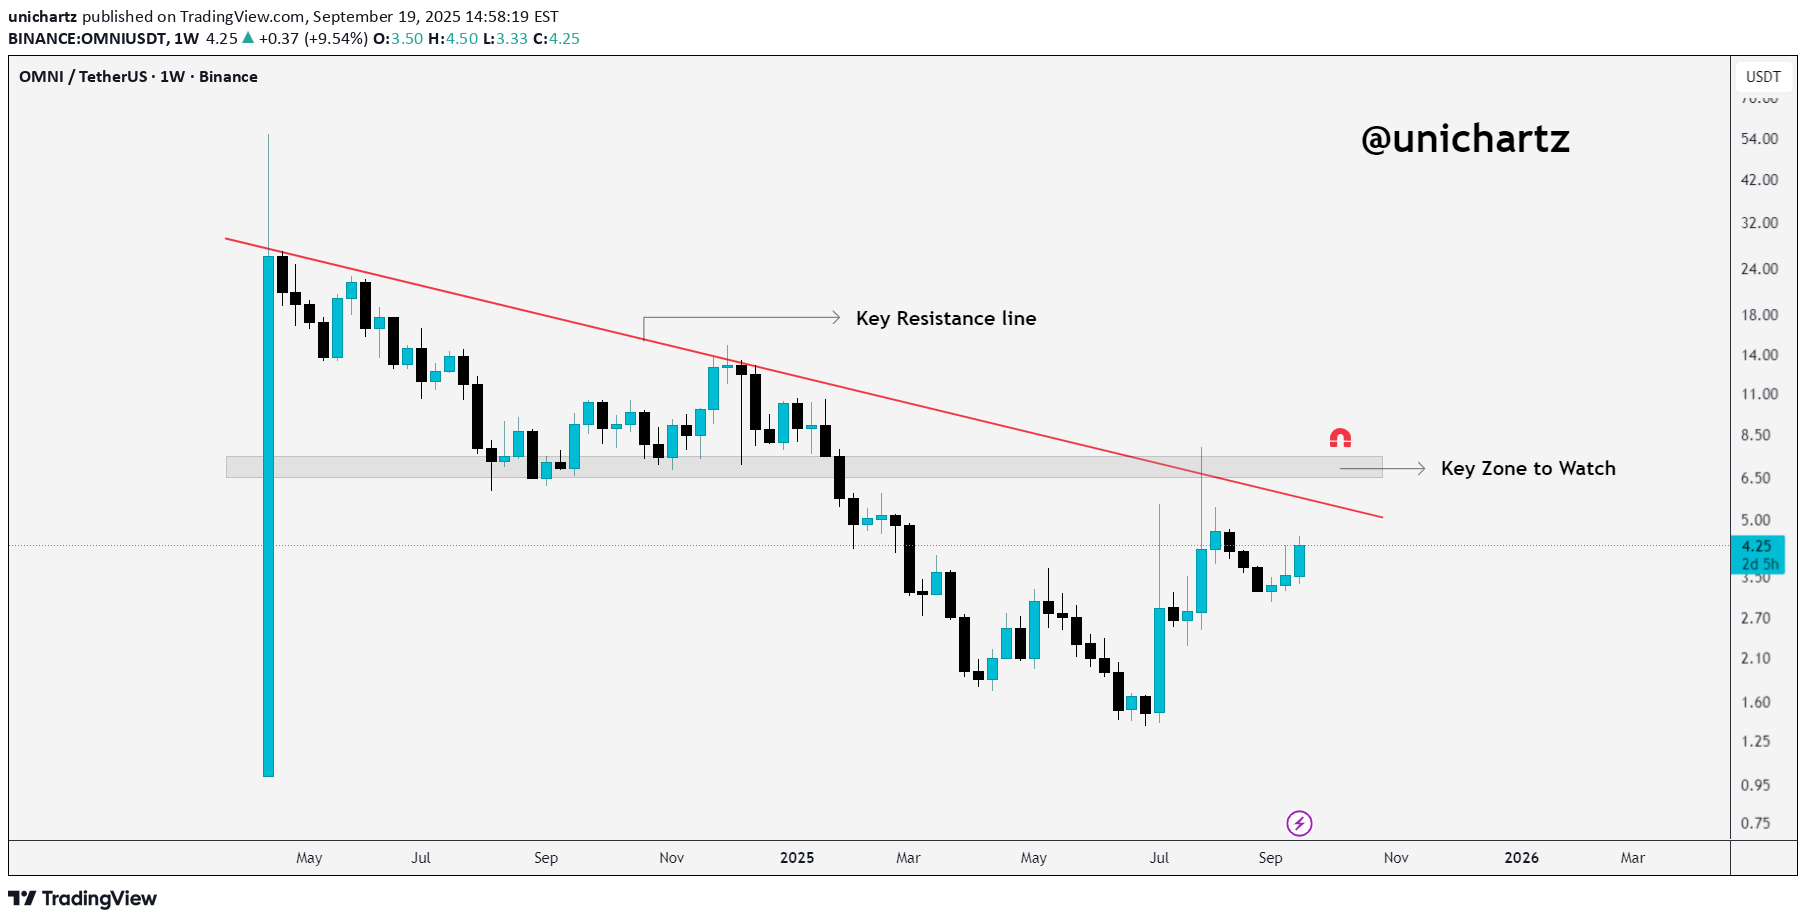
س Omni/USDT لا تزال مسافة جیدة من خط المقاومة الرئیسی ، لکنها تقترب من منطقة مهمة حوالی 4.25 دولار. إذا کان السعر یمکن أن یخترق هذا المستوى واحتفظ به ، فیمکننا رؤیة المزید من الصعود movement. ومع ذلک ، إذا کان یکافح فی هذا المستوى ، فقد یتبع التراجع أو التوحید. راقب کیف تتفاعل مع اقترابها من تلک المقاومة. دایور ، NFA #سلام
Alpha-GoldFX
OMNIUSDT Forming Bullish Wave
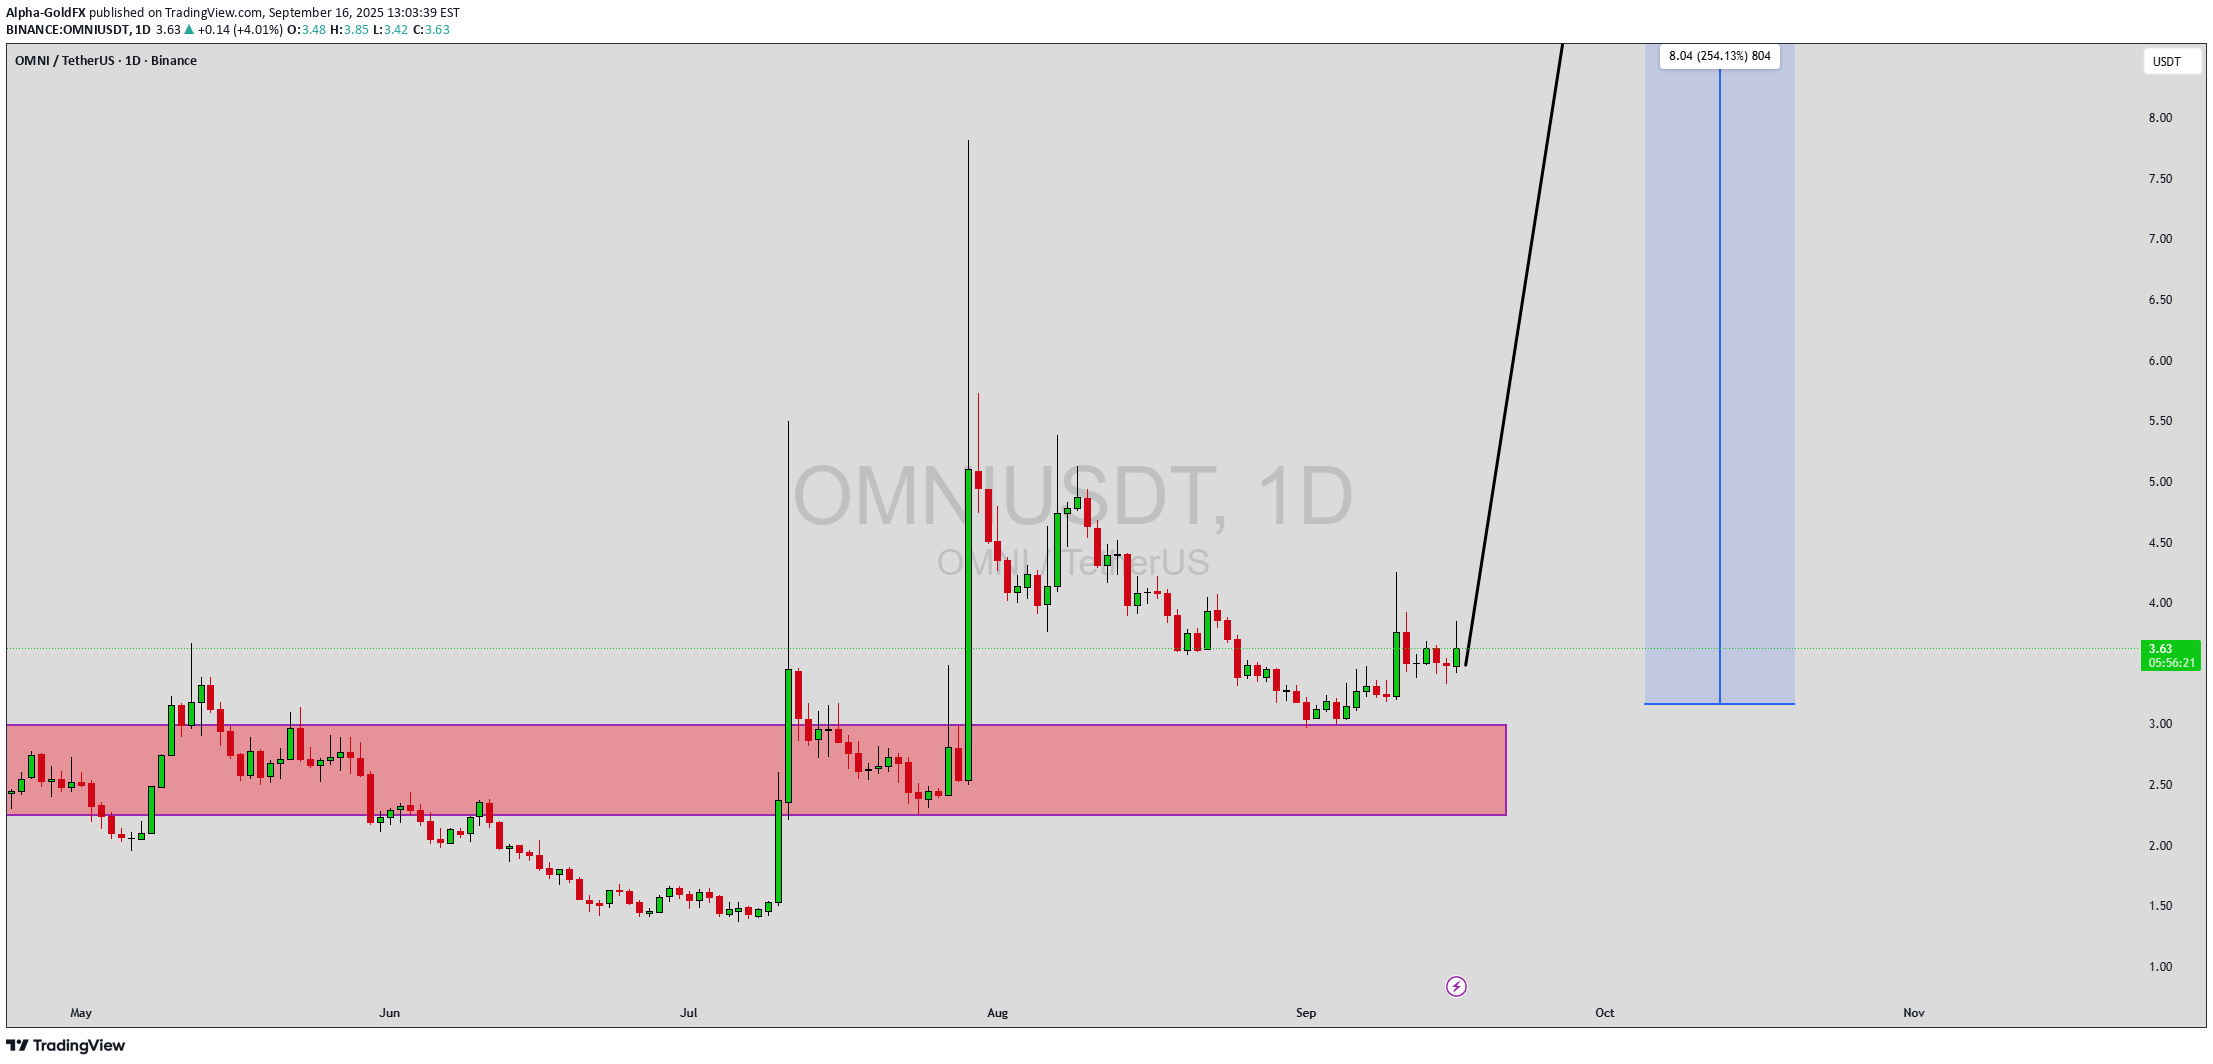
شکلت Omniusdt نمط الموجة الصعودیة التی تشیر إلى بناء زخم قوی فی السوق. بعد فترة من التوحید ، یظهر السعر الآن علامات على الانتعاش مع زیادة حجمها ، مما یشیر إلى أن المشترین یعودون إلى الثقة. یشیر هذا الإعداد الفنی إلى احتمال حشد major الصعودی ، مع توقعات بنسبة 140 ٪ إلى 150 ٪+ إذا استمر الزخم فی تعزیز الثیران. غالبًا ما یکون نمط الموجة الصعودیة مقدمة لإجراءات أسعار تصاعدیة کبیرة ، لأنه یعکس تراکمًا قویًا ومستثمرًا متجددًا optimism. مع تداول Omniusdt على مستویات مواتیة ، یشیر بنیة المخطط الحالیة إلى أن الموجة التالیة یمکن أن تدفع السعر نحو مناطق المقاومة الأعلى. من المحتمل أن تجذب مثل هذا الانهیار المزید من الاهتمام من التجار ، مما یؤدی إلى تزوید الطلب الإضافی وتوسیع نطاق التجمع. اهتمام المستثمر فی Omniusdt فی ارتفاع ، والزیادة المطردة فی نشاط التداول تعزز النظرة الإیجابیة. إذا ظلت معنویات السوق متوافقة مع الإشارات الفنیة ، فقد یتفوق Omniusdt على العدید من Altcoins الأخرى على المدى القریب ، مما یجعلها خیارًا جذابًا للتجار الذین یبحثون عن مکاسب عالیة فی المائة. مزیج من دعم الحجم ، هیکل الموجة ، ومشارکة المستثمر المتجدد یجعل هذا الإعداد واحد لمشاهدة عن کثب. ✅ إظهار دعمک عن طریق الضغط على زر مثل و ✅ ترک تعلیق أدناه! (ما رأیک فی هذه العملة) ملاحظاتک ومشارکتک تبقینی مصدر إلهام لتبادل المزید من تحلیل السوق معک!

CryptoWithJames
OMNIUSDT UPDATE
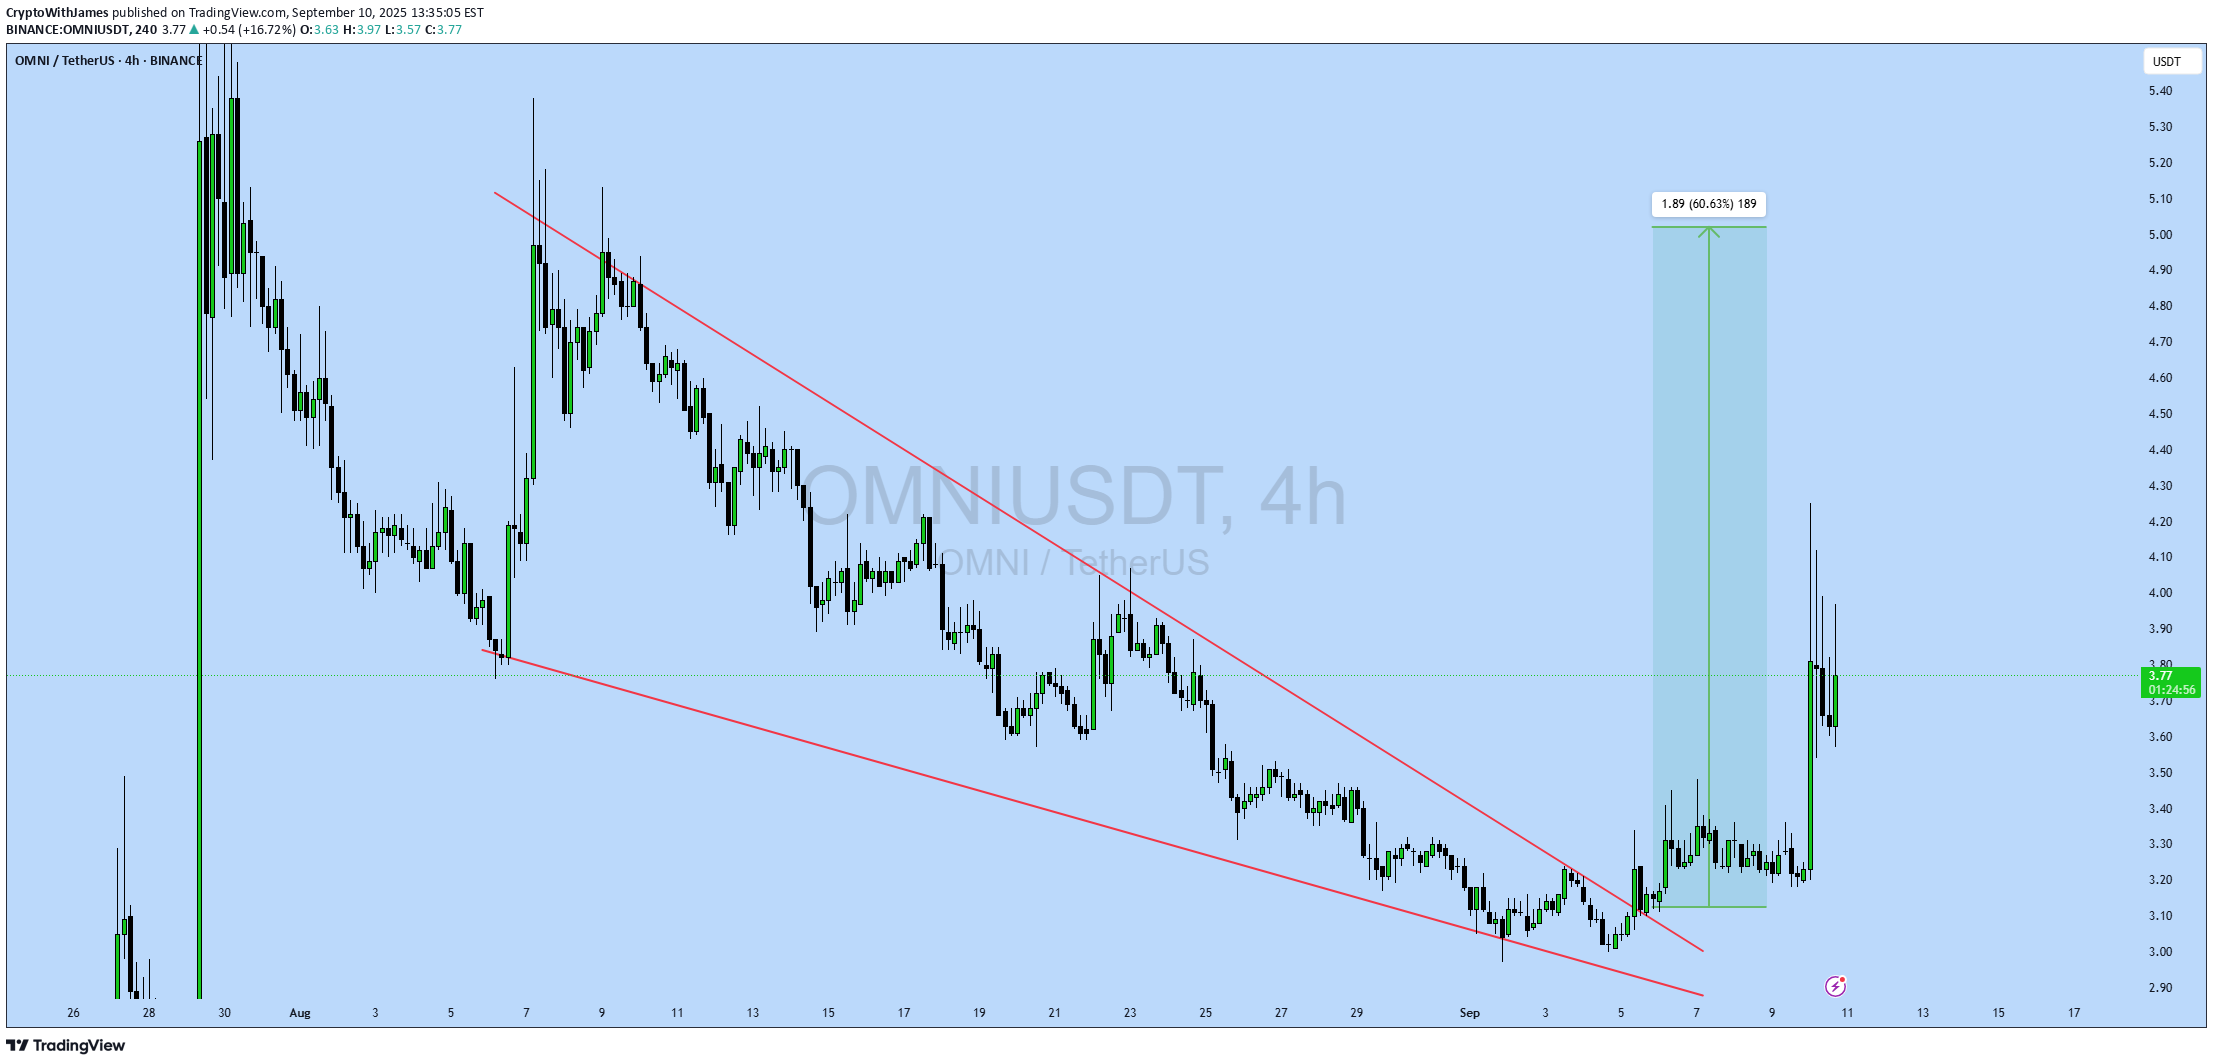
#OMNI تحدیث OMNI الإعداد الفنی النمط: نمط إسفین السقوط الصعودی السعر الحالی: 3.17 دولار السعر المستهدف: 5.06 دولار ربح ٪ الهدف: 60.63 ٪ التحلیل الفنی: OMNI ینفجر من إسفین السقوط على الرسم البیانی 4H ، مما یؤکد إعداد الانعکاس الصعودی. زیادة الزخم بالقرب من الدعم وتأکید الاختراق یشیر إلى استمرار رأسا على عقب نحو 5.06 دولار. الإطار الزمنی: 4H نصیحة إدارة المخاطر: استخدم دائمًا إدارة المخاطر المناسبة.
Alpha-GoldFX
OMNIUSDT Forming Bullish Wave
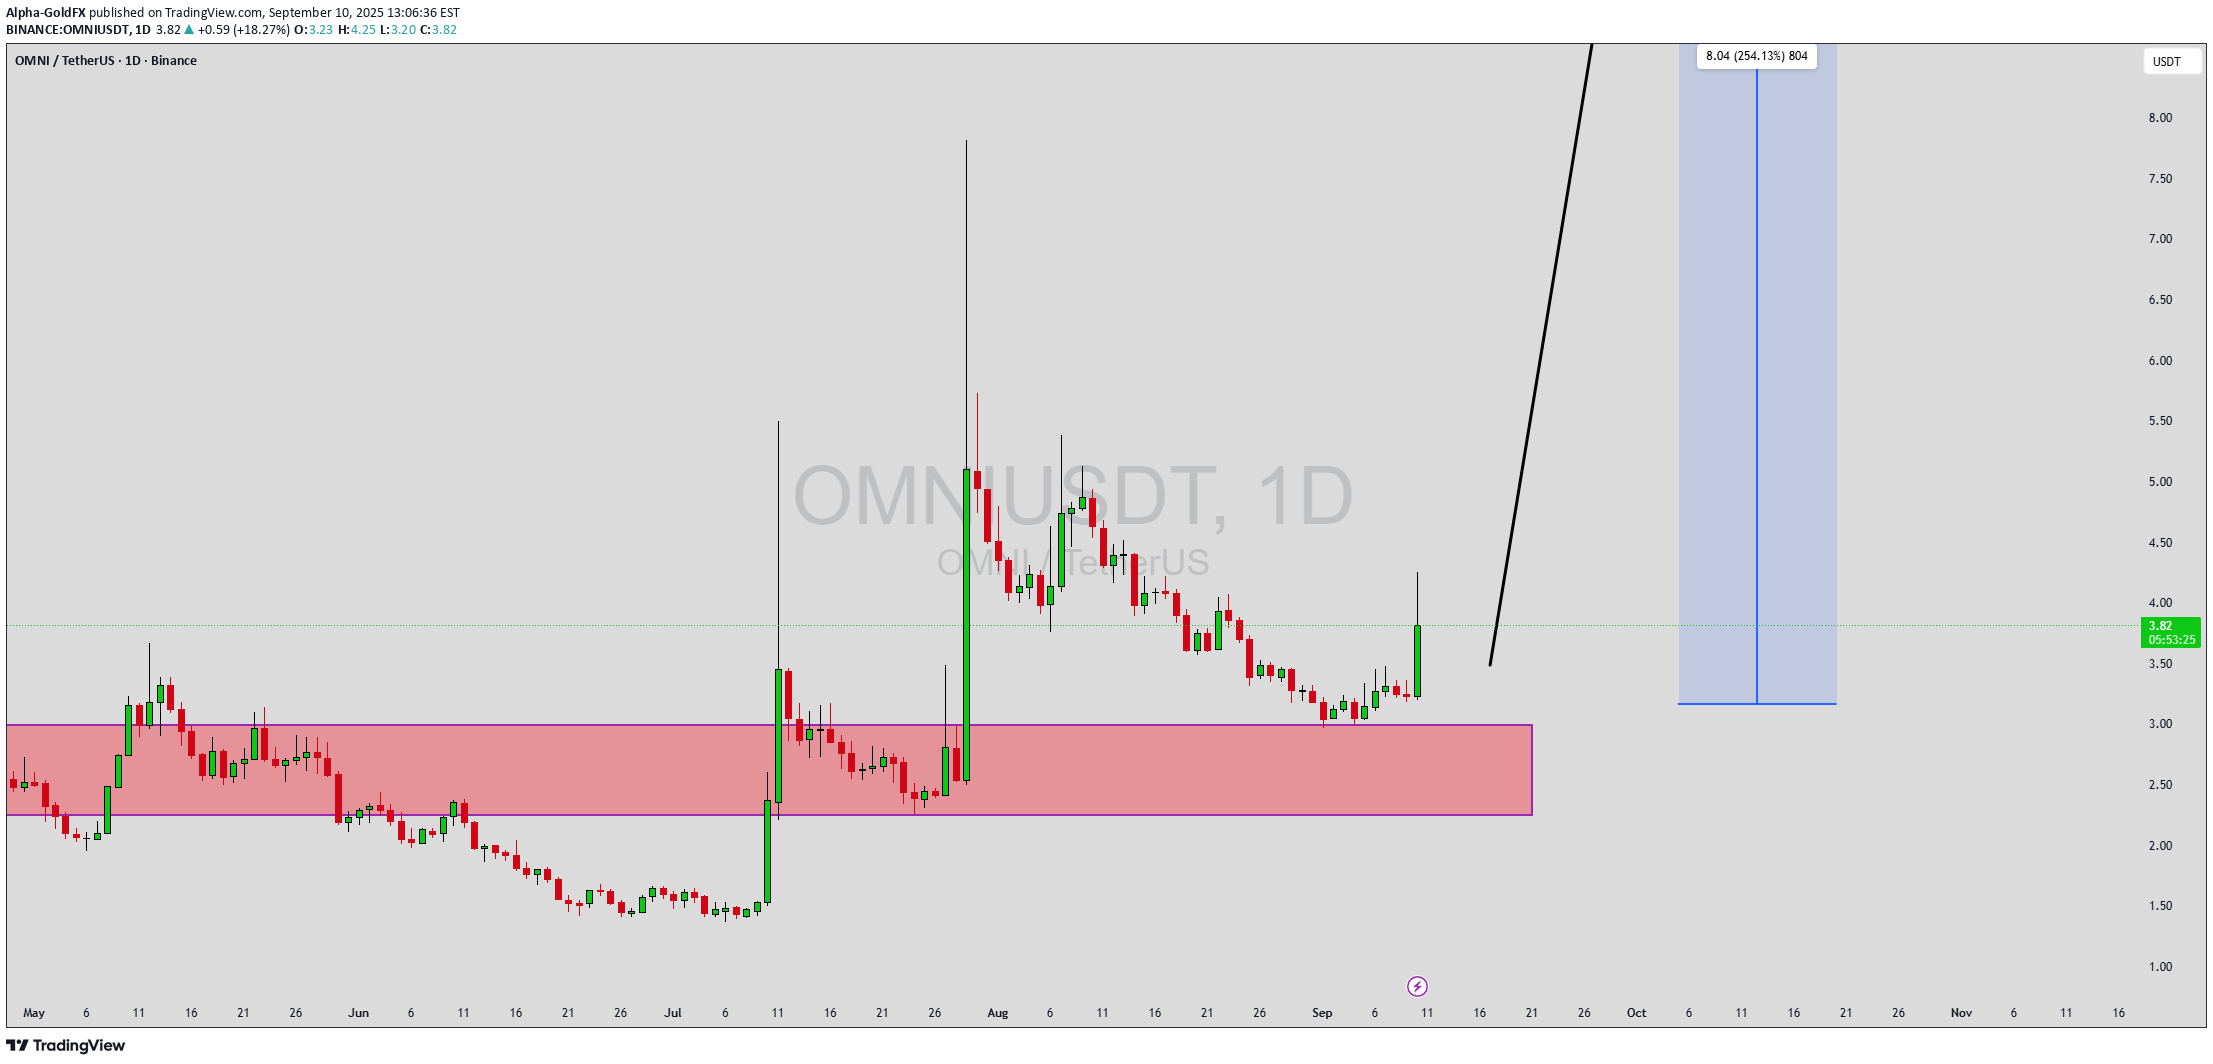
شکلت Omniusdt نمط الموجة الصعودیة التی تشیر إلى بناء زخم قوی فی السوق. بعد فترة من التوحید ، یظهر السعر الآن علامات على الانتعاش مع زیادة حجمها ، مما یشیر إلى أن المشترین یعودون إلى الثقة. یشیر هذا الإعداد الفنی إلى احتمال حشد major الصعودی ، مع توقعات بنسبة 140 ٪ إلى 150 ٪+ إذا استمر الزخم فی تعزیز الثیران. غالبًا ما یکون نمط الموجة الصعودیة مقدمة لإجراءات أسعار تصاعدیة کبیرة ، لأنه یعکس تراکمًا قویًا ومستثمرًا متجددًا optimism. مع تداول Omniusdt على مستویات مواتیة ، یشیر بنیة المخطط الحالیة إلى أن الموجة التالیة یمکن أن تدفع السعر نحو مناطق المقاومة الأعلى. من المحتمل أن تجذب مثل هذا الانهیار المزید من الاهتمام من التجار ، مما یؤدی إلى تزوید الطلب الإضافی وتوسیع نطاق التجمع. اهتمام المستثمر فی Omniusdt فی ارتفاع ، والزیادة المطردة فی نشاط التداول تعزز النظرة الإیجابیة. إذا ظلت معنویات السوق متوافقة مع الإشارات الفنیة ، فقد یتفوق Omniusdt على العدید من Altcoins الأخرى على المدى القریب ، مما یجعلها خیارًا جذابًا للتجار الذین یبحثون عن مکاسب عالیة فی المائة. مزیج من دعم الحجم ، هیکل الموجة ، ومشارکة المستثمر المتجدد یجعل هذا الإعداد واحد لمشاهدة عن کثب. ✅ إظهار دعمک عن طریق الضغط على زر مثل و ✅ ترک تعلیق أدناه! (ما رأیک فی هذه العملة) ملاحظاتک ومشارکتک تبقینی مصدر إلهام لتبادل المزید من تحلیل السوق معک!
Alpha-GoldFX
OMNIUSDT Forming Bullish Wave
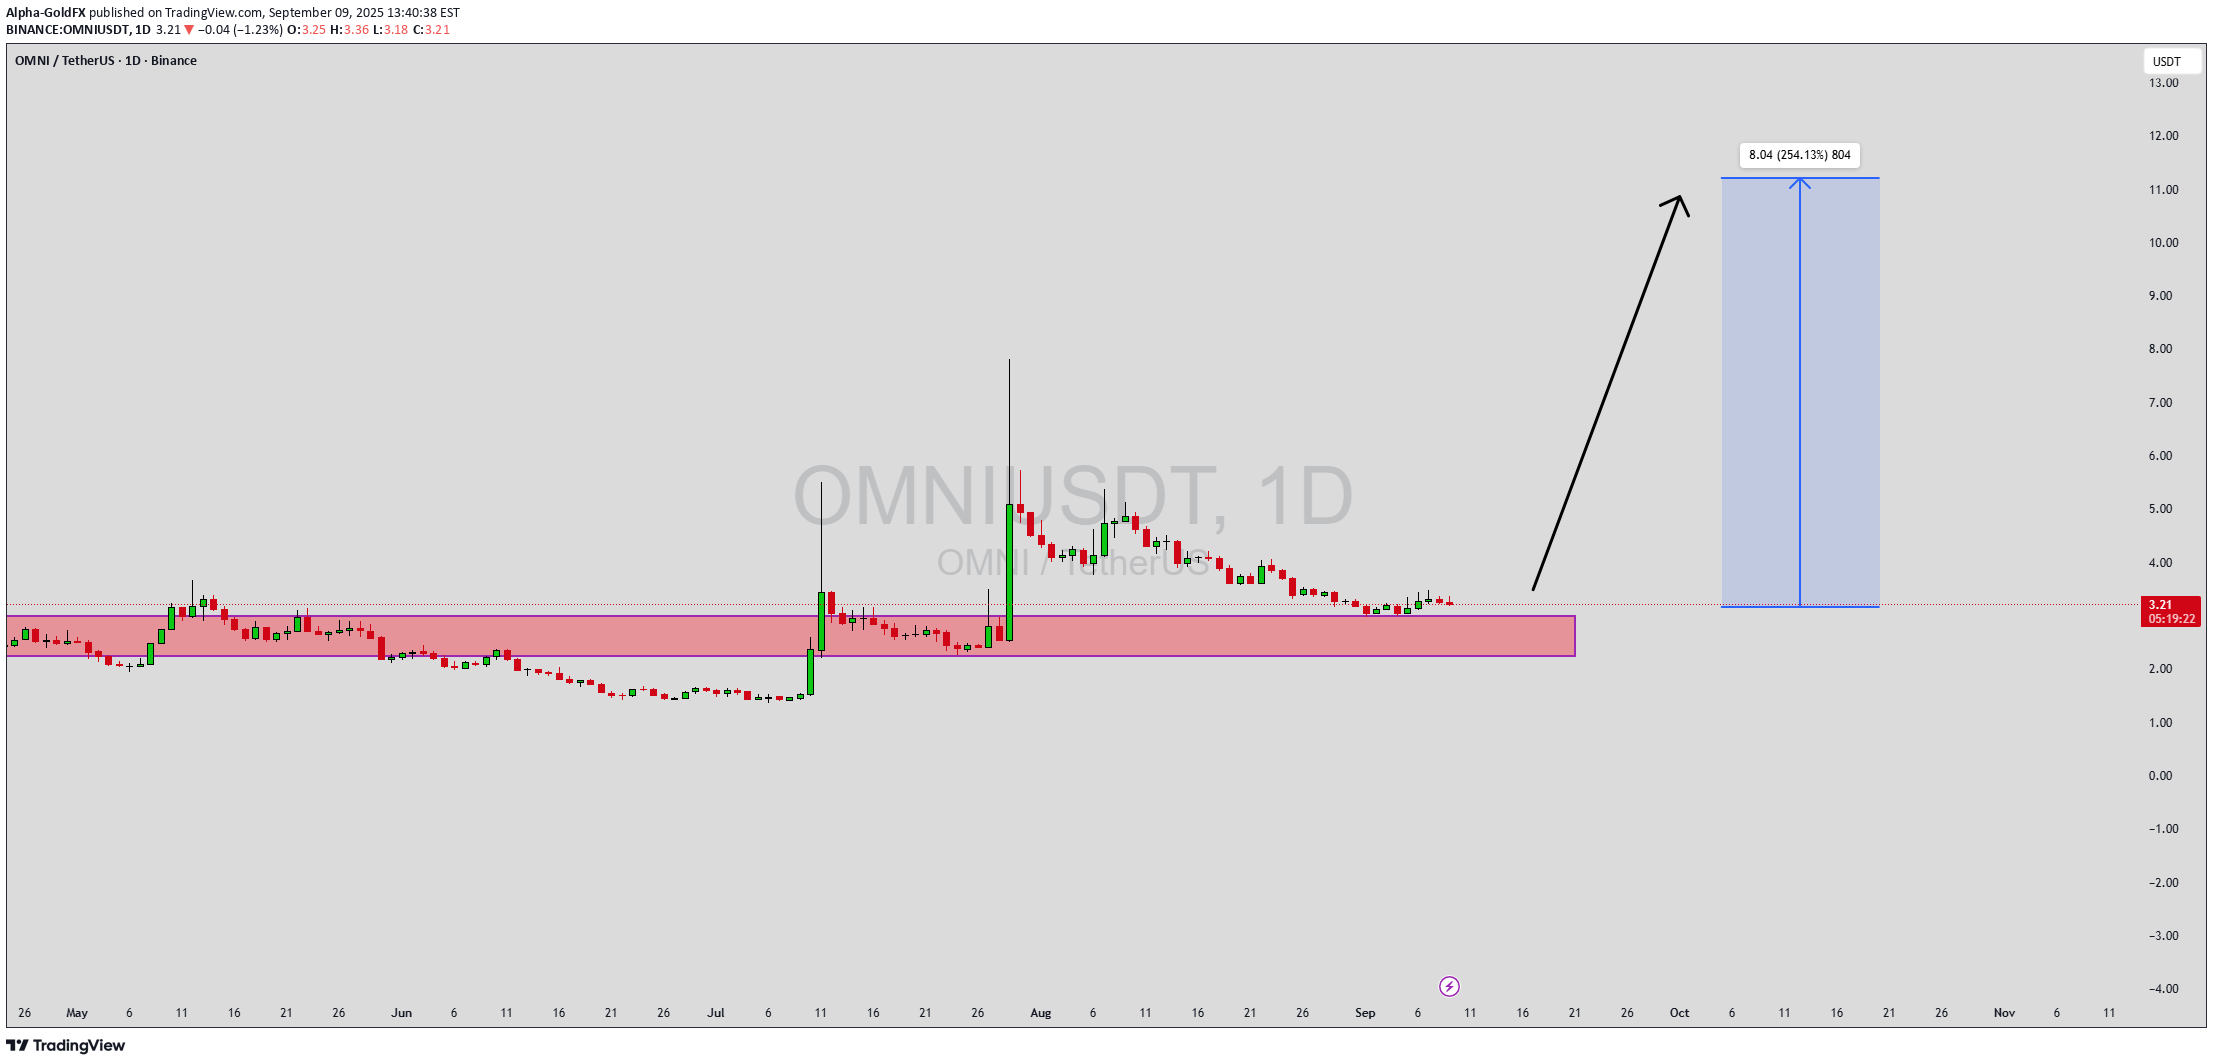
شکلت Omniusdt نمط الموجة الصعودیة التی تشیر إلى بناء زخم قوی فی السوق. بعد فترة من التوحید ، یظهر السعر الآن علامات على الانتعاش مع زیادة حجمها ، مما یشیر إلى أن المشترین یعودون إلى الثقة. یشیر هذا الإعداد الفنی إلى احتمال حشد major الصعودی ، مع توقعات بنسبة 140 ٪ إلى 150 ٪+ إذا استمر الزخم فی تعزیز الثیران. غالبًا ما یکون نمط الموجة الصعودیة مقدمة لإجراءات أسعار تصاعدیة کبیرة ، لأنه یعکس تراکمًا قویًا ومستثمرًا متجددًا optimism. مع تداول Omniusdt على مستویات مواتیة ، یشیر بنیة المخطط الحالیة إلى أن الموجة التالیة یمکن أن تدفع السعر نحو مناطق المقاومة الأعلى. من المحتمل أن تجذب مثل هذا الانهیار المزید من الاهتمام من التجار ، مما یؤدی إلى تزوید الطلب الإضافی وتوسیع نطاق التجمع. اهتمام المستثمر فی Omniusdt فی ارتفاع ، والزیادة المطردة فی نشاط التداول تعزز النظرة الإیجابیة. إذا ظلت معنویات السوق متوافقة مع الإشارات الفنیة ، فقد یتفوق Omniusdt على العدید من Altcoins الأخرى على المدى القریب ، مما یجعلها خیارًا جذابًا للتجار الذین یبحثون عن مکاسب عالیة فی المائة. مزیج من دعم الحجم ، هیکل الموجة ، ومشارکة المستثمر المتجدد یجعل هذا الإعداد واحد لمشاهدة عن کثب. ✅ إظهار دعمک عن طریق الضغط على زر مثل و ✅ ترک تعلیق أدناه! (ما رأیک فی هذه العملة) ملاحظاتک ومشارکتک تبقینی مصدر إلهام لتبادل المزید من تحلیل السوق معک!

MrHans08
OMNI ready to take off?!
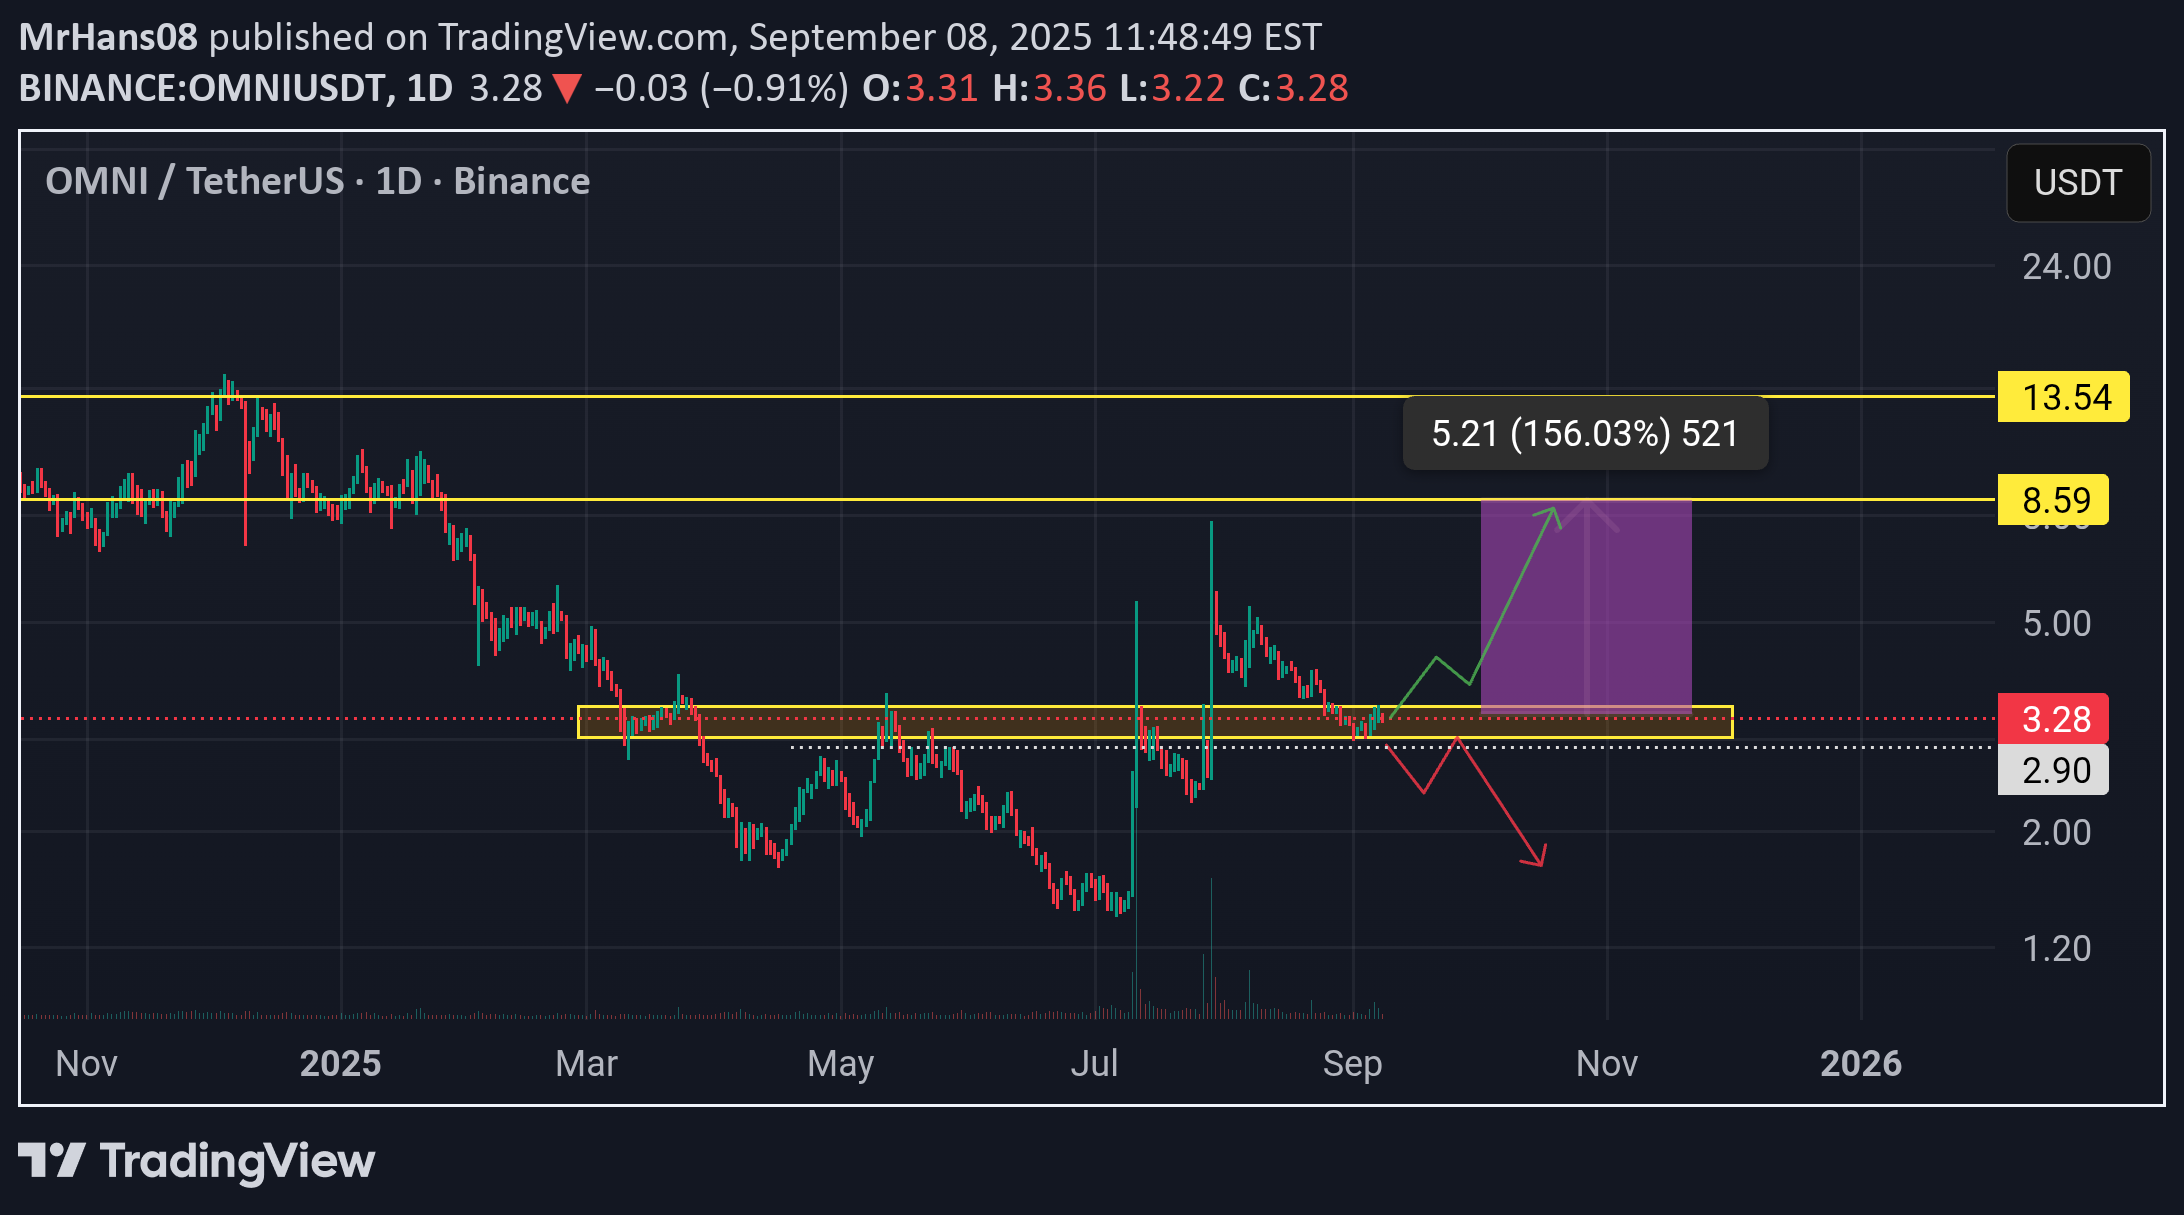
🔥 OMNI تبدو جاهزة للإقلاع! یجلس حالیًا على منطقة دعم قویة-دخول مثالی مع إعداد مثالی للمخاطر إلى المکافلة. 🚀 🎯 الهدف الصعودی: المقاومة التالیة حوالی 8.59 دولار ، تقدم ربحًا محتملاً بنسبة 156 ٪. ❌ یصبح الإعداد غیر صالح إذا انکسر السعر إلى ما دون الدعم الأصفر أو 2.90 دولار-استخدمه کمرجع لخسارة التوقف. حظا سعیدا والتجارة safe! 📈✨

bakbak88
omni forming triangle, another rocket & short squeeze counter
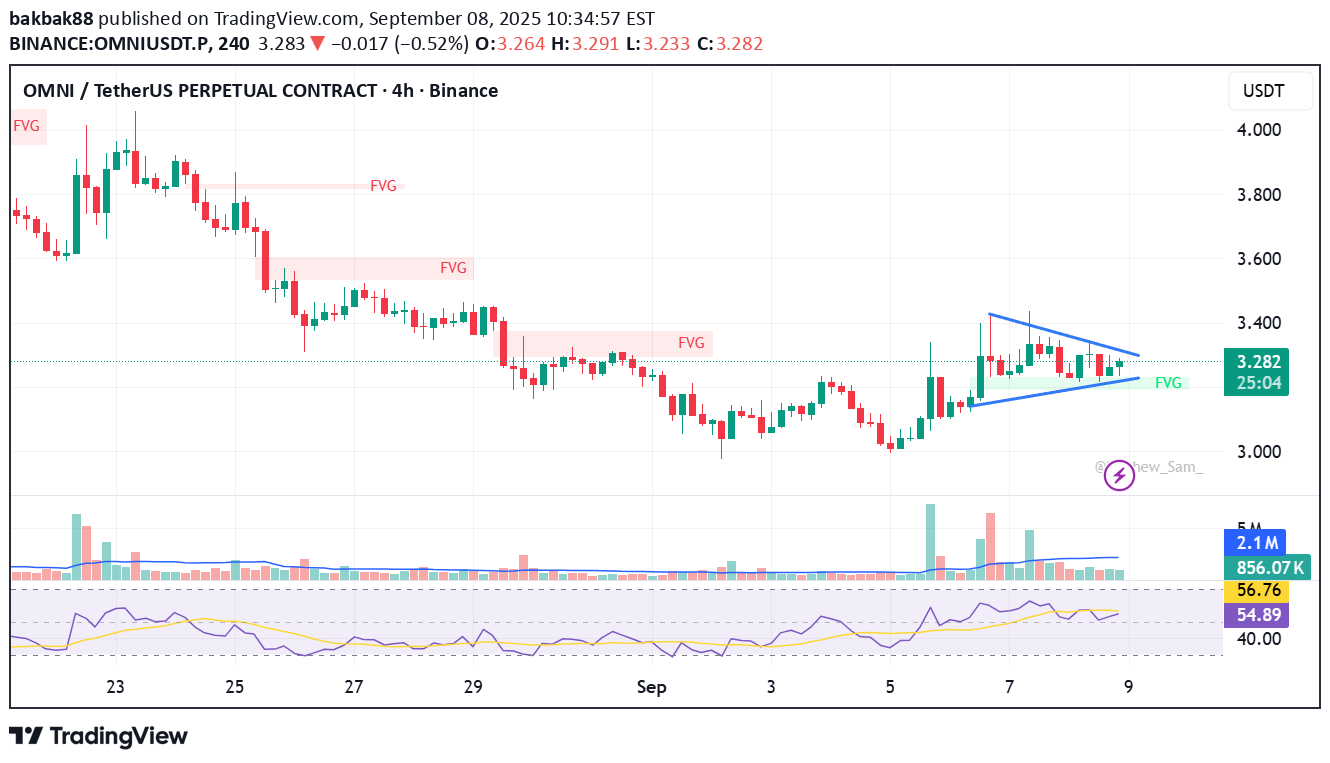
omni یشکل مثلث متماثل فی 4HR TF. تبدو جیدة فی شحن السلطة بناءً على TF الیومیة ، هذا هو بونکر المحتمل. التقاء مع معدل الصندوق السلبی ، دلتا الإیجابیة ، الأمراض القلبیة الوعائیة السلبیة وزیادة OI ، وهذا هو المرشح المحتمل للضغط القصیر. الساعة 12 صباحًا قریبًا ، وسوف یسجل السوق سعر الصنادیق. احترس ومراقبتها عن کثب. یمکن وضع SL عند 3.156
إخلاء المسؤولية
أي محتوى ومواد مدرجة في موقع Sahmeto وقنوات الاتصال الرسمية هي عبارة عن تجميع للآراء والتحليلات الشخصية وغير ملزمة. لا تشكل أي توصية للشراء أو البيع أو الدخول أو الخروج من سوق الأوراق المالية وسوق العملات المشفرة. كما أن جميع الأخبار والتحليلات المدرجة في الموقع والقنوات هي مجرد معلومات منشورة من مصادر رسمية وغير رسمية محلية وأجنبية، ومن الواضح أن مستخدمي المحتوى المذكور مسؤولون عن متابعة وضمان أصالة ودقة المواد. لذلك، مع إخلاء المسؤولية، يُعلن أن المسؤولية عن أي اتخاذ قرار وإجراء وأي ربح وخسارة محتملة في سوق رأس المال وسوق العملات المشفرة تقع على عاتق المتداول.