16.07.2025 tarihinde sembol BTC hakkında Teknik readCrypto analizi

readCrypto
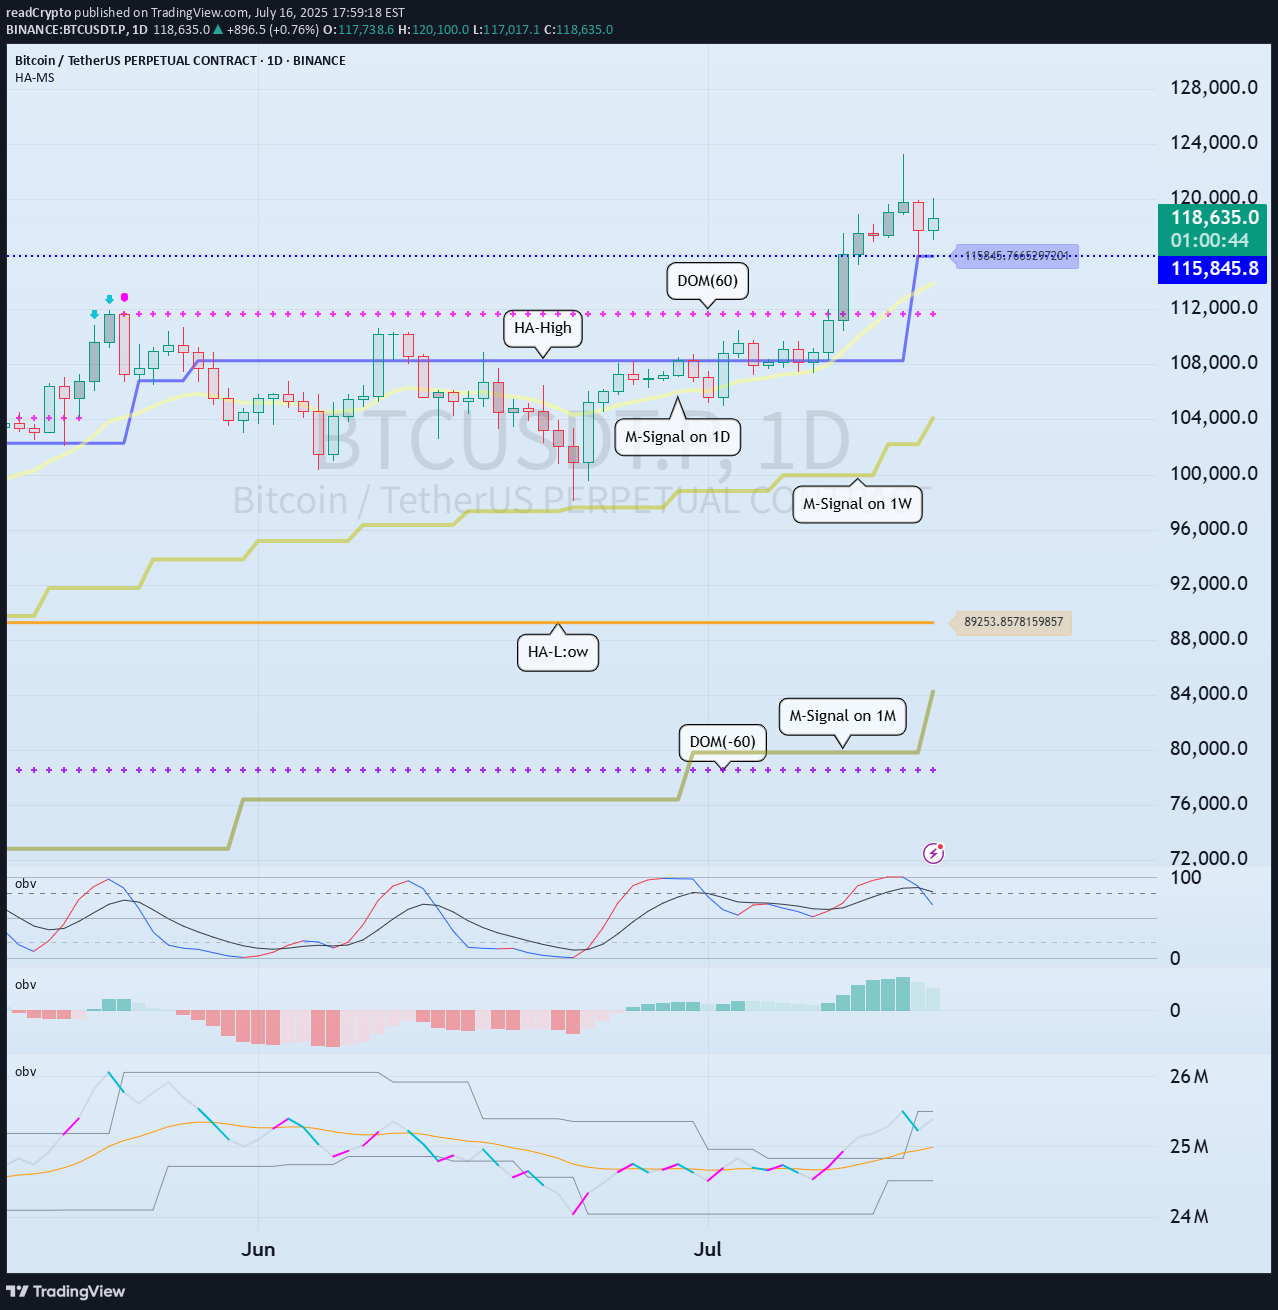
Hello, traders. If you "Follow", you can always get new information quickly. Have a nice day today. ------------------------------------- 1D chart is the standard chart for all time frame charts. In other words, if you trade according to the trend of the 1D chart, you can make profits while minimizing losses. This can also be seen from the fact that most indicators are created based on the 1D chart. In that sense, the M-Signal indicators of the 1M, 1W, and 1D charts are suitable indicators for confirming trends. If the price is maintained above the M-Signal indicator of the 1M chart, it is highly likely that the upward trend will continue in the medium to long term, so it is recommended to take note of this advantage especially when trading spot. The M-Signal indicator on the 1W, 1D chart shows the medium-term and short-term trends. The M-Signal indicator uses the MACD indicator formula, but it can be seen as a price moving average. You can trade with just the price moving average, but it is difficult to select support and resistance points, and it is not very useful in actual trading because it cannot cope with volatility. However, it is a useful indicator when analyzing charts or checking general trends. Therefore, what we can know with the M-Signal indicator (price moving average) is the interrelationship between the M-Signal indicators. You can predict the trend by checking how far apart and close the M-Signal indicators are, and then checking the direction. - If you have confirmed the trend with the M-Signal indicator, you need support and resistance points for actual trading. Support and resistance points should be drawn on the 1M, 1W, and 1D charts. The order of the roles of support and resistance points is 1M > 1W > 1D charts. However, the strength of the role of support and resistance points can be seen depending on how long the horizontal line is. Usually, in order to perform the role of support and resistance points, at least 3 candles or more form a horizontal line. Therefore, caution is required when trading when the number of candles is less than 3. The indicators created considering this point are the HA-Low and HA-High indicators. The HA-Low and HA-High indicators are indicators created for trading on the Heikin-Ashi chart and indicate when the Heikin-Ashi candle turns upward or downward. Therefore, the creation of the HA-Low indicator means that there is a high possibility of an upward turn. In other words, if it is supported by the HA-Low indicator, it is a time to buy. However, if it falls from the HA-Low indicator, there is a possibility of a stepwise decline, so you should also consider a countermeasure for this. The fact that the HA-High indicator was created means that there is a high possibility of a downward turn. In other words, if there is resistance from the HA-High indicator, it is a time to sell. However, if it rises from the HA-High indicator, there is a possibility of a stepwise upward turn, so you should also consider a countermeasure for this. This is where a dilemma arises. What I mean is that the fact that the HA-High indicator was created means that there is a high possibility of a downward turn, so you know that there is a high possibility of a downward turn, but if it receives support and rises, you think that you can make a large profit through a stepwise upward turn, so you fall into a dilemma. This is caused by greed that arises from falling into FOMO due to price volatility. The actual purchase time should have been when it showed support near the HA-Low indicator, but when it showed a downward turn, it ended up suffering a large loss due to the psychology of wanting to buy, which became the trigger for leaving the investment. Therefore, if you failed to buy at the purchase time, you should also know how to wait until the purchase time comes. - It seems that you can trade depending on whether the HA-Low and HA-High indicators are supported, but the task of checking whether it is supported is quite difficult and tiring. Therefore, to complement the shortcomings of the HA-Low and HA-High indicators, the DOM(60) and DOM(-60) indicators were added. The DOM(-60) indicator indicates the end of the low point. Therefore, if it shows support in the DOM(-60) ~ HA-Low section, it is the purchase time. If it falls below the DOM(-60) indicator, it means that a stepwise downtrend is likely to begin. The DOM(60) indicator indicates the end of the high point. Therefore, if it is supported and rises in the HA-High ~ DOM(60) section, it means that a stepwise uptrend is likely to begin. If it is resisted and falls in the HA-High ~ DOM(60) section, it is likely that a downtrend will begin. With this, the basic trading strategy is complete. This is the basic trading strategy of buying when it rises in the DOM(-60) ~ HA-Low section and selling when it falls in the HA-High ~ DOM(60) section. For this, the trading method must adopt a split trading method. Although not necessarily, if it falls in the DOM(-60) ~ HA-Low section, it will show a sharp decline, and if it rises in the HA-High ~ DOM(60) section, it will show a sharp rise. Due to this volatility, psychological turmoil causes people to start trading based on the price, which increases their distrust in the investment market and eventually leads them to leave the investment market. - When looking at the movement of the 1D chart, it can be seen that it is not possible to proceed with trading at the moment because it is already showing a stepwise upward trend. However, since there is a SHORT position in futures trading, trading is possible at any time. In any case, it is difficult to select a time to buy because the 1D chart shows a stepwise upward trend. However, looking at the time frame chart below the 1D chart can help you select a time to buy. The basic trading strategy is always the same. Buy when it rises in the DOM(-60) ~ HA-Low section and sell when it falls in the HA-High ~ DOM(60) section. Currently, since the 1D chart is continuing a stepwise upward trend, the main position is to eventually proceed with a long position. Therefore, if possible, you should focus on finding the right time to buy. However, if it falls below the HA-High indicator of the 1D chart, the possibility of a downtrend increases, so at that time, you should focus on finding the right time to sell. In other words, since the HA-High indicator of the current 1D chart is generated at the 115845.8 point, you should think of different response methods depending on whether the price is above or below the 115845.8 point. Therefore, when trading futures, increase the investment ratio when trading with the main position (a position that matches the trend of the 1D chart), and decrease the investment ratio when trading with the secondary position (a position that is different from the trend of the 1D chart) and respond quickly and quickly. When trading in the spot market, you have no choice but to trade in the direction of the 1D chart trend, so you should buy and then sell in installments whenever it shows signs of turning downward to secure profits. In other words, buy near the HA-Low indicator on the 30m chart, and if the price rises and the HA-High indicator is created, sell in installments near that area. - You should determine your trading strategy, trading method, and profit realization method by considering these interrelationships, and then trade mechanically accordingly. If you trade only with fragmentary movements, you will likely end up suffering losses. This is because you do not cut your losses. - Thank you for reading to the end. I hope you have a successful trade. --------------------------------------------------
