sembol BTC hakkında analiz Teknik Magister_Arcanvm: İndirim (30.06.2025) önerilir

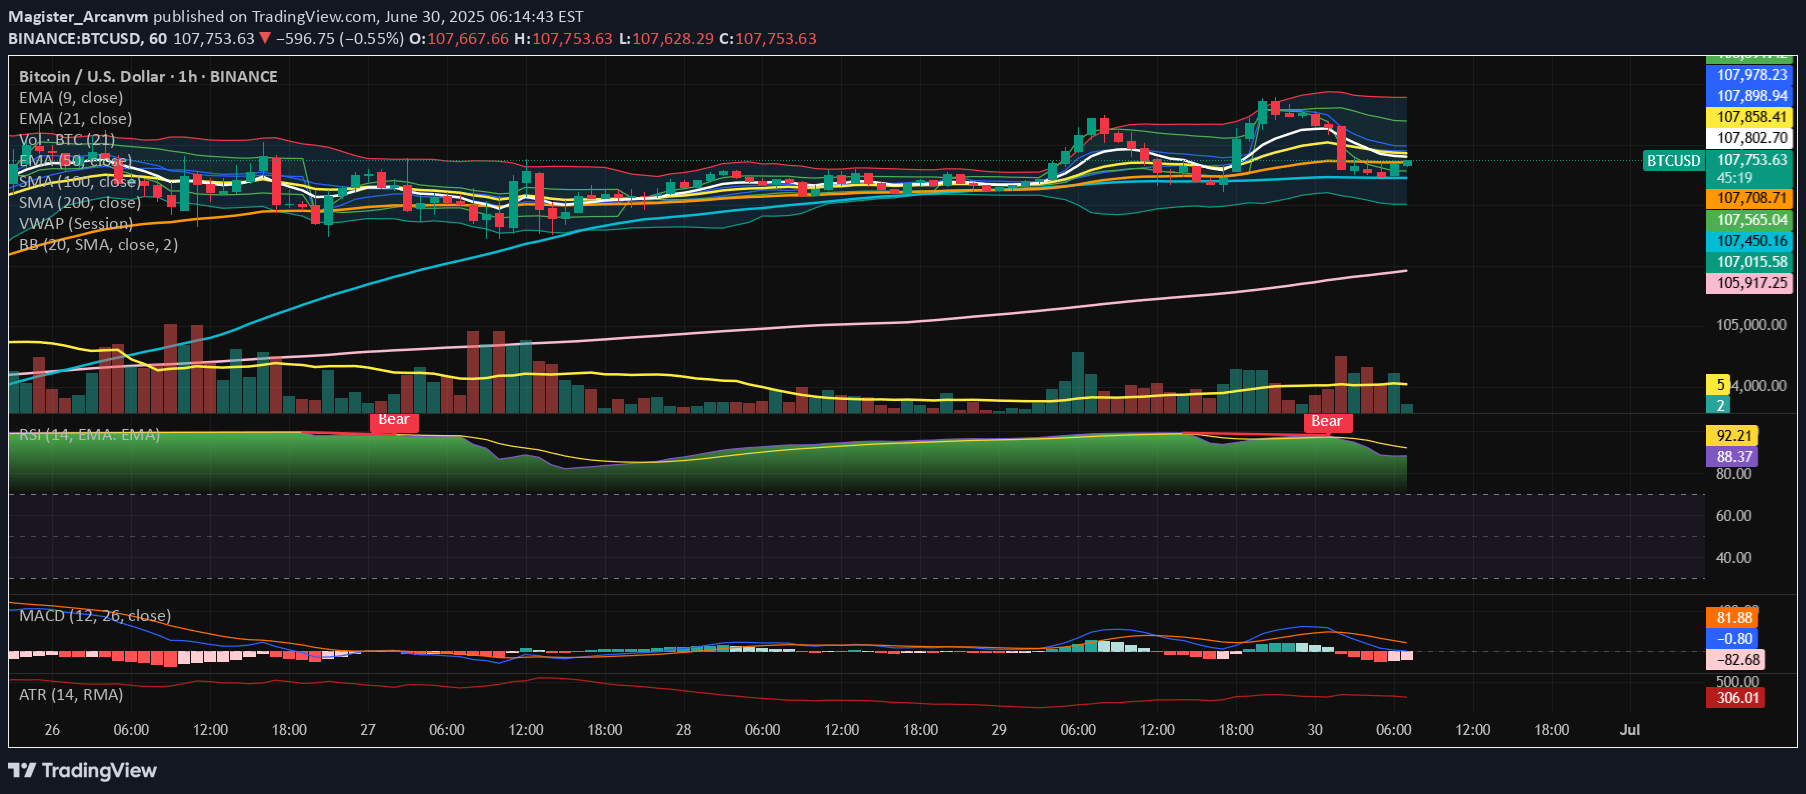
⊢⟁ BTC/USD – BINANCE – (CHART: 1H) – (Date: Jun 30, 2025).◇ Analysis Price: $107,599.99.⊢⨀ I. Temporal Axis – Strategic Interval – (1H):▦ EMA 9 – ($107,799.64):∴ The 9-period EMA remains above the current price, signaling downward rejection from short-term momentum line;∴ It recently crossed below the EMA21, reinforcing a weakening of bullish impulse.✴ Conclusion: EMA9 now acts as intraday resistance, confirming that immediate market strength has decayed and volatility expansion may continue unless reclaimed.⊢▦ EMA 21 – ($107,861.93):∴ EMA21 is sharply curved downward, validating loss of directional conviction from the previous bullish run;∴ This level aligns with a former consolidation zone, now potentially serving as a resistance pivot.✴ Conclusion: EMA21 confirms a short-term trend break, and the inability to reclaim this line would prolong corrective action.⊢▦ EMA 50 – ($107,703.87):∴ The EMA50 was breached decisively in the previous candle cluster, now positioned above price;∴ Slope is turning neutral-to-down, reflecting a transition from trend to turbulence.✴ Conclusion: EMA50 shift implies structural vulnerability in the intermediate frame, amplifying bearish tactical weight if no recovery emerges swiftly.⊢▦ SMA 100 – ($107,007.08):∴ SMA100 is currently positioned just below price, offering momentary support in case of further weakness;∴ Horizontal alignment indicates a pause or inflection zone, lacking directional strength.✴ Conclusion: SMA100 is a neutral-bullish support shelf, but could flip to active resistance if breached intraday.⊢▦ SMA 200 – ($105,890.26):∴ The SMA200 remains firmly upward-sloping and untouched — a sign of medium-trend resilience.∴ It defines the lower structural boundary for this time-frame.✴ Conclusion: SMA200 still holds bullish structural integrity, but if reached, it would represent a full reversion of recent strength.⊢▦ Volume + EMA 21 – (Current Vol: 5.31 BTC):∴ Volume shows an uptick during bearish candle clusters — indicative of active sell-side participation;∴ The EMA21 on volume reveals a rising slope, confirming that volatility is not passive, but driven by conviction.✴ Conclusion: Volume action supports the thesis of deliberate distribution, not merely rotational choppiness.⊢▦ VWAP (Session) – ($107,995.35):∴ Price has broken decisively below VWAP, showing institutional disengagement or absence of bid reinforcement;∴ VWAP now serves as magnetic resistance during any mean-reversion attempts.✴ Conclusion: VWAP position confirms that price is under fair-value, and current path is dominated by tactical sellers.⊢▦ Bollinger Bands – (Lower Band: $107,007.08):∴ Bands have widened, with price hugging the lower edge - a hallmark of volatility expansion;∴ Mean price ($107,895.00) sits significantly above spot, reinforcing downside pressure.✴ Conclusion: BB's suggest momentum breakdown, with price entering statistically stretched, yet uncorrected territory.⊢▦ RSI + EMA 9 – (RSI: 87.06 | EMA: 92.92):∴ RSI has sharply fallen from extreme overbought, but remains above the 70-level — reflecting ongoing exit from euphoric levels;∴ The EMA over RSI is crossing below, signaling loss of short-term strength and potential trend reversal.✴ Conclusion: RSI behavior implies a momentum peak has passed, though correction may still be in early phase.⊢▦ MACD – (MACD: 1.87 | Signal: -99.46 | Histogram: 101.33):∴ MACD histogram turned sharply positive following a steep drop, suggesting a potential pause in bearish acceleration;∴ Lines are converging but remain well below the zero axis - no bullish crossover yet.✴ Conclusion: MACD reflects oversold relief, but not reversal. Current state favors tactical caution rather than confidence.⊢▦ ATR (14, RMA) – (315.31):∴ ATR remains elevated, confirming ongoing high volatility and larger-than-average candle bodies;∴ This level sustains a risk zone scenario, where price swings may be unpredictable.✴ Conclusion: ATR indicates volatility expansion persists, further validating the need for defensive tactical posture.⊢🜎 Strategic Insight – Technical Oracle:∴ The technical constellation on the 1H chart reveals a clear breakdown of short-term bullish structure, now transitioning into a tactically bearish phase;∴ The rejection from VWAP and convergence of all EMA's above price confirm that any recovery must reclaim the 107.800–108.000 cluster to negate downside bias;∴ The current support rests on SMA100, yet its flat orientation and proximity to price suggest fragility, not strength. Meanwhile, SMA200 at 105.890 represents a more significant structural floor - its breach would mark a deeper tactical deterioration;∴ Volatility metrics (BB and ATR) indicate that the market is no longer coiled - it has entered expansion, and directional bias is momentarily controlled by sellers. RSI exiting overbought and MACD’s unresolved negative zone further support the thesis of ongoing correction, not mere pause;✴ Conclusion: In essence, the market has shifted into a correctional pulse, guided by structural breakdowns and expanding volatility. Tactical recoveries remain possible, but fragile and likely limited unless EMA's are reclaimed with force.⊢∫ II. On-Chain Intelligence – (Source: CryptoQuant):▦ Exchange Netflow Total – (All Exchanges) – (Last Recorded: +2.1K BTC):∴ Recent spike in netflow reveals a sudden influx of Bitcoin into centralized exchanges, marking the first positive divergence after a long series of outflows;∴ Such inflows historically precede tactical distribution events or profit-taking phases, especially following extended rallies.✴ Conclusion: Netflow confirms that holders are actively preparing to sell, giving real on-chain weight to the price rejection seen on the 1H chart.⊢▦ Short-Term Holder SOPR – (Latest Value: 1.012):∴ SOPR sits slightly above 1.0, but descending - indicating a transition from profit realization to potential break-even or loss selling;∴ If the trend continues and dips below 1.0, it marks capitulation from recent buyers — often a trigger for volatility spikes or local bottoms.✴ Conclusion: Current STH SOPR signals weakening conviction among short-term holders, supporting a corrective narrative rather than trend continuation.⊢🜎 Strategic Insight – On-Chain Oracle:∴ The on-chain substrate aligns precisely with the tactical weakness shown in the chart. The positive exchange netflow acts as a material indicator of sell-side readiness;∴ This inflow, breaking the historical trend of outflows, marks a shift in intent - from holding to liquidation;∴ Simultaneously, the Short-Term Holder SOPR sits on a critical edge. Its descent toward the 1.0 threshold implies that recent buyers are either approaching breakeven or beginning to capitulate;∴ This fragile posture typically amplifies local corrections, especially when coupled with rising volatility;∴ On-chain momentum no longer supports bullish continuation. Instead, it reflects hesitation, rotation, and distribution - all hallmarks of a short-term correction phase, in alignment with the temporal analysis;✴ Conclusion: The on-chain field confirms that the technical breakdown is not speculative - it is supported by active internal dynamics, signaling a pause or reversal in trend strength at a structural level.⊢⧈ Codicillus Silentii – Strategic Note:∴ The current H1 formation is a textbook example of post-euphoric fragility. What appeared as steady accumulation has now transitioned into a volatile de-leveraging phase. The confluence of bearish momentum, increased volume, and netflow reversal suggests the market is entering a tactical contraction zone;∴ No structural collapse is yet confirmed - but the absence of bullish defense at VWAP and EMA clusters denotes reduced resilience. Until these are reclaimed, all attempts at recovery must be viewed with caution.✴ Conclusion: Silence in structure signals preparation - not passivity. The next move shall emerge not from noise, but from the void left by exhaustion.⊢𓂀 Stoic-Structural Interpretation:∴ Structurally Bearish – Tactically Suspended;∴ The 1H chart shows a break below short-term momentum zones (EMA's, VWAP), confirming structural fragility;∴ Despite momentary support on SMA100, the loss of upward slope across the EMA's and RSI reversal validate a structural bearish bias;✴ Conclusion: Tactical direction remains suspended until one of two pivots is breached: either VWAP (~107.995) reclaimed, or SMA200 (~105.890) broken.⊢⧉⚜️ Magister Arcanvm – Vox Primordialis!𓂀 Wisdom begins in silence. Precision unfolds in strategy.⧉⊢⊢⧉ III. Contextvs Macro–Geopoliticvs – Interflux Economicvs - (Outlook – July 2025).⊢▦ US–China/UK Tariff Resolution Deadline – (July 9th):∴ The expiration of the 90-day tariff suspension looms, with only partial deals secured. Trump’s vague posture introduces volatility risk;∴ A lack of resolution may trigger reciprocal tariff escalations, dampening global liquidity and risk appetite.✴ Conclusion: Rising geopolitical friction may pressure speculative assets, delaying capital inflows into crypto markets during early July.⊢▦ US Tax Cuts + Spending Bill - (Trump Proposal):∴ Expected to inflate US national debt by $3.3T, nearing $36.2T, while lacking austerity backing;∴ Inflationary pressure may mount, but market reception depends on Senate reaction and Fed posture.✴ Conclusion: Fiscal expansion narrative could support medium-term Bitcoin hedging, though short-term uncertainty dominates.⊢▦ US Payroll Report – (July 3rd):∴ A critical macro trigger. A strong report may reinforce Fed neutrality or hawkishness, while a weak one may reintroduce easing expectations;∴ Risk assets, including Bitcoin, may respond sharply.✴ Conclusion: The payroll report will likely define the tactical tone for the first 10 days of July, shaping risk-on/off cycles.⊢
