
jimmyak_1975
@t_jimmyak_1975

What symbols does the trader recommend buying?
Purchase History
پیام های تریدر
Filter
اسکالپ سولانا در تایم فریم M15: سقوط 3.5 درصدی یا ریزش شارپ؟ سناریوهای معاملاتی پیش رو
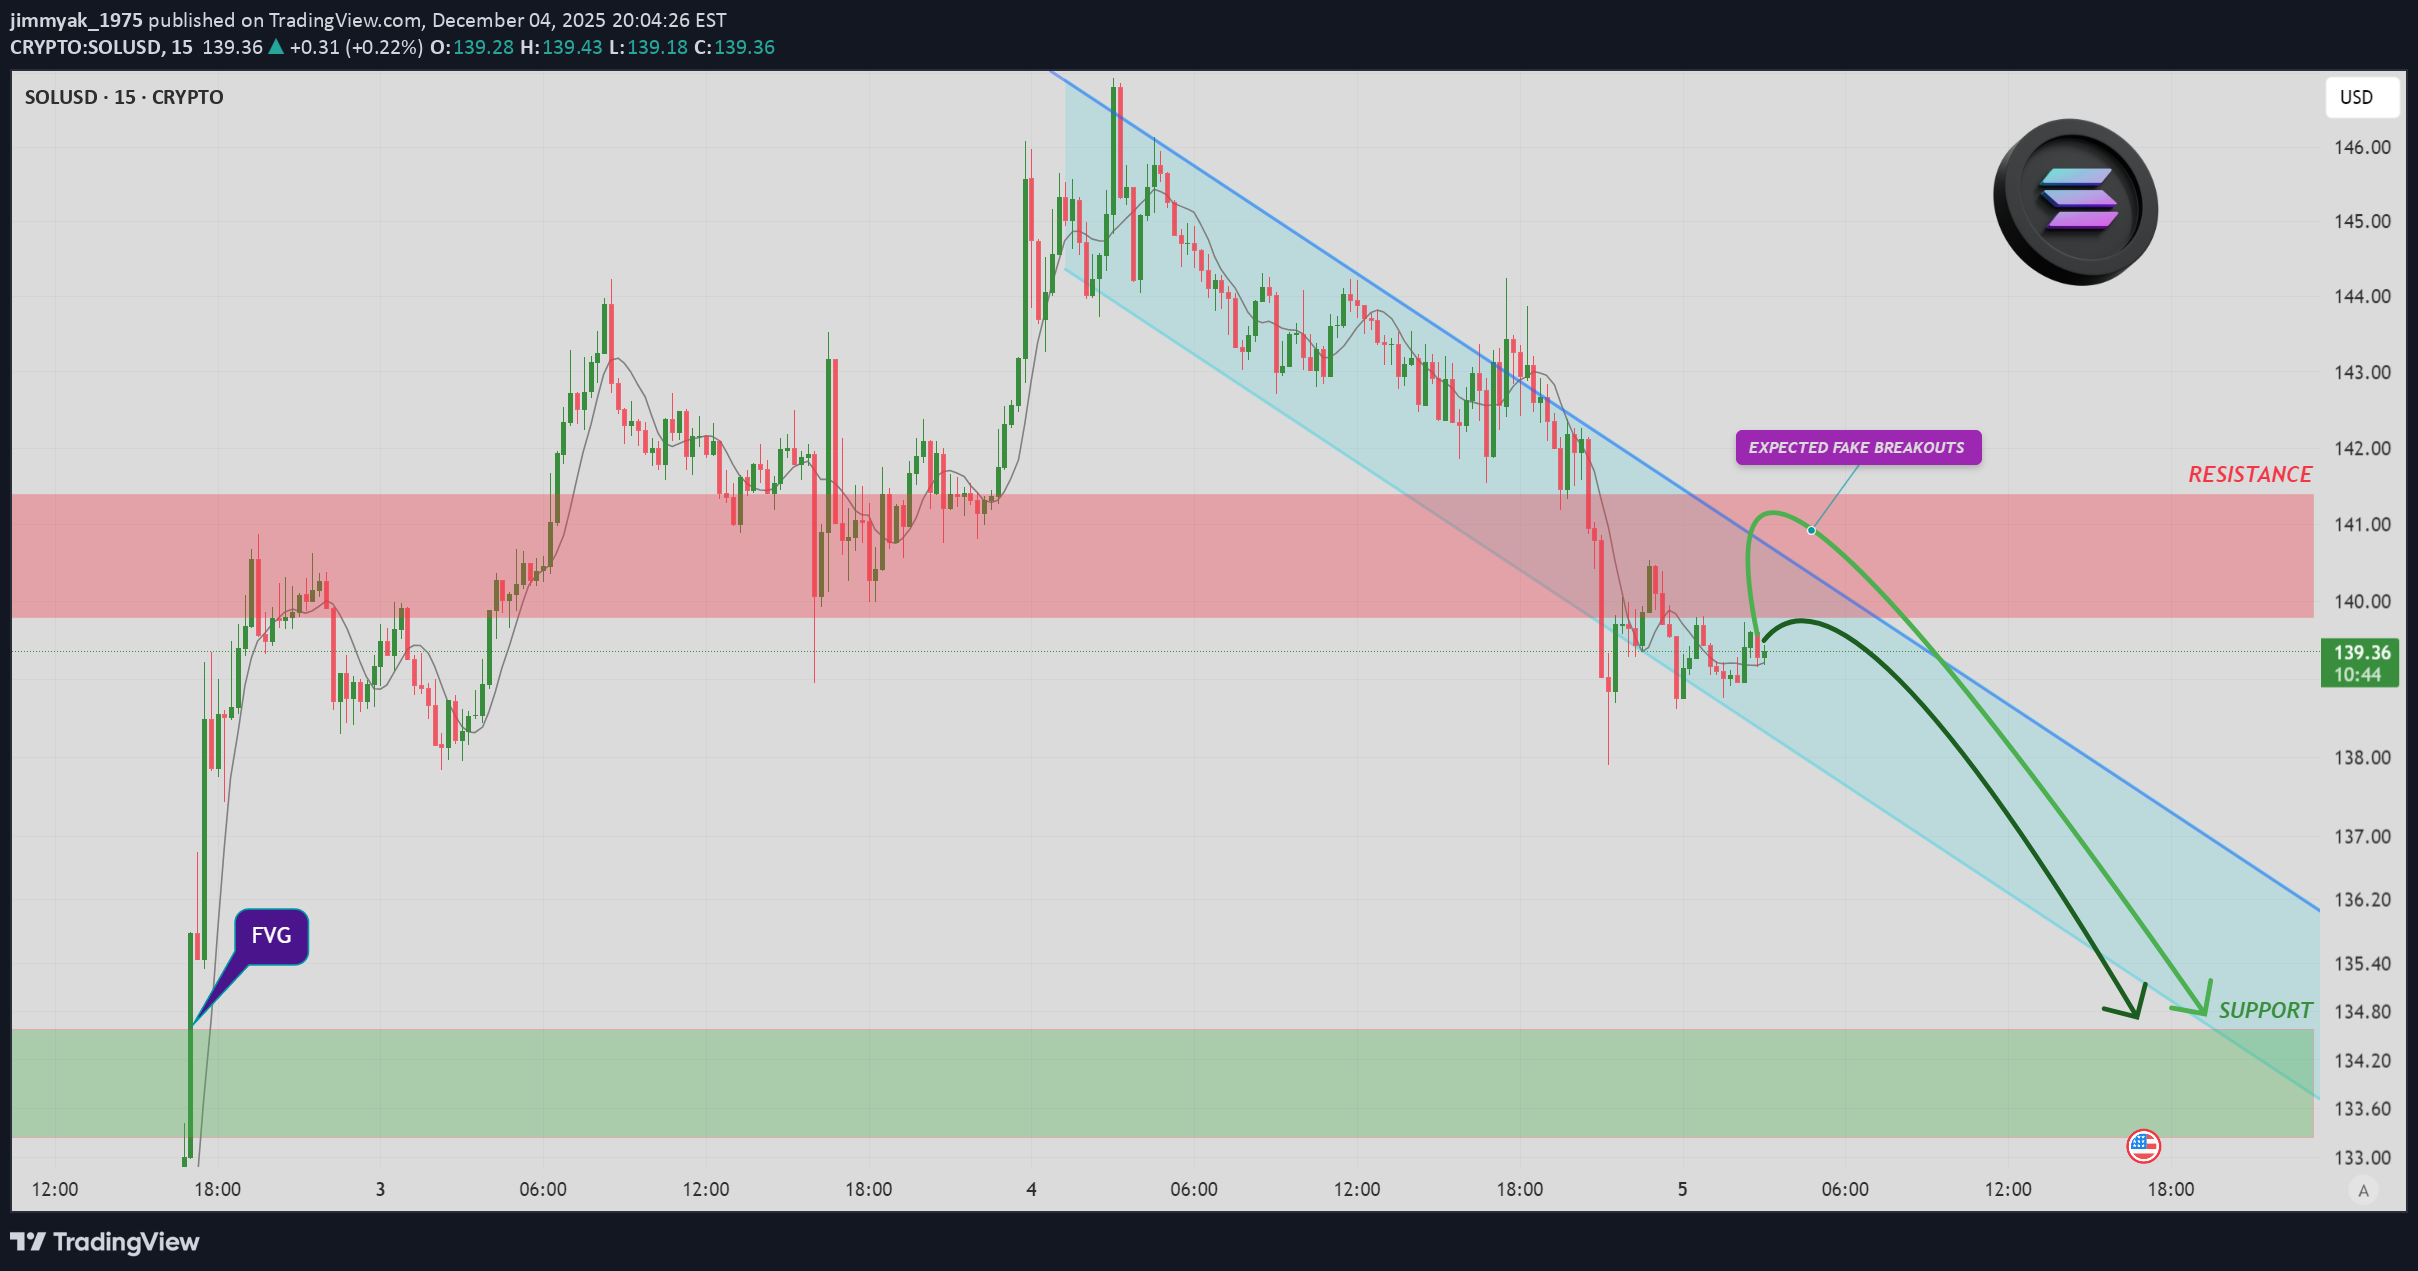
We are expecting at least a 3.5 % drop from this point towards lower Support zones. The descending channel is still holding. Scenario 1: a brief upper correction facing the red zone & probably slightly crossing the channel, thus collecting liquidity. Scenario 2: a Sharp drop from here towards the green rendezvous support zone. Safe Trade.
آپدیت مهم سولانا: ۴ سیگنال قوی که ریزش قریبالوقوع را تایید میکنند!
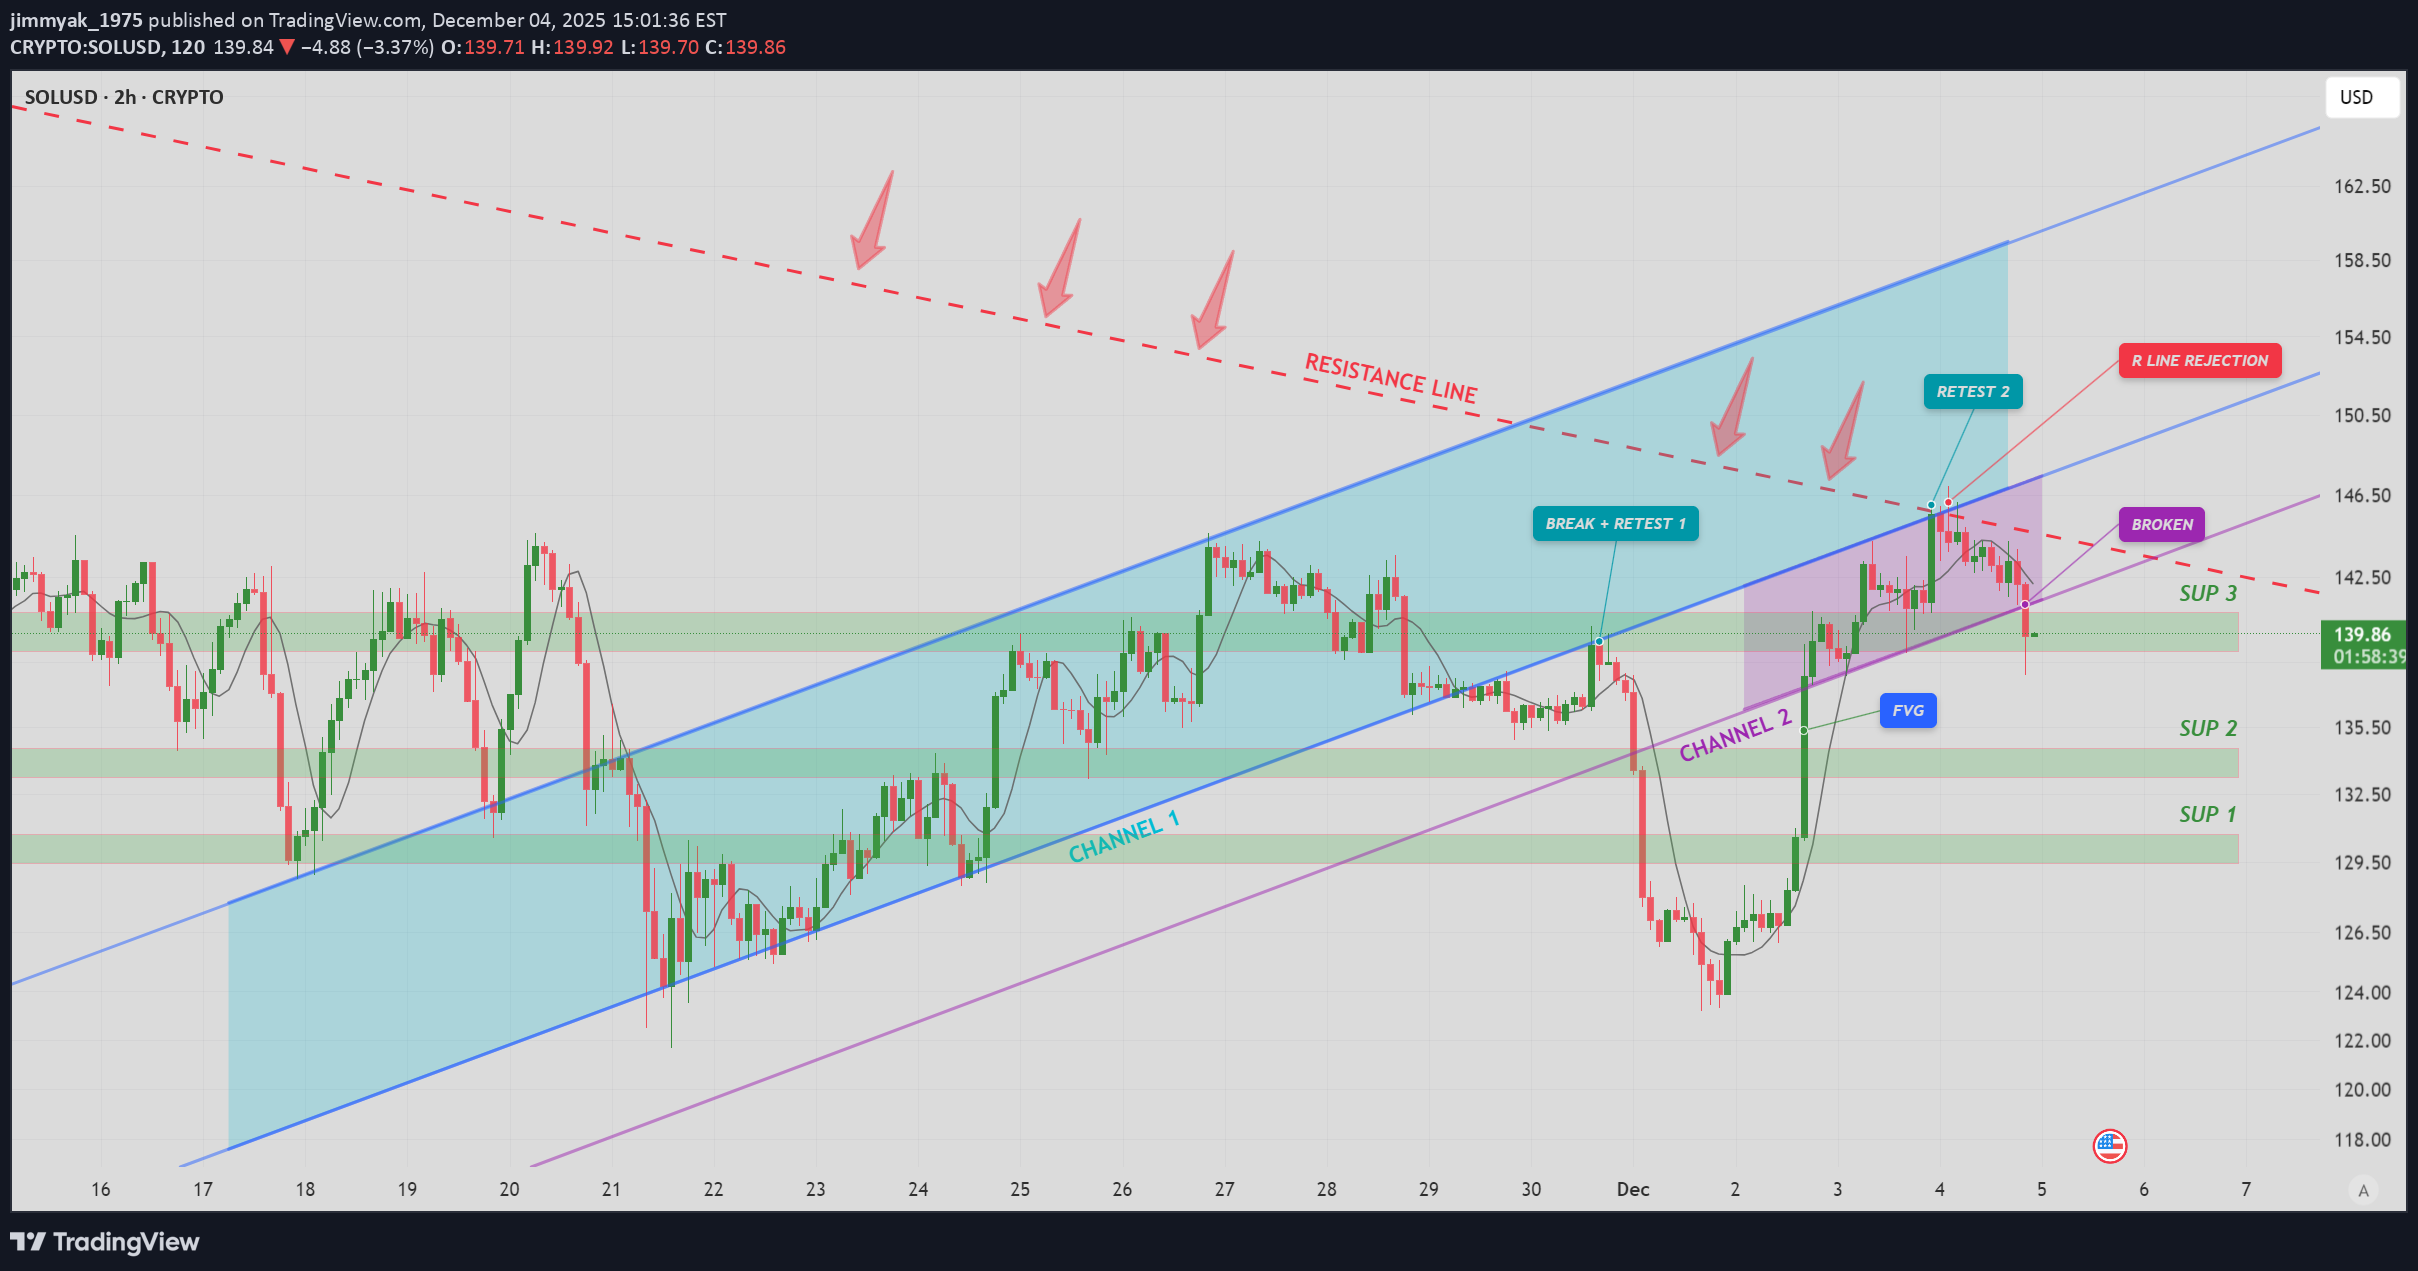
A small yet Important update for the recent analysis. 1st, we have a Strong red resistance line stretching back to the origin of this whole big bearish leg from the Top of SEP 18. This line has been respected several times & has proven to be powerful. That same line was retested today with clear rejection. 2nd, we have a second ascending purple channel, next to the major blue one. It is more visual in the 30mn time frame. Also, the chart has just broken this channel. So We have Retested blue channel 1 for the 2nd time & just broken purple channel 2. Add to this that we have also reached Fibonacci 1 in a Potential corrective wave C. These 4 Signals are giving the upper hand for a more downward move while we are approaching the FVG zone. We might witness a retest of the channel 2 lower border before proceeding down. An upward move is still valid yet getting weaker by the minute. Safe Trade.
تحلیل تکنیکال سولانا (SOL): آیا به هدف 150 دلار میرسد یا سقوط بزرگ در راه است؟
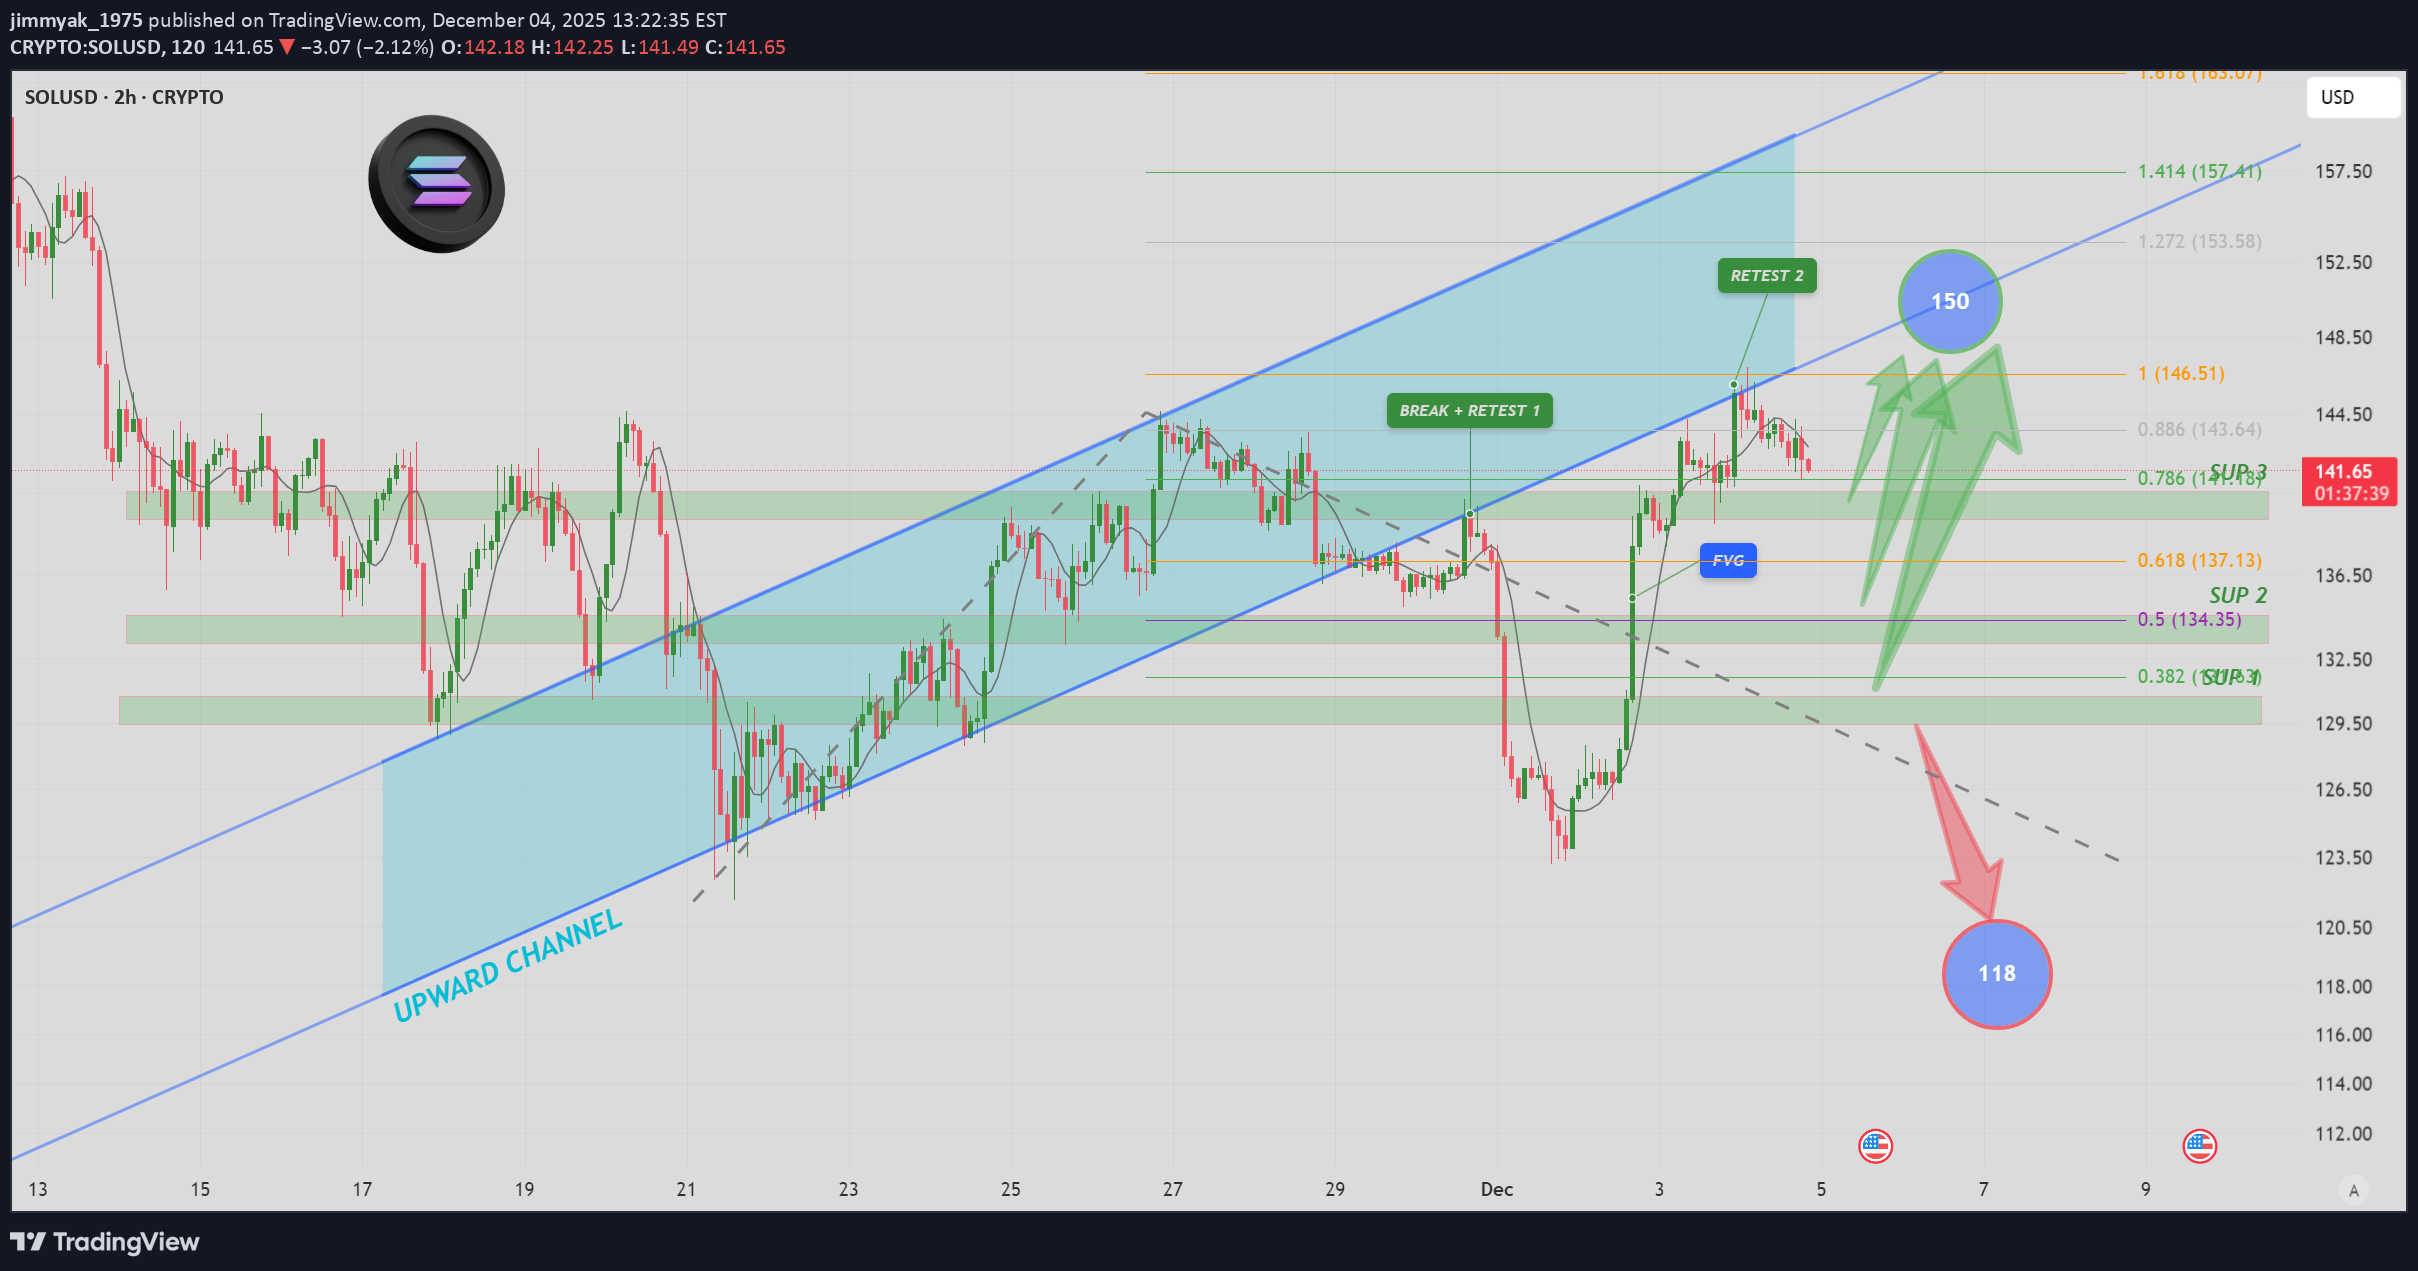
The Ascending channel was broken & retested 1st time with a strong downward move for the 123 Bottom. Chart reclaimed that gap but as seen on the chart, it was rejected from the lower border of the same channel. The rejection is not strong as in the 1st retest of NOV 30, at least for now, indicating a potential continuation of the upward trend. We have 3 Support zones where Solana can use to push to the 150 mark at least. The FVG can play in favor of a downward trend breaching all the 3 Support zones and reaching a 1st target of 118. Regarding Elliott waves, we are potentially in the corrective leg C. it has already extended to Fibonacci 1, but it can extend further. If extended, the next logical target is 158 which coincides with 1.414 Fib while meeting a very strong Resistance zone; the Bottom of 2 AUG 25. It is too early to assume this leg as a Bullish trend, so I still favor a Downward move to much lower support zones after this upward "corrective" leg reaches its target. Safe Trade.
تحلیل موج الیوت سولانا: هشدار سقوط قریبالوقوع و اهداف قیمتی شوکهکننده!
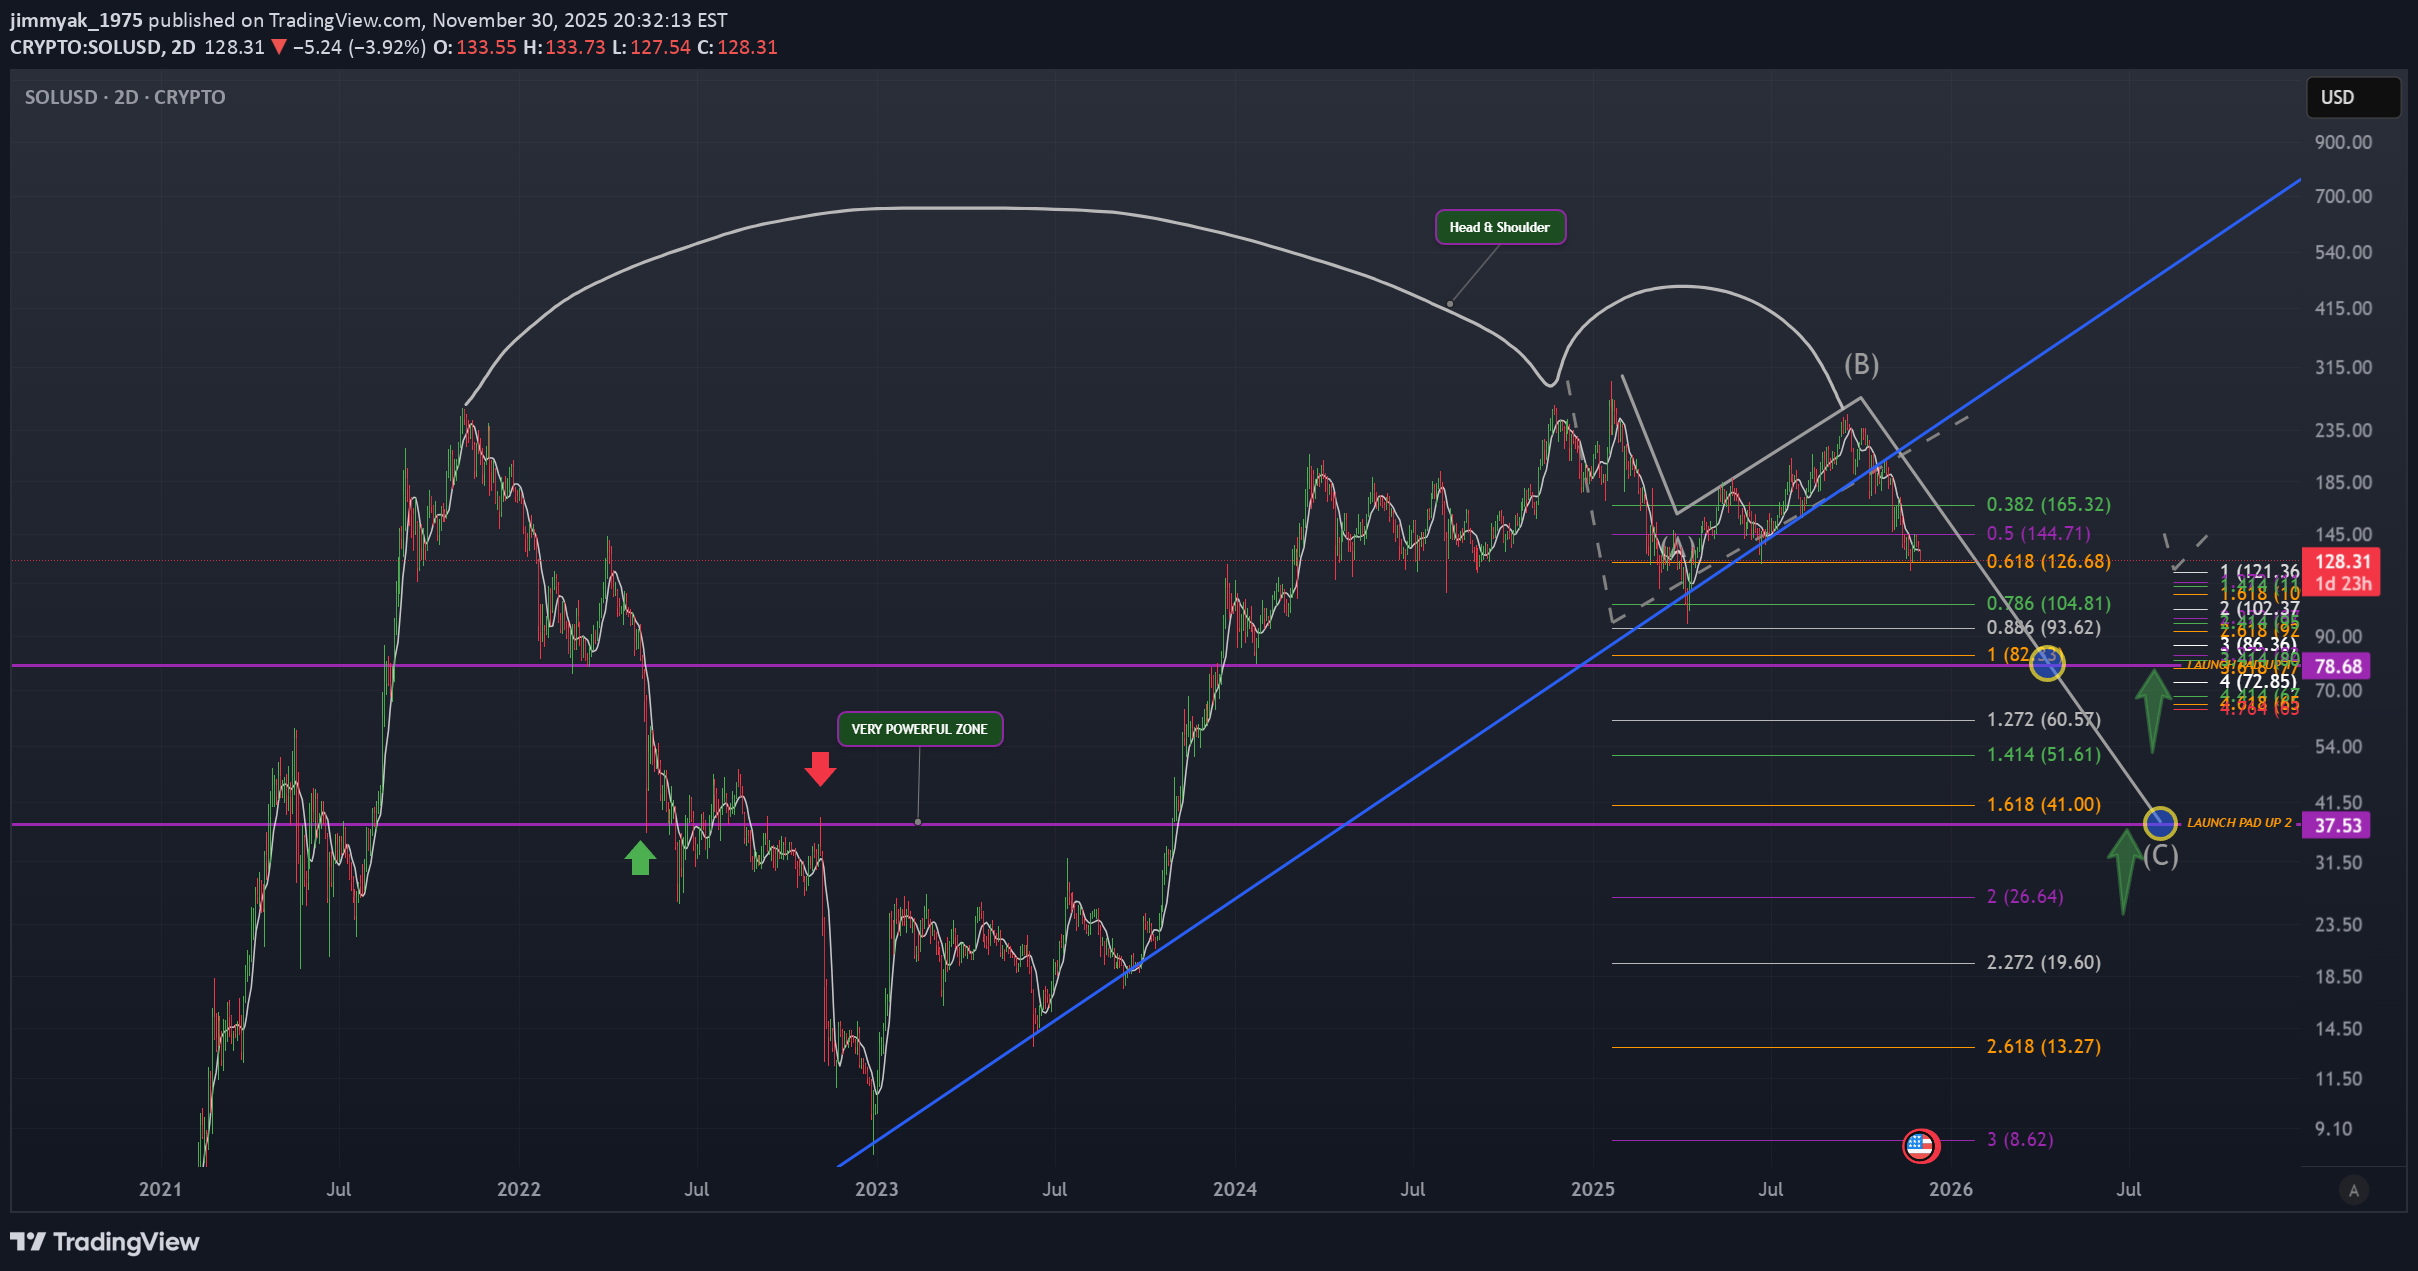
Solana is showing strong signals of a solid downtrend. 1st, the Blue Diagonal Trend line which we cannot miss, was broken, but also Retested & so confirming the Break. These Trend lines are powerful when they are traced correctly. This line connects 6 solid bottoms since 2022 as seen on the chart, thus breaking it is simply a very clear & loud declaration of a trend change. 2nd, we have reached a TOP/ATH in JAN 2025, followed by a deep correction of -68%. We had bullish trend after that in APRIL, that failed to breach that top. That last top of SEP25 created a Head & Shoulder with NOV24. The chart had a chance to prove its bullish intentions on 2 FAILED occasions. 1, 12-28OCT (weak green pullback) & 2, 5-11NOV (also weak green PB). these 2 Pullbacks were critical since they landed on strong support zones (180-187 & 146-157). both went to the drainage. this is already alarming by itself. The WHOLE GREEN LEG from APRIL 7 till SEP 18 was doomed @ the 2nd Failed Pullback. Some might argue that we still have the 120 level as a support. TRUE, yet I don't think it stands a chance with the coming Tsunami. It makes more sense now that we are in ABC correction as seen on the chart starting JAN 25. the C wave has completed 3 waves within its 5 legs. 5th wave has already started on NOV 25 @ around 6. the proof for this, is the depletion in the last red leg (check 4hrs time frame) and also, the new top we made Wednesday NOV26 reached 99% retracement of the previous top. telling us: I AM WAVE 2. wave 3 started with sub waves 1 & 2, and sub wave 3 just started at 15:30 today and showing its might at 1 am, 1st of December. Wave C has 2 main potential landing sites. one, around 78 which coincided with Fibonacci extension 1 (perfect for C waves), and another deeper one which i favor around 37 which coincides with 1.618 Fibonacci (extended C). the latter has a more powerful support zone when you look at dates May 22 till Nov 22 (as seen on chart). The wave 5 will have to be quite extended though to reach the 37 mark. Safe Trade.
فشار نهایی بیت کوین: آیا ریزش بزرگ در راه است یا جهش به 100 هزار دلار؟
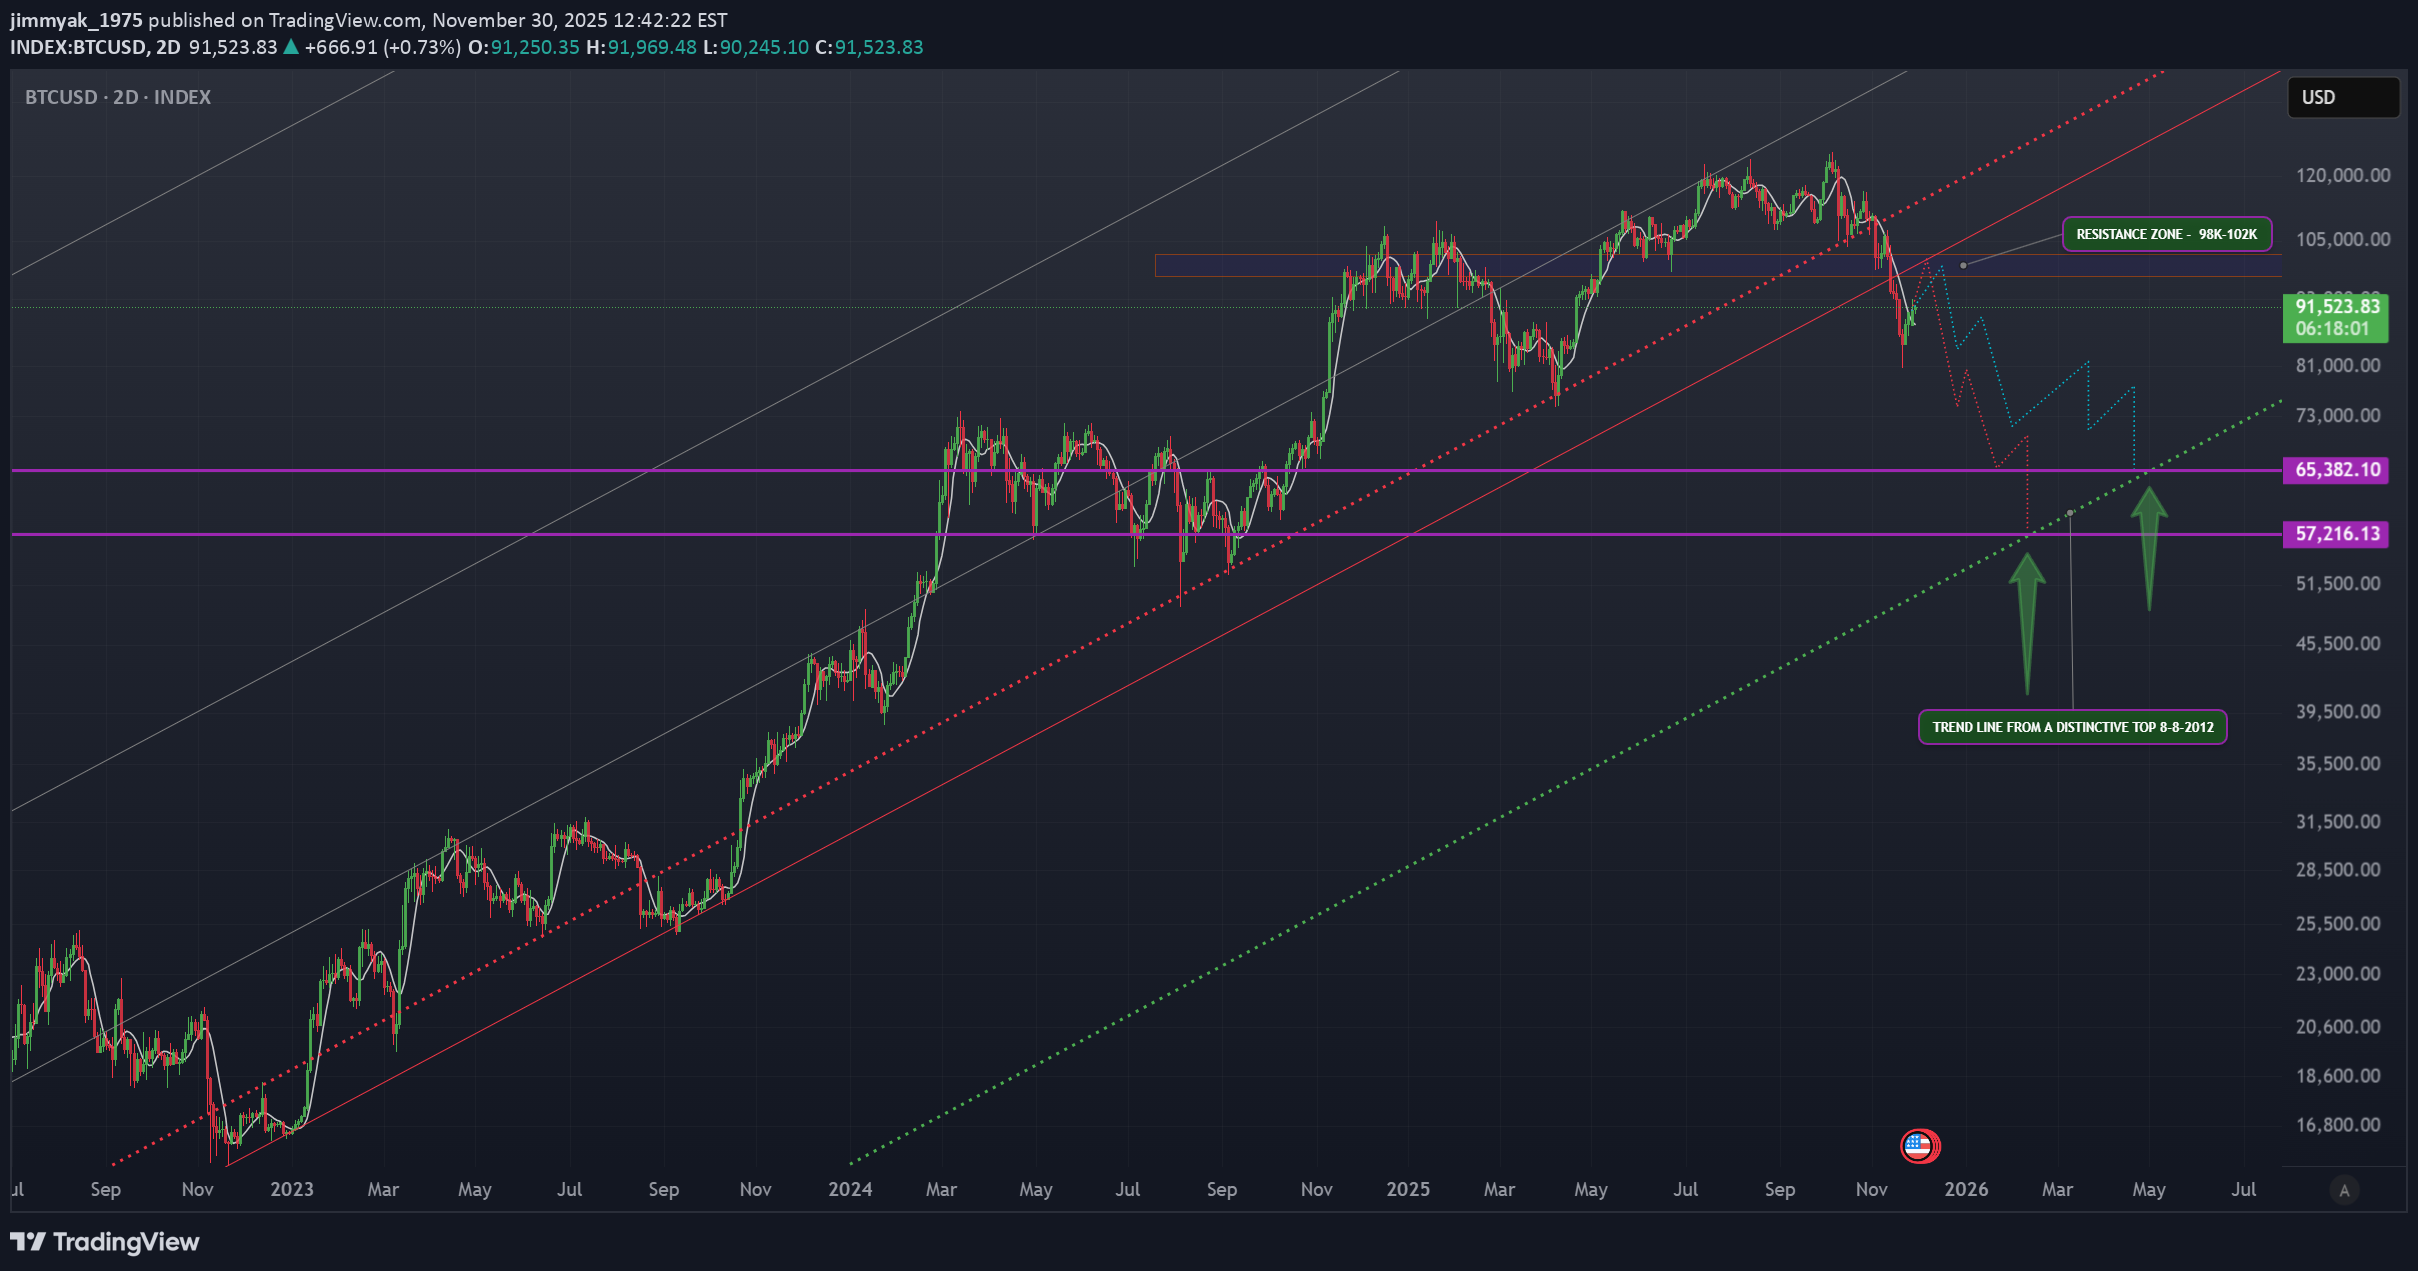
As a start we have an obvious break of the red dotted diagonal line that is traced way back with solid connected bottoms. this is a very strong bearish signal in itself. a limited 35% drop from the top with such a strong break is highly improbable. a continuation towards lower support zones is a normal extension of that initial drop. Using Diagonal Trend lines that are connected through several key bottoms and tops, along with other indicators, we can expect a retest of resistance = 98k-102k most probably close to 98k. A bounce down follows with 2 possibilities of landing zones, 65k or 57k . both are good candidates for a rebound up & a start of a bullish trend. The green dotted line can be traced back to 8/8/2012 from a very distinctive Top (it's actually a zone). This might be as far as you can go away from traditional trading analysis, but sometimes thinking out of the box can help reveal info hidden in plain site.
Disclaimer
Any content and materials included in Sahmeto's website and official communication channels are a compilation of personal opinions and analyses and are not binding. They do not constitute any recommendation for buying, selling, entering or exiting the stock market and cryptocurrency market. Also, all news and analyses included in the website and channels are merely republished information from official and unofficial domestic and foreign sources, and it is obvious that users of the said content are responsible for following up and ensuring the authenticity and accuracy of the materials. Therefore, while disclaiming responsibility, it is declared that the responsibility for any decision-making, action, and potential profit and loss in the capital market and cryptocurrency market lies with the trader.