
alajmii
@t_alajmii

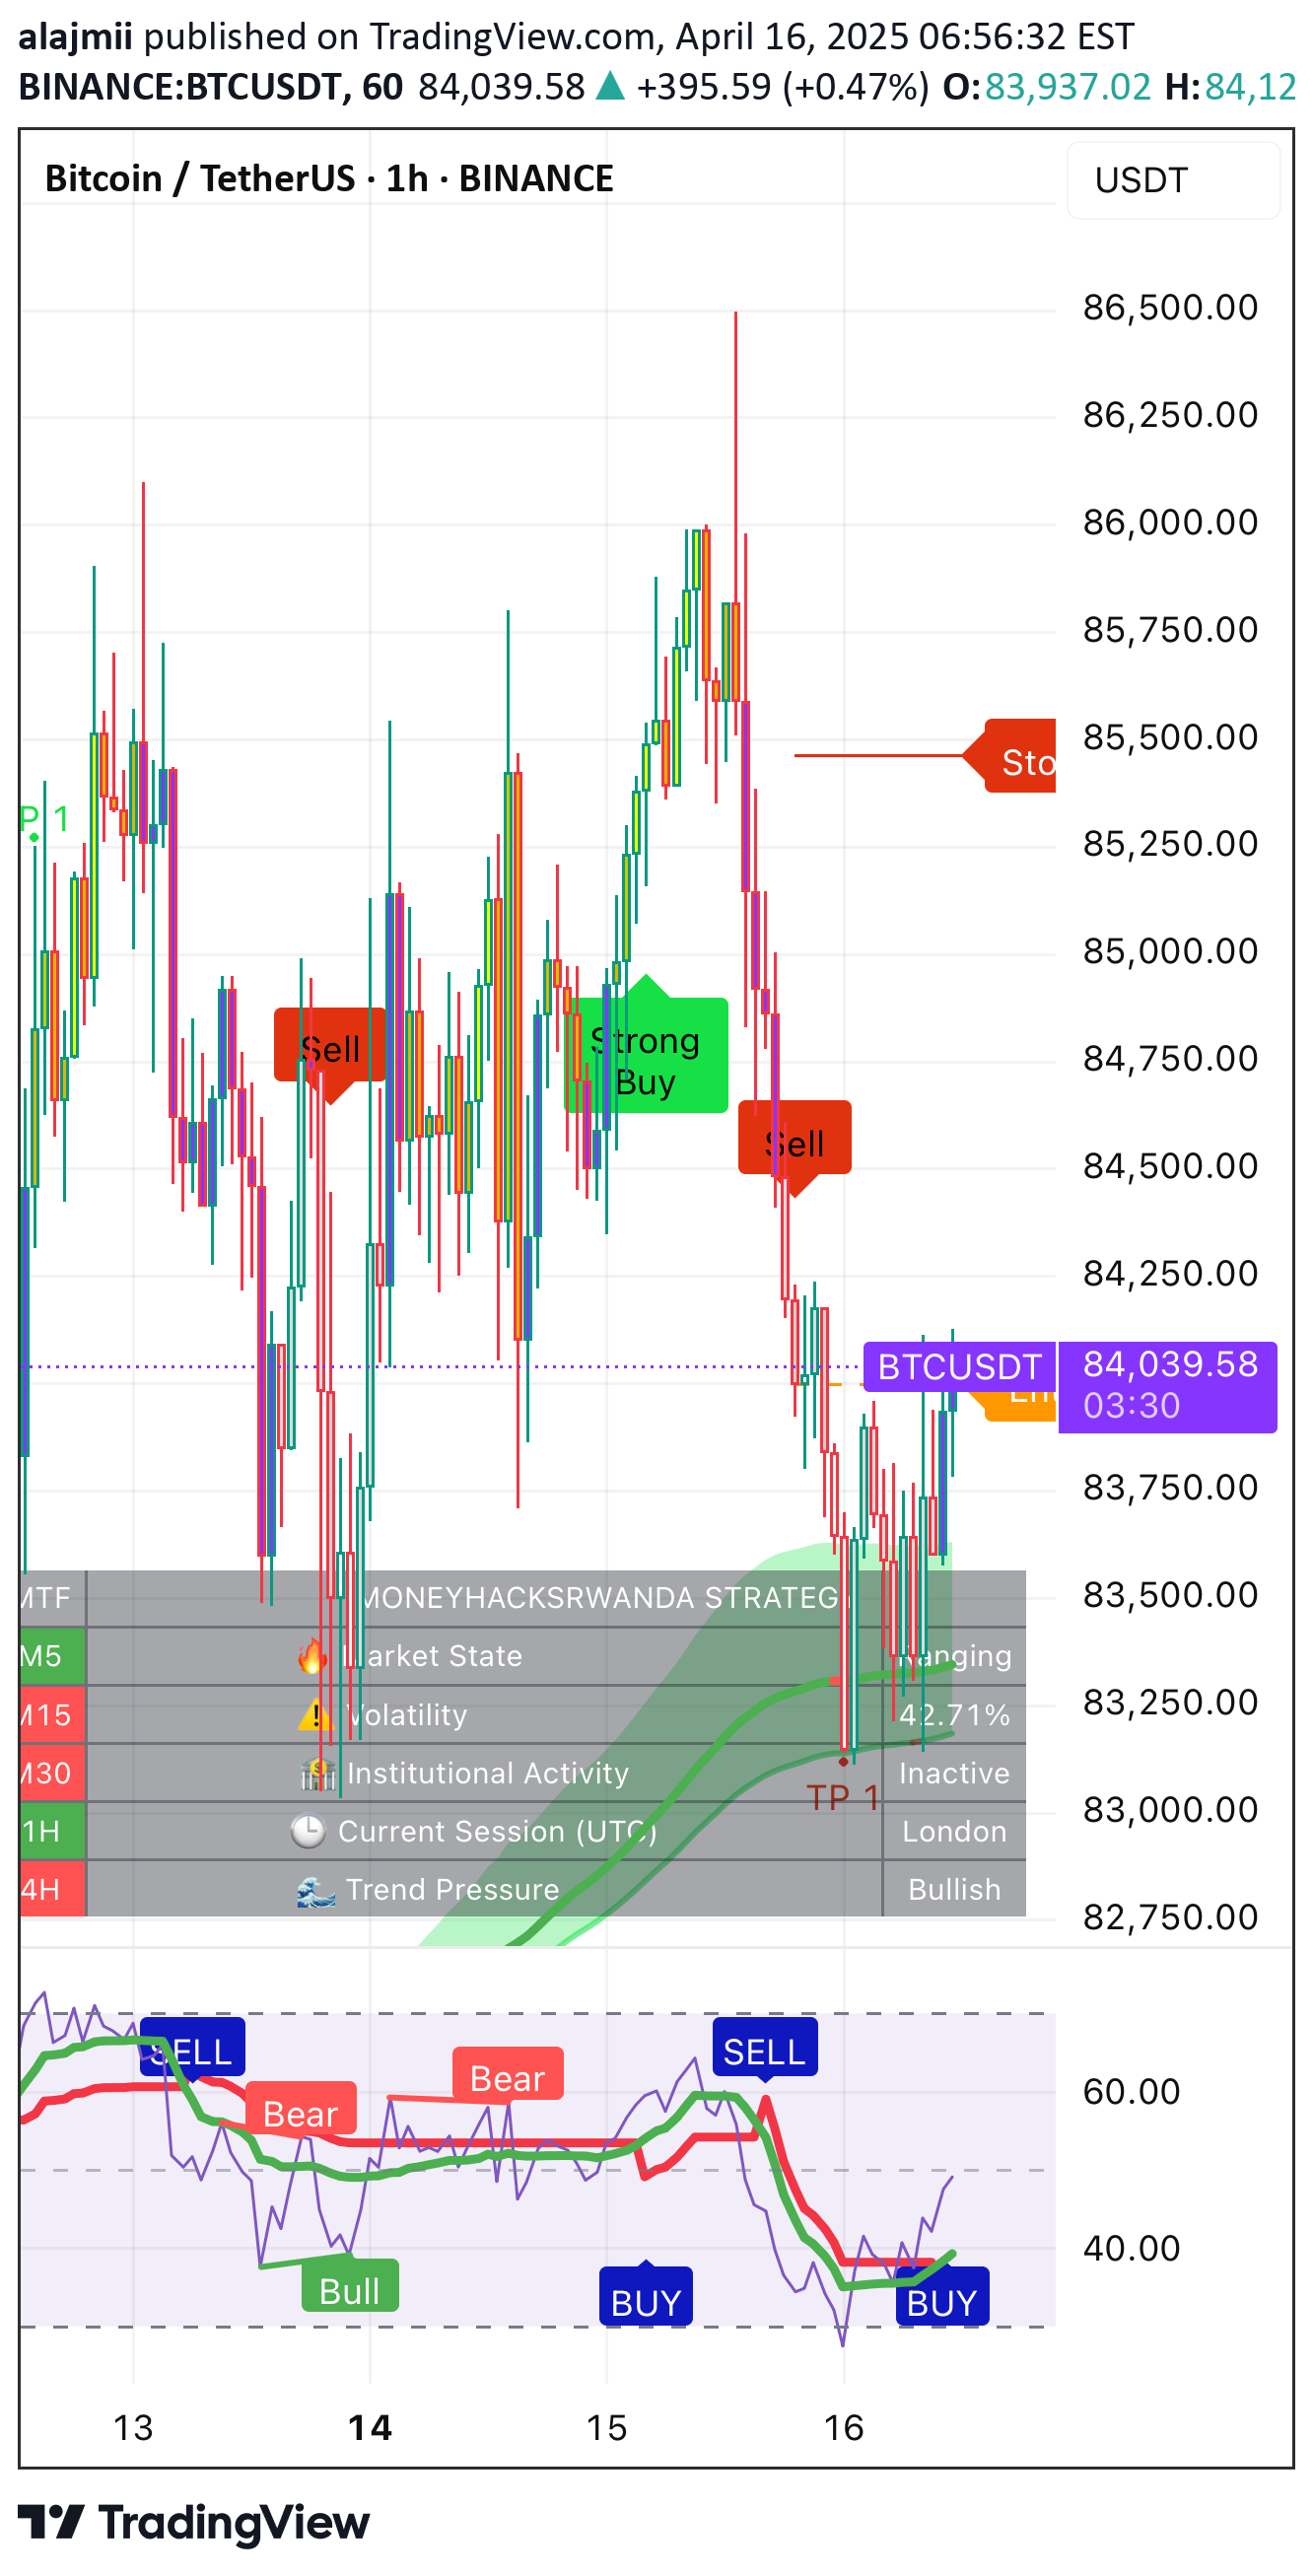
What symbols does the trader recommend buying?
Purchase History
پیام های تریدر
Filter
Signal Type
// This Pine Script™ code is subject to the terms of the Mozilla Public License 2.0 at mozilla.org/MPL/2.0/// Join us t.me/cryptomena1//version=5indicator(title='Osc+ ST+sqzmom',overlay=false,max_lines_count = 100)n1 = input(10, 'Channel Length')n2 = input(21, 'Average Length')obLevel1 = input(60, 'Over Bought Level 1')obLevel2 = input(53, 'Over Bought Level 2')osLevel1 = input(-60, 'Over Sold Level 1')osLevel2 = input(-53, 'Over Sold Level 2')ap = hlc3esa = ta.ema(ap, n1)d = ta.ema(math.abs(ap - esa), n1)ci = (ap - esa) / (0.015 * d)tci = ta.ema(ci, n2)wt1 = tciwt2 = ta.sma(wt1, 4)plot(0, color=color.new(color.gray, 0))ob1 = plot(obLevel1, color=color.new(color.maroon, 90))os1 = plot(osLevel1, color=color.new(color.aqua, 90))ob2 = plot(obLevel2, color=color.new(color.maroon, 90))os2 = plot(osLevel2, color=color.new(color.aqua, 90)) p1 = plot(wt1, color=color.new(color.aqua, 0))p2 = plot(wt2, color=color.new(color.maroon, 0))plot(wt1 - wt2, color=wt2 - wt1 > 0 ? color.new(color.maroon, 50) : color.new(color.aqua, 50), style=plot.style_histogram)plot(ta.cross(wt1, wt2) ? wt2 : na, color=color.new(color.black, 0), style=plot.style_circles, linewidth=3)plot(ta.cross(wt1, wt2) ? wt2 : na, color=wt2 - wt1 > 0 ? color.maroon : color.aqua, style=plot.style_circles, linewidth=2)fill(p1,p2,color = wt2 - wt1 > 0 ? color.new(color.red, 50) : color.new(color.aqua, 50))fill(ob1,ob2,color = color.new(color.maroon, 20))fill(os1,os2,color = color.new(color.aqua, 20))////////////////////////////////////////////////////////////////////// Supertrend InputsatrPeriod = input.int(10, 'ATR Length', minval = 1)factor = input.float(2.5, 'Factor', minval = 0.01, step = 0.01)// Squeeze Momentum Indicator Inputssource = input(close, 'Source')bbLength = input.int(20, 'Bollinger Bands Length', minval = 1)bbMult = input.float(2, 'Bollinger Bands MultFactor', step = 0.25)kcLength = input(20, 'Keltner\'s Channel Length')kcMult = input.float(1.5, 'Keltner\'s Channel MultFactor', step = 0.25)useTrueRange = input(true, 'Use TrueRange (Keltner\'s Channel)')signalLength = input(5, 'Signal Length')tooltip_sqz = 'The Squeeze Indicator measures the relationship between Bollinger Bands and Keltner\'s Channels to help identify consolidations and signal when prices are likely to break out (whether up or down). ' + 'The Squeeze Indicator finds sections of the Bollinger Bands which fall inside the Keltner\'s Channels and in this case the market is said to be in a squeeze (indicator turns off, displayed with grey diamond shapes in this study). ' + 'When the volatility increases, so does the distance between the bands, conversely, when the volatility declines, the distance also decreases and in such cases the squeeze is said to be released (indicator turns on, displayed with triangle up or triangle down shapes)'components = input.bool(false, 'Components of the Squeeze Indicator', tooltip = tooltip_sqz)// Customizable thresholdslowerThreshold = input(-1.0, title = 'Lower Threshold')upperThreshold = input(1.0, title = 'Upper Threshold')// Hardcoded tp + sl multiplierstargetMultiplier1 = 1targetMultiplier2 = 2targetMultiplier3 = 3stopLossMultiplier = 3// Input switches for alertsalertTrendChange = input.bool(true, title='Enable Trend Change Alert')// Calculate Supertrend[supertrend, direction] = ta.supertrend(factor, atrPeriod)// Plot the Supertrend lineplot(supertrend, color = direction < 0 ? color.green : color.red, title = 'ST', style = plot.style_stepline_diamond,force_overlay=true)// Determine if the trend is up or downupTrend = direction < 0downTrend = direction > 0// Track previous trend statevar int previousDirection = napreviousDirection := upTrend ? 1 : -1// Calculate ATR for targets and stop lossatrValue = ta.atr(atrPeriod)// Initialize target and stop loss levelsvar float entryPrice = navar float targetLevel1 = navar float targetLevel2 = navar float targetLevel3 = navar float stopLossLevel = na// Initialize counters for lines and labelsvar int count_up = 0var int count_down = 0// Initialize a new variable to track if new lines and labels are drawnvar bool newLinesDrawn = false// Calculate target and stop loss levelsif upTrend entryPrice := close targetLevel1 := close + atrValue * targetMultiplier1 targetLevel2 := close + atrValue * targetMultiplier2 targetLevel3 := close + atrValue * targetMultiplier3 stopLossLevel := close - atrValue * stopLossMultiplier count_up := count_up + 1 count_down := 0else if downTrend entryPrice := close targetLevel1 := close - atrValue * targetMultiplier1 targetLevel2 := close - atrValue * targetMultiplier2 targetLevel3 := close - atrValue * targetMultiplier3 stopLossLevel := close + atrValue * stopLossMultiplier count_down := count_down + 1 count_up := 0// Calculate BBbasis = ta.sma(source, bbLength)dev = kcMult * ta.stdev(source, bbLength)bbUpper = basis + devbbLower = basis - dev// Calculate KCma = ta.sma(source, kcLength)trRange = useTrueRange ? ta.tr : high - lowrangema = ta.sma(trRange, kcLength)kcUpper = ma + rangema * kcMultkcLower = ma - rangema * kcMultsqzOn = bbLower > kcLower and bbUpper < kcUppersqzOff = bbLower < kcLower and bbUpper > kcUppernoSqz = sqzOn == false and sqzOff == falseval = ta.linreg(source - math.avg(math.avg(ta.highest(high, kcLength), ta.lowest(low, kcLength)), ta.sma(source, kcLength)), kcLength, 0)signal = ta.sma(val, signalLength)dir = val // - signal// Plotting Squeeze Momentum IndicatorsegitigaUp = sqzOff and dir > dir[1] and dir >= upperThresholdsegitigaDown = sqzOff and dir < dir[1] and dir <= lowerThresholdplotshape(sqzOn or noSqz ? true : false, 'In Squeeze', shape.square, location.top, color.new(color.black, 0), show_last = 500,force_overlay=true)plotshape(segitigaUp ? true : false, 'Squeeze Release UpTrend', shape.triangleup, location.top, color.new(color.green, 0), show_last = 500,force_overlay=true)plotshape(segitigaDown ? true : false, 'Squeeze Release DownTrend', shape.triangledown, location.top, color.new(color.red, 0), show_last = 500,force_overlay=true)// Draw lines and labels for targets and stop lossvar line stopLossLine = navar line entryLine = navar line targetLine1 = navar line targetLine2 = navar line targetLine3 = navar label stopLossLabel = navar label entryLabel = navar label targetLabel1 = navar label targetLabel2 = navar label targetLabel3 = na// Clear previous lines and labels if a new trend is confirmedif upTrend and count_up == 1 // Clear previous lines and labels line.delete(stopLossLine) line.delete(entryLine) line.delete(targetLine1) line.delete(targetLine2) line.delete(targetLine3) label.delete(stopLossLabel) label.delete(entryLabel) label.delete(targetLabel1) label.delete(targetLabel2) label.delete(targetLabel3) // Draw new lines 5 bars into the future stopLossLine := line.new(bar_index, stopLossLevel, last_bar_index + 5, stopLossLevel, color = color.red, width = 2,force_overlay=true) entryLine := line.new(bar_index, close, last_bar_index + 5, close, color = color.green, width = 2,force_overlay=true) targetLine1 := line.new(bar_index, targetLevel1, last_bar_index + 5, targetLevel1, color = color.blue, width = 2,force_overlay=true) targetLine2 := line.new(bar_index, targetLevel2, last_bar_index + 5, targetLevel2, color = color.blue, width = 2,force_overlay=true) targetLine3 := line.new(bar_index, targetLevel3, last_bar_index + 5, targetLevel3, color = color.blue, width = 2,force_overlay=true) // Set the newLinesDrawn flag to true newLinesDrawn := true // Draw new labels with three decimal places stopLossLabel := label.new(last_bar_index + 5, stopLossLevel, 'Stop Loss: ' + str.tostring(stopLossLevel, '#.###'), style = label.style_label_left, color = color.red, textcolor = color.white,force_overlay=true) entryLabel := label.new(last_bar_index + 5, close, 'Entry: ' + str.tostring(close, '#.###'), style = label.style_label_left, color = color.green, textcolor = color.white,force_overlay=true) targetLabel1 := label.new(last_bar_index + 5, targetLevel1, 'Target 1: ' + str.tostring(targetLevel1, '#.###'), style = label.style_label_left, color = color.blue, textcolor = color.white,force_overlay=true) targetLabel2 := label.new(last_bar_index + 5, targetLevel2, 'Target 2: ' + str.tostring(targetLevel2, '#.###'), style = label.style_label_left, color = color.blue, textcolor = color.white,force_overlay=true) targetLabel3 := label.new(last_bar_index + 5, targetLevel3, 'Target 3: ' + str.tostring(targetLevel3, '#.###'), style = label.style_label_left, color = color.blue, textcolor = color.white,force_overlay=true)if downTrend and count_down == 1 // Clear previous lines and labels line.delete(stopLossLine) line.delete(entryLine) line.delete(targetLine1) line.delete(targetLine2) line.delete(targetLine3) label.delete(stopLossLabel) label.delete(entryLabel) label.delete(targetLabel1) label.delete(targetLabel2) label.delete(targetLabel3) // Draw new lines 5 bars into the future stopLossLine := line.new(bar_index, stopLossLevel, last_bar_index + 5, stopLossLevel, color = color.red, width = 2,force_overlay=true) entryLine := line.new(bar_index, close, last_bar_index + 5, close, color = color.green, width = 2,force_overlay=true) targetLine1 := line.new(bar_index, targetLevel1, last_bar_index + 5, targetLevel1, color = color.blue, width = 2,force_overlay=true) targetLine2 := line.new(bar_index, targetLevel2, last_bar_index + 5, targetLevel2, color = color.blue, width = 2,force_overlay=true) targetLine3 := line.new(bar_index, targetLevel3, last_bar_index + 5, targetLevel3, color = color.blue, width = 2,force_overlay=true) // Set the newLinesDrawn flag to true newLinesDrawn := true // Draw new labels with three decimal places stopLossLabel := label.new(last_bar_index + 5, stopLossLevel, 'SL: ' + str.tostring(stopLossLevel, '#.###'), style = label.style_label_left, color = color.red, textcolor = color.white,force_overlay=true) entryLabel := label.new(last_bar_index + 5, close, 'Entry: ' + str.tostring(close, '#.###'), style = label.style_label_left, color = color.green, textcolor = color.white,force_overlay=true) targetLabel1 := label.new(last_bar_index + 5, targetLevel1, 'TP 1: ' + str.tostring(targetLevel1, '#.###'), style = label.style_label_left, color = color.blue, textcolor = color.white,force_overlay=true) targetLabel2 := label.new(last_bar_index + 5, targetLevel2, 'TP 2: ' + str.tostring(targetLevel2, '#.###'), style = label.style_label_left, color = color.blue, textcolor = color.white,force_overlay=true) targetLabel3 := label.new(last_bar_index + 5, targetLevel3, 'TP 3: ' + str.tostring(targetLevel3, '#.###'), style = label.style_label_left, color = color.blue, textcolor = color.white,force_overlay=true)// Trigger alert when squeeze is releasedif sqzOff and not sqzOff[1] // Only trigger alert if the squeeze was previously on alert('Squeeze Release : '+ syminfo.tickerid + ' | ' + timeframe.period, alert.freq_once_per_bar)if segitigaDown[2] and not segitigaDown // Only trigger alert if the squeeze was previously on alert('Weak Trend or Reverse : '+ syminfo.tickerid + ' | ' + timeframe.period, alert.freq_once_per_bar)if segitigaUp[2] and not segitigaUp // Only trigger alert if the squeeze was previously on alert('Weak Trend or Reverse : '+ syminfo.tickerid + ' | ' + timeframe.period, alert.freq_once_per_bar)// Plot momentum strength/directionplotarrow(dir, 'Momentum Strength/Direction', color.new(color.aqua, 75), color.new(color.orange, 75), show_last = 500,force_overlay=true)plot(components ? bbUpper : na, 'BBUpper', color.new(color.blue, 25), show_last = 500,force_overlay=true)plot(components ? bbLower : na, 'BBLower', color.new(color.blue, 25), show_last = 500,force_overlay=true)plot(components ? kcUpper : na, 'KCUpper', color.new(color.red, 25), show_last = 500,force_overlay=true)plot(components ? kcLower : na, 'KCLower', color.new(color.red, 25), show_last = 500,force_overlay=true)// Alert for trend change when new lines and labels are drawnif newLinesDrawn trendType = upTrend ? "Buy" : "Sell" stopLossValue = str.tostring(stopLossLevel, '#.###') entryValue = str.tostring(close, '#.###') targetValue1 = str.tostring(targetLevel1, '#.###') targetValue2 = str.tostring(targetLevel2, '#.###') targetValue3 = str.tostring(targetLevel3, '#.###') alertMessage = 'Pair : ' + syminfo.tickerid + ' | ' + timeframe.period + '\n' + 'Trend : ' + trendType + '\n' + 'SL : ' + stopLossValue + '\n' + 'Ent : ' + entryValue + '\n' + 'TP1 : ' + targetValue1 + '\n' + 'TP2 : ' + targetValue2 + '\n' + 'TP3 : ' + targetValue3 alert(alertMessage, alert.freq_once_per_bar_close) // Reset the newLinesDrawn flag newLinesDrawn := false// ==========================================================================================// === Dashboard with Telegram Link ===var table myTable = table.new(position.top_center, 1, 1, border_width=1, frame_color=color.black, bgcolor=color.white)// Add Telegram Message to Dashboard//table.cell(myTable, 0, 0, "Join Telegram t.me/cryptomena1", bgcolor=color.blue, text_color=color.white, text_size=size.normal)
Disclaimer
Any content and materials included in Sahmeto's website and official communication channels are a compilation of personal opinions and analyses and are not binding. They do not constitute any recommendation for buying, selling, entering or exiting the stock market and cryptocurrency market. Also, all news and analyses included in the website and channels are merely republished information from official and unofficial domestic and foreign sources, and it is obvious that users of the said content are responsible for following up and ensuring the authenticity and accuracy of the materials. Therefore, while disclaiming responsibility, it is declared that the responsibility for any decision-making, action, and potential profit and loss in the capital market and cryptocurrency market lies with the trader.