
Ryan_Lewis1
@t_Ryan_Lewis1

What symbols does the trader recommend buying?
Purchase History
پیام های تریدر
Filter
تحلیل 4 بعدی: حمایت بیت کوین از کف جدید؛ آیا وقت خرید است؟

1.Macroeconomic Environment: Rate Cut Expectation Pullback Doesn’t Alter Dovish FundamentalsWhile the probability of a Fed rate cut in December has fallen from 90% to 68%, the implicit easing trend remains unbroken. The sell-off in risk assets triggered by the short-term strength of the US dollar index has entered its final phase. Bitcoin’s correlation with gold has dropped to a historical low of -0.54, highlighting asset independence as it no longer fluctuates solely with traditional safe-haven assets. Current valuations have pulled back over 20% from historical highs, and the enhanced attractiveness after bubble squeezing creates conditions for capital inflows. 2.Technical Pattern: Double Bottom Formation + Gap Support Build a Safety CushionA dense order zone has formed on the daily chart between $98,100 and $102,000, jointly constructing a preliminary double bottom pattern with the current price of $103,100. The 4-hour chart shows price has pulled back to the lower edge of the previous consolidation range, with an unfilled CME gap between $103,100 and $104,000 creating a technical resonance effect of gap filling and support. The RSI indicator has retreated from the overbought zone to neutral territory, while MACD green bars are contracting, indicating fading bearish momentum. 3.Capital Flow: ETF Outflows Peak + Institutions Deploy Against the TrendThe outflow trend of Bitcoin ETF funds is easing. After the previous withdrawal of $2 billion, selling pressure has been significantly released. Recent trading volume has remained above $50 billion, reflecting ample market liquidity. Selling pressure from whale holders is nearing an end, while institutional investors are deploying against the pullback. Asset management giants like BlackRock maintain core positions, and Coinbase data shows institutional capital inflows have rebounded to 32% of total volume. 4.Supply-Demand Structure: Halving Effect Combined with On-Chain Tightening Provides SupportAfter the 2024 halving, Bitcoin’s daily output dropped to 900 coins, while daily demand from spot ETFs remains high, forming a sustained supply-demand gap. On-chain data shows illiquid supply accounts for 65%, exchange balances continue to decline, and selling pressure from long-term holders has exhausted—providing fundamental support for price stability. Bitcoin trading strategy buy:102000-103000 tp:104000-105000 sl:101000Bitcoin Long Position Trading Strategy
تحلیل طلای امروز: سطح کلیدی ۴۱۲۰؛ طلا تا کجا اوج میگیرد؟

Structural Support: The upward trend of gold price starting from 4000 has not changed. It forms a "higher low point + higher high point" step-like structure. Currently, the 4126 USD has stabilized at the support level transformed from the previous resistance (in the range of 4115-4120), and the pullback has not broken the 5-hour moving average, which conforms to the characteristic of "retracement to the moving average is support" in a strong trend; meanwhile, the small-level c-wave starting from 4086 has exceeded the 100% target level of 4120, and the short-term technical target points to the 123.6% position of 4148. The structure and target form resonance. Momentum Signal: The 4-hour MACD continues to operate above the zero axis. Although the red bar has contracted, there is no "shortening of the red bar + new high price" top divergence. The DIFF line and DEA line maintain a bullish arrangement; RSI (14) rises to around 68, which is in the "unoverbought state of the strong range", and the rebound momentum has not been overdrawn. There is still upward space for the short term. Key Price Levels: The lower 4115-4120 is the "resistance transformation support + 5-hour moving average" resonance zone, and 4100 is the trend life line; the upper 4148 is the target position of the small-level c-wave, and 4160 is the previous emotional high point suppression. A breakthrough will open up a larger upward space. Today's gold trading strategy buy:4110-4120 tp:4130-4140 sl:4095
خرید طلا: استراتژی صبر برای ورود به موقع (کفسازی + سیگنال فاند)

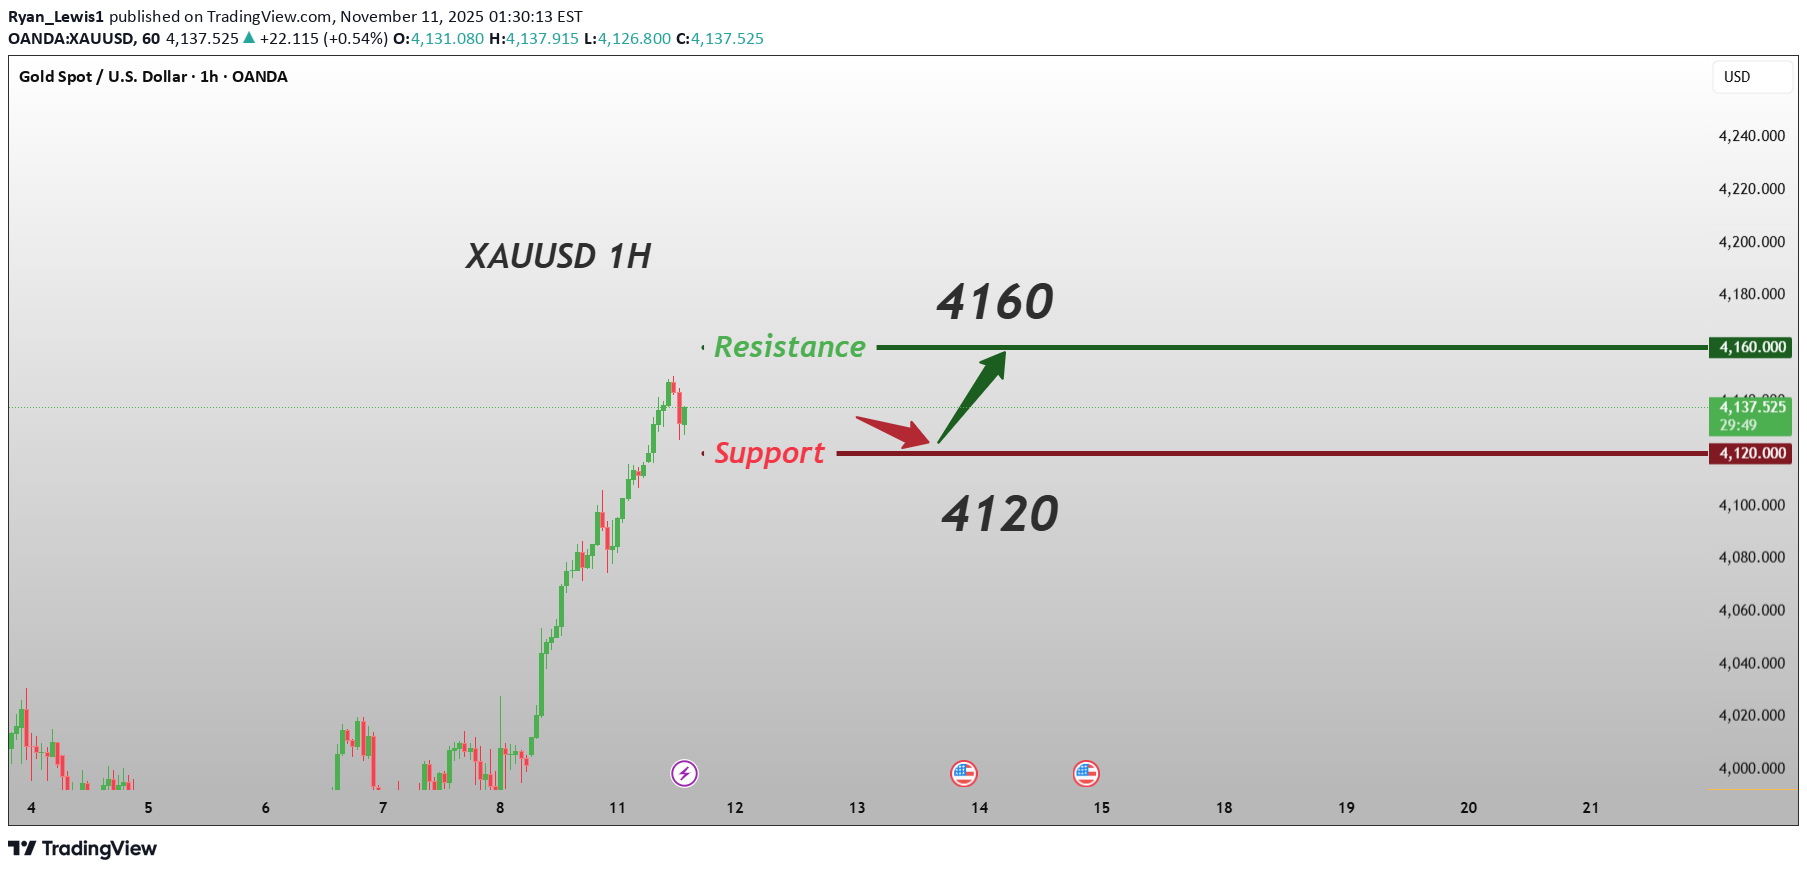
Signals in the divergence: "Let the market prove that the bulls are dominant on their own" The core of the battle between bulls and bears after reaching a new high is "who will give in first". Blindly going long at the 4140 level directly is vulnerable to being deceived by "false breakthroughs" or "short-term corrections". Therefore, the core principle for going long is: abandon predicting the end point of the divergence and only enter when "support stabilizes + fund signals" appear. Avoid the uncertainty risks during the divergence period and let the market "verify" the upward momentum on its own. Today's gold trading strategy buy:4125-4135 tp:4145-4165 sl:4115
حمایت طلای 4120: سیگنال خرید قوی در بحبوحه نوسانات بازار!
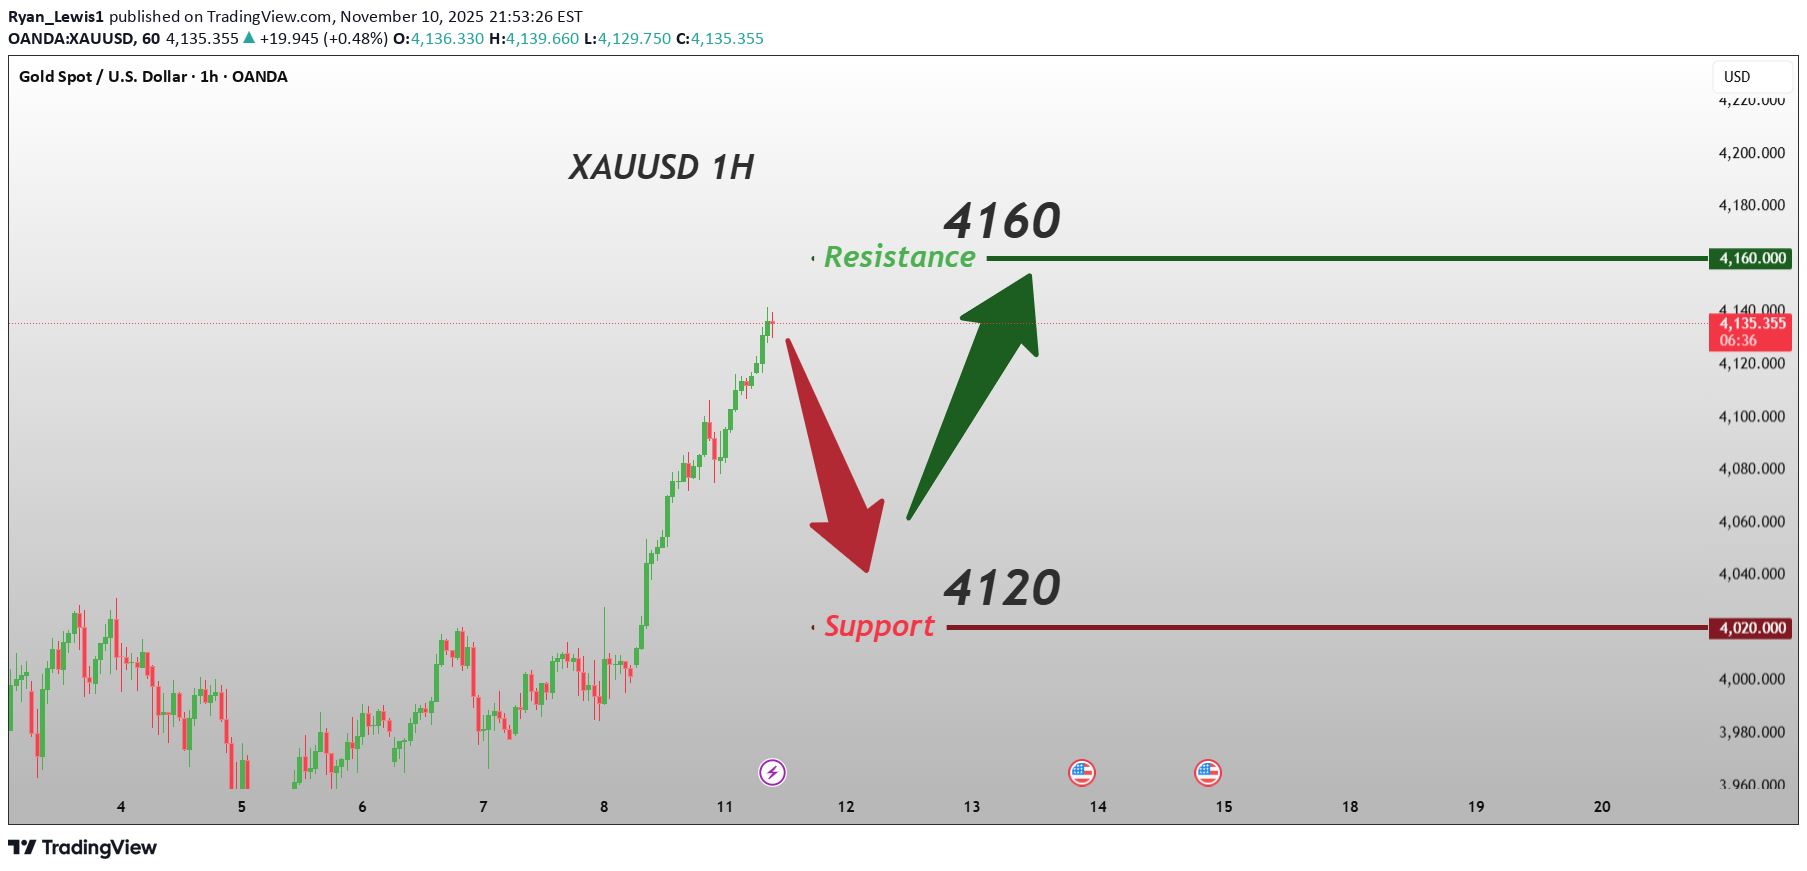
Policy and Funds Form "Hard Support": Although there are profit-taking sell-offs after new highs, the general direction of the Fed's easing cycle has not changed (core inflation is approaching the target, the labor market is cooling), the downward trend of real interest rates has not reversed, and in addition to the "rigid demand" from global central banks purchasing gold (monthly by emerging market central banks has not stopped), the 4120-4125 range has become a "strong support amid disagreements", with a probability of less than 15%, providing a clear safety margin for going long. Hedging Demand "Has Elasticity": Although the conflict in the Middle East has not escalated yet, shipping safety risks (decreased vessel traffic in the Strait of Hormuz) and potential "risk points" before the US election (political games) have not disappeared. Once a risk event emerges amid the disagreements, it is likely to trigger "short covering + following the trend to go long", quickly resolving the disagreements and pushing the gold price to a new high. Today's gold trading strategy buy:4120-4130 tp:4140-4160 sl:4110
راهنمای استراتژی بلندمدت بیت کوین: فرصتهای خرید در سایه تضعیف دلار و تسهیل نقدینگی
Reconstruction of the macro monetary environment provides support The US dollar index has dropped below the 100 mark. The US debt/GDP ratio exceeding 130% has weakened the creditworthiness of the US dollar, providing valuation support for risky assets. Although expectations for the Fed's rate cut in December have fluctuated, the trend of implicit liquidity easing has not changed, reducing the opportunity cost of holding Bitcoin. At the same time, the global central bank gold-buying trend highlights the need for hedging, and the high correlation of Bitcoin with the Nasdaq index of 0.8 will benefit from the return of funds from the technology sector simultaneously. Bitcoin trading strategy buy:105000-105500 tp:106500-107500 sl:104000Open up the long-term upward channelThe entry point for the strategy has been reached. Let's all keep an eye on how the trend develops.
طلا در مسیر صعود: چرا اکنون بهترین زمان برای خرید است؟
Geopolitical and policy factors jointly drive the situation: The global geopolitical situation has intensified, the conflict in the Middle East continues to boost the demand for safe-haven assets, and the shipping risks in the Strait of Hormuz further enhance the crisis hedging attribute of gold. Although the Federal Reserve has slowed down the pace of interest rate cuts, the general direction of the easing cycle has not changed. The expectation of a downward trend in real interest rates has reduced the cost of holding gold, providing a bottom support for the price. Long-term support from the capital market: Central banks around the world are showing a strong enthusiasm for purchasing gold. Nearly 90% of the surveyed central banks expect to continue increasing their gold holdings in the next 12 months. Central banks in emerging markets have an especially strong desire to increase reserves, continuously injecting long-term momentum into the gold price. The inflow of funds into gold ETFs is significant, and coupled with the rise in domestic and international prices, institutional funds recognize the current trend. Technical trend momentum continues: After breaking through the historical key resistance, the price forms a strong pattern of volume and price coordination. The decline after reaching a new high is limited, and the short-term trend momentum has not diminished. No signal of energy decay has appeared yet, which is in line with the "stronger always stronger" breakout logic. Today's gold trading strategy buy:4140-4160 tp:4120-4130 sl:4110
پایان تعطیلی دولت آمریکا: بیت کوین به اوج رسید و مسیر صعودی ادامه دارد!
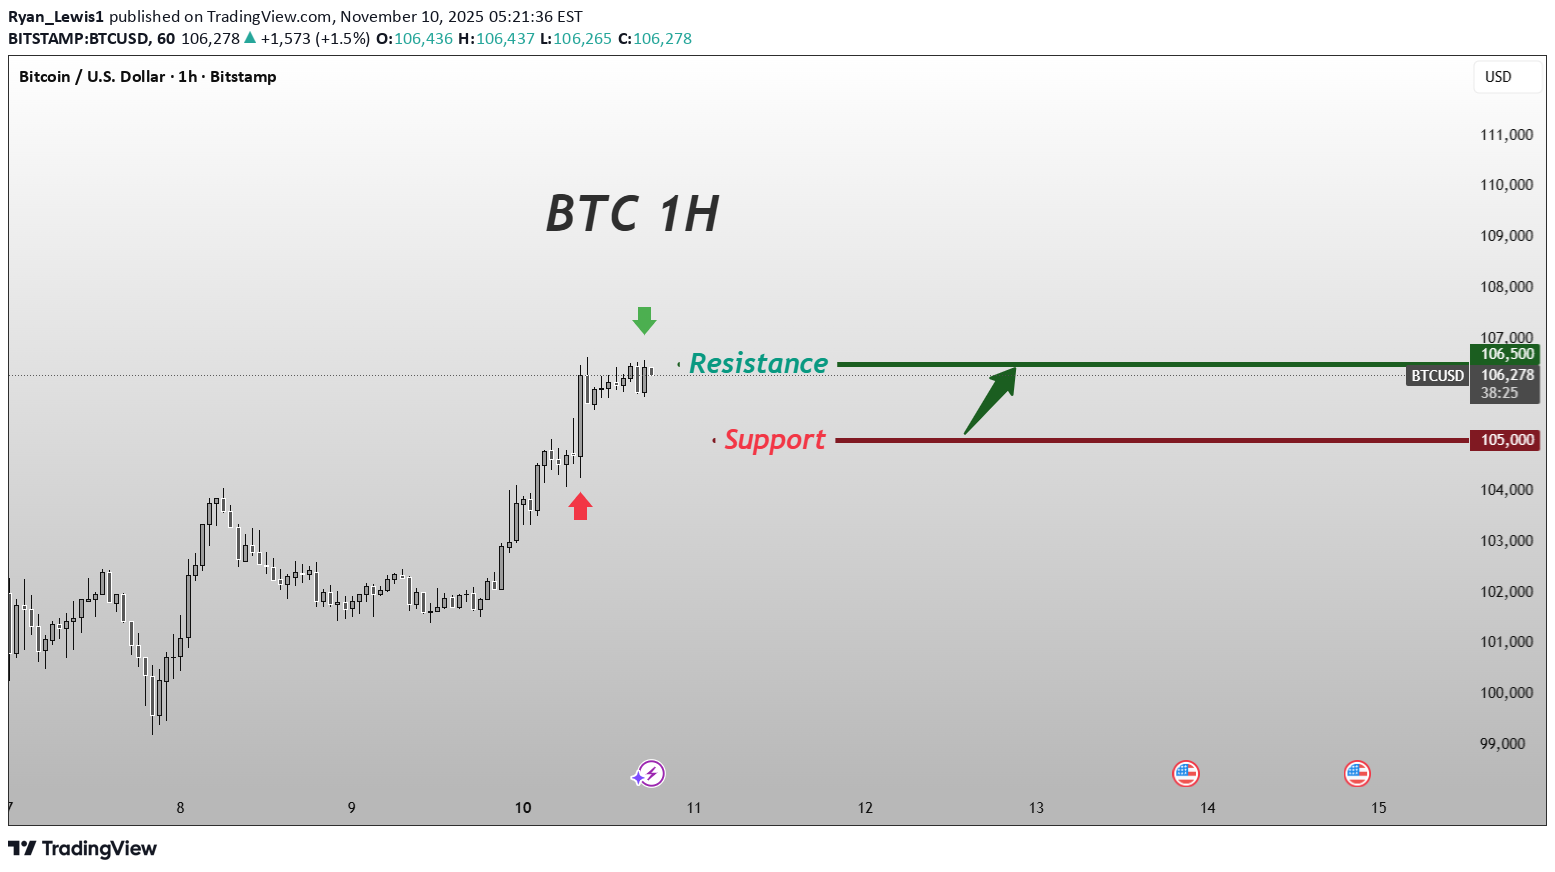
The US Senate has reached an agreement to end the federal government's "shutdown", extending the funding until January 30th next year. This shutdown had led to a tightening of liquidity in the money market, and with the agreement reached, TGA funds will be gradually released, directly improving the market liquidity environment. As a risk asset sensitive to liquidity, Bitcoin has responded first, breaking through the $106,000 whole number level. The expectation of loose liquidity will continue to provide upward momentum in the future. At the same time, the market expects a higher probability of the Fed cutting interest rates in December, further reducing the opportunity cost of holding Bitcoin. Bitcoin trading strategy buy:105000-105500 tp:106000-106500 sl:104000
دلار آمریکا رکورد زد: آیا سیاستهای فدرال رزرو زمینه ساز طلا هستند؟
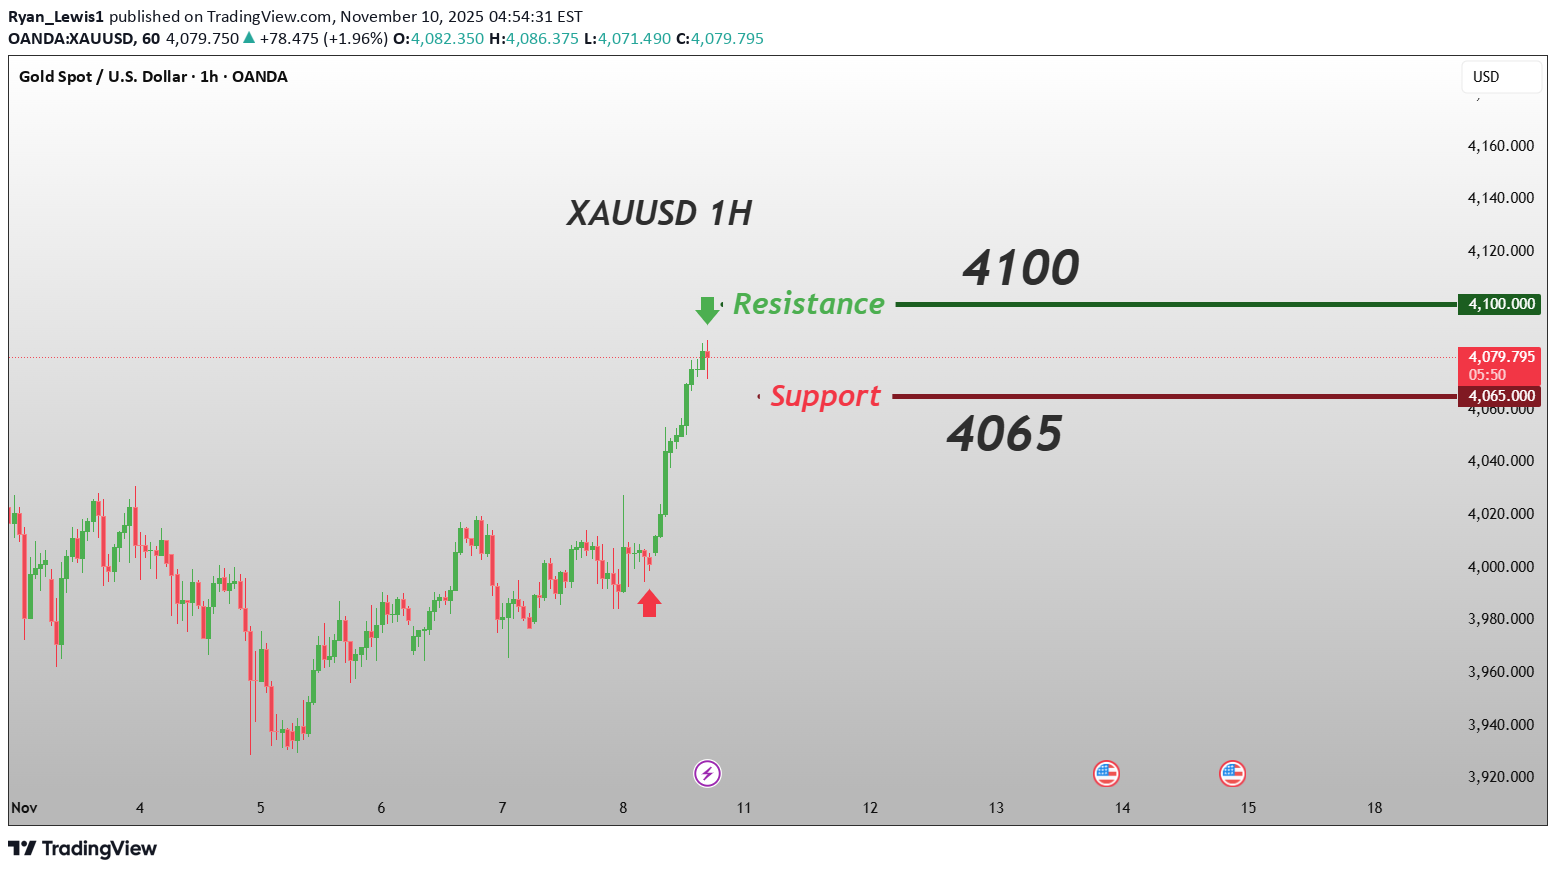
Recent economic data in the United States have shown a "weak recovery" feature - the labor market has cooled down (new job creation is lower than expected, the unemployment rate has slightly risen), consumer confidence index has declined, and core inflation is approaching the target range. As a result, the market's expectation for the Fed to cut interest rates in December has been further strengthened. Although there are still differences in policy statements, the broad direction of monetary easing has not changed. This provides "a bottom for the decline" for gold prices, significantly reducing the risk of a major correction. Today's gold trading strategy buy:4065-4075 tp:4080-4100 sl:4055
آربیتراژ نوسانی بیت کوین: راز کسب سود در نوسانات محدود قیمت!
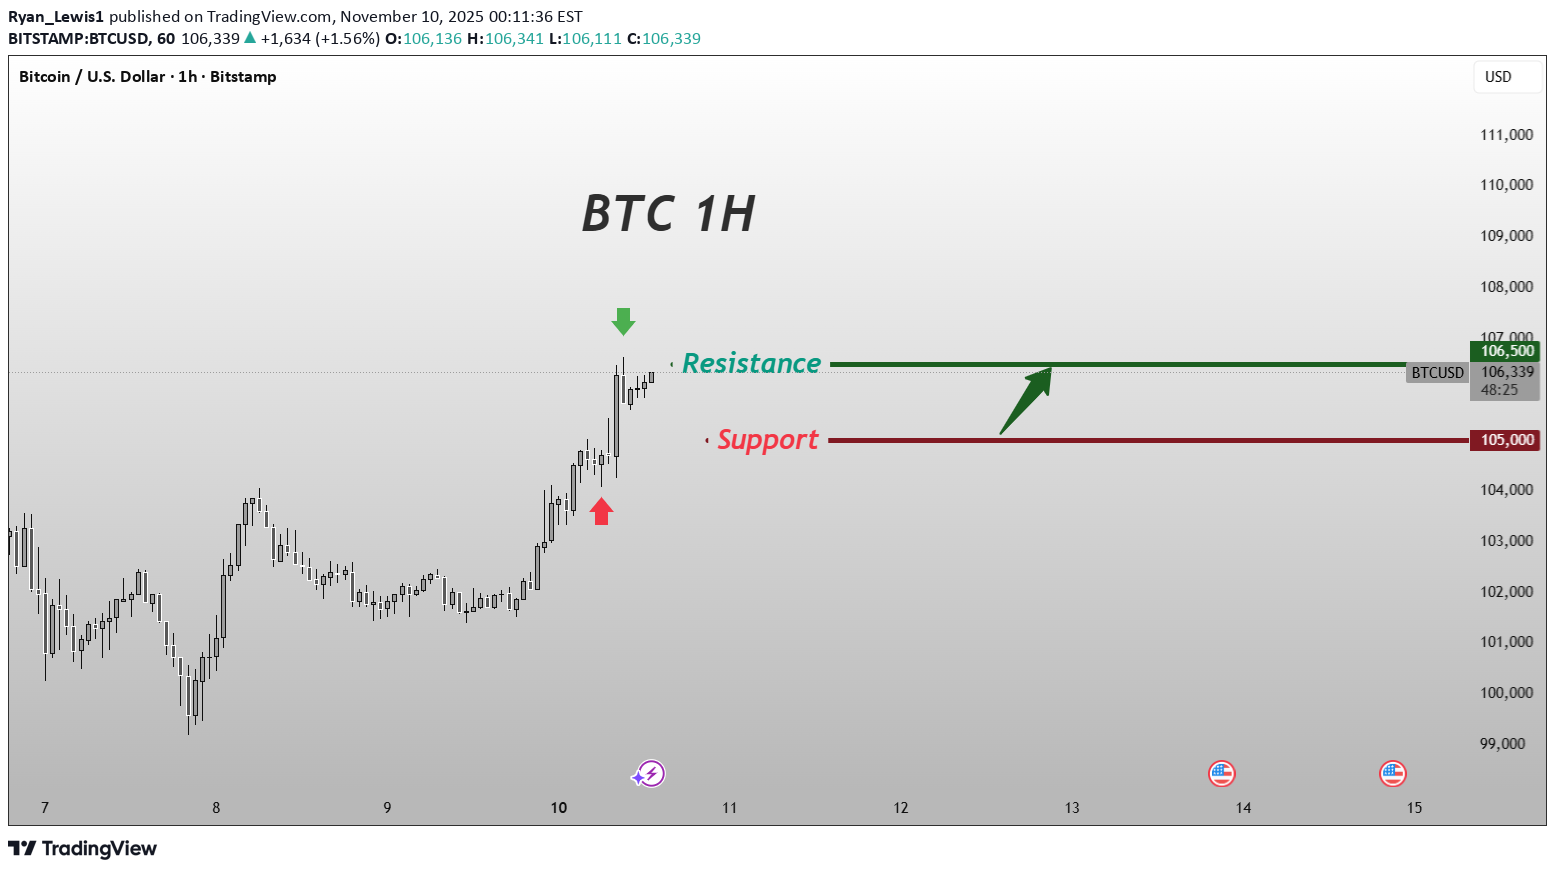
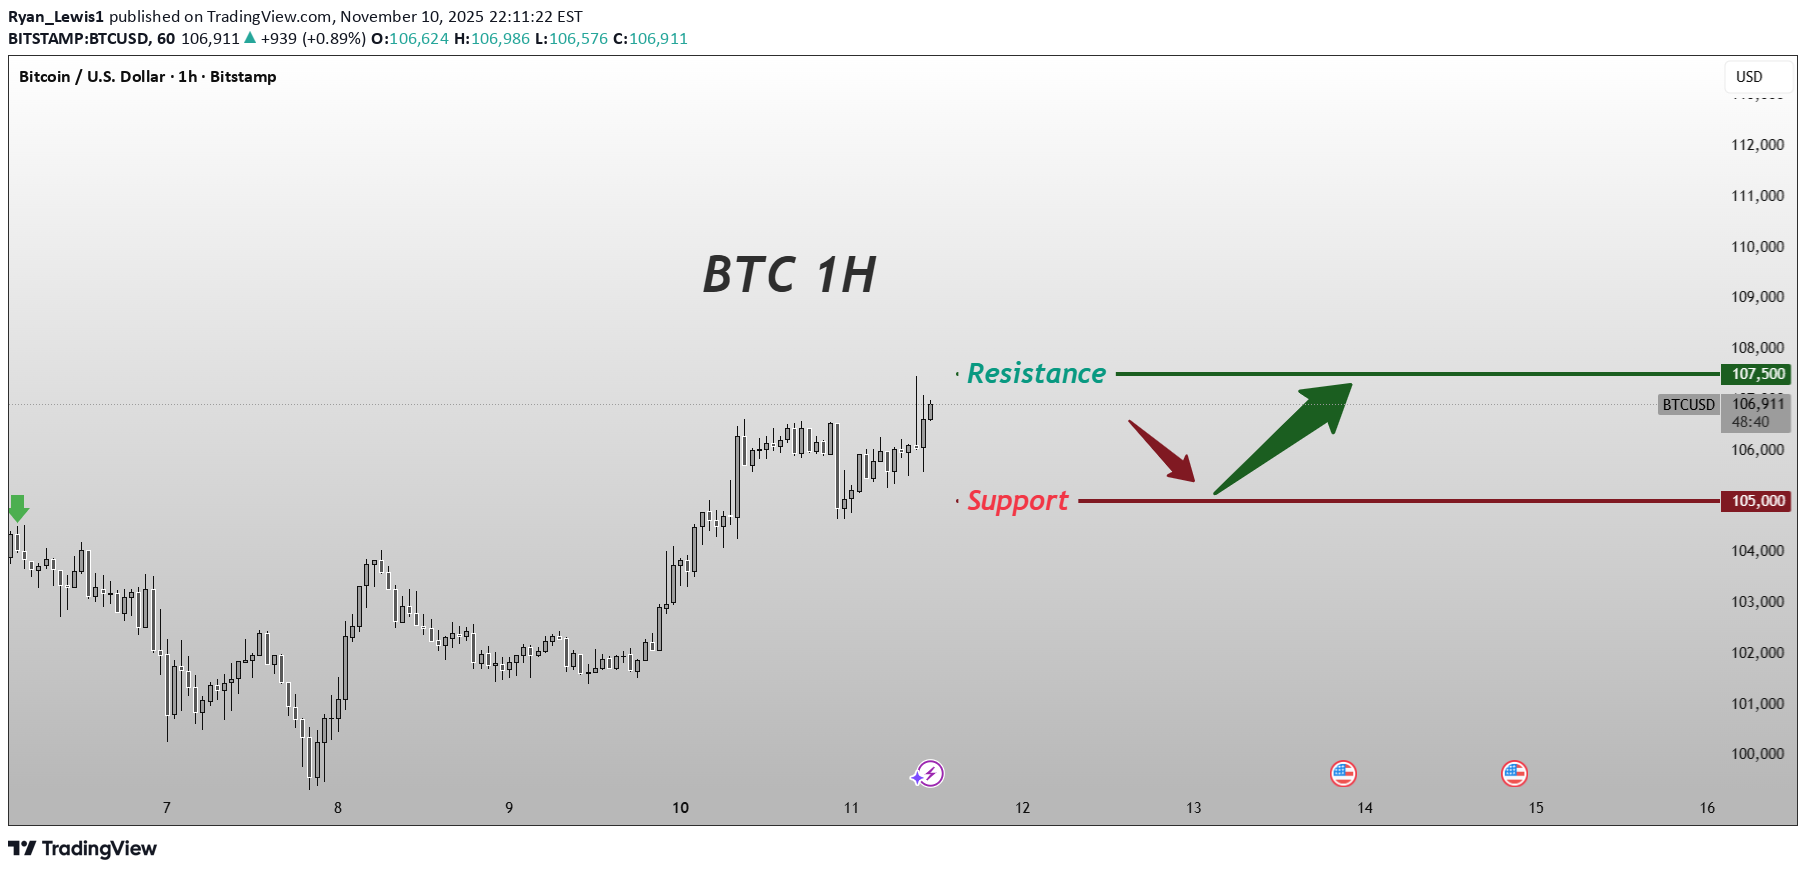
Currently, the price of Bitcoin at $106,257 is within a short-term oscillation range of "clear support - clear resistance - balanced momentum". The strong support at $105,000 - $105,500 and the high resistance at $106,000 - $106,500 form a natural arbitrage space. The lack of incremental capital, the digestion of macro benefits, and the bias towards long-term positioning by institutions have further strengthened the rationality of the range trading. The core of trading lies in "precisely anchoring the boundary of the range + batch buying and selling + strict stop-loss". By confirming the entry timing through technical signals, verifying the validity of the range through capital data, and controlling risks with scientific position management. For international analysts, the key to this strategy lies in real-time tracking of the price feedback and capital movements at the range boundaries, locking in certain arbitrage gains in the oscillating pattern, while also being vigilant against sudden risks of range breakouts, and ensuring the flexibility and discipline of strategy execution. Bitcoin trading strategy buy:105000-105500 tp:106000-106500 sl:104000
سه دلیل اصلی برای خرید طلا و نگه داشتن آن (پشتیبانهای کیفی قدرتمند)
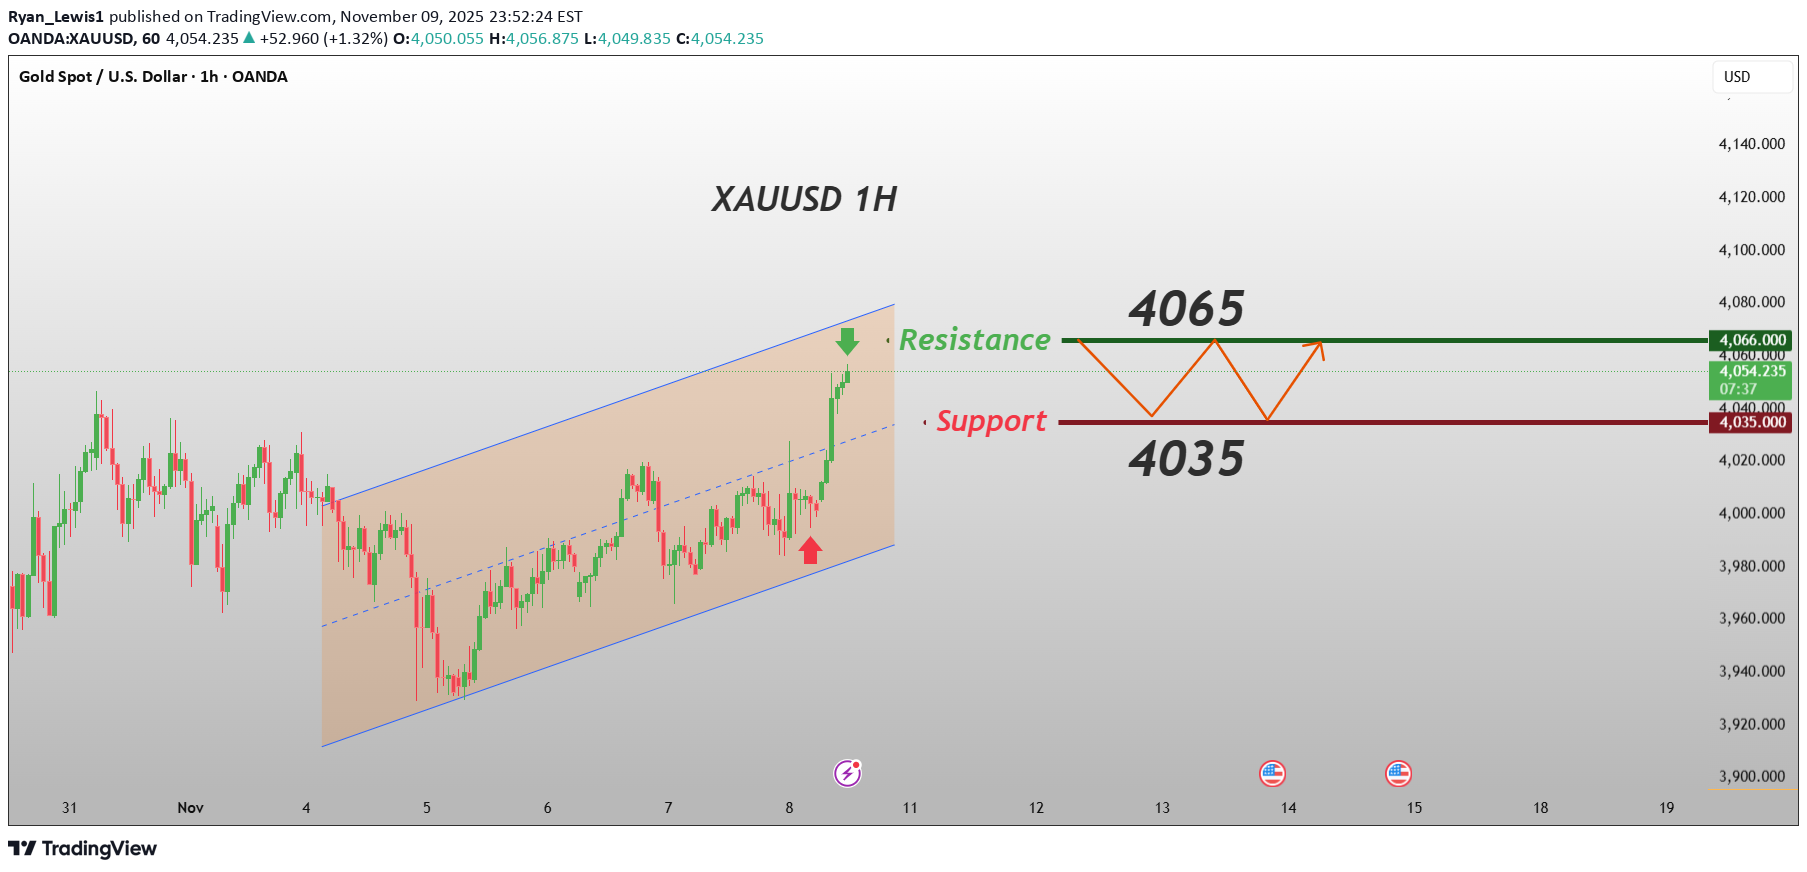
Policy environment provides a safety cushion: The general direction of the Fed's easing cycle has not changed, and market expectations for subsequent interest rate cuts remain stable. The key support level formed earlier (around 4056 US dollars) is highly effective, and the possibility of a significant short-term correction is relatively low, providing bottom protection for the long position. Funds situation shows positive signals: The futures market forms a positive premium for the spot price, reflecting the active layout intentions of the bulls; Global mainstream gold ETFs have ended their previous reduction and show signs of capital inflow, the recognition of the current price level by institutions has increased, further strengthening the support. Technical patterns confirm the continuation of the trend: The gold price successfully broke through the upper edge of the previous consolidation range, and the breakout was accompanied by a significant increase in trading volume, which conforms to the strong feature of "volume-price correlation", the short-term trend inertia is still ongoing, and no signal of energy decay has appeared yet. Today's gold trading strategy buy:4035-4045 tp:4055-4065 sl:4020
Disclaimer
Any content and materials included in Sahmeto's website and official communication channels are a compilation of personal opinions and analyses and are not binding. They do not constitute any recommendation for buying, selling, entering or exiting the stock market and cryptocurrency market. Also, all news and analyses included in the website and channels are merely republished information from official and unofficial domestic and foreign sources, and it is obvious that users of the said content are responsible for following up and ensuring the authenticity and accuracy of the materials. Therefore, while disclaiming responsibility, it is declared that the responsibility for any decision-making, action, and potential profit and loss in the capital market and cryptocurrency market lies with the trader.