
Gold_Digger_King
@t_Gold_Digger_King

What symbols does the trader recommend buying?
Purchase History
پیام های تریدر
Filter
Gold_Digger_King
Gold short-term trading strategy

https://www.tradingview.com/x/XA8Y4Ya9/ Gold is approaching our awaited price target of $2,260.60, which is the 50% Fibonacci retracement of gold’s rise from $1,984.16 to $2,431.44. This means that if the price of gold falls below $2260.60, the price of gold will continue its bearish trend and aim for the next target of $2207.80 On the other hand, we noticed that the trend of gold prices showed a downward trend, which supported the expectation that gold prices would continue to decline and hit more bearish targets. In particular, the 50-period EMA formed continued bearish pressure. Therefore, unless gold rebounds above $2,325.90 and remains above this level, we will continue to predict that gold prices will be in a bearish trend for some time to come. Gold prices are expected to trade today at the support level of $2,260.00 and the resistance level of $2,305.00. The expected trend for gold prices today is bearish. It is recommended to short gold near $2,300 I share trading strategies and trading ideas every day. ⬇⬇⬇Get detailed trading signals so that everyone is no longer confused when trading. I hope that with my help, everyone can get good results!The price of gold is now above US$2,300 and has not yet exceeded US$2,305. At this time, you can short gold.U.S. April ISM Manufacturing PMI Previous value 50.3 Expected 50 Announcement 49.2Although the data is good for gold, there is pressure from above. A more appropriate trading strategy is to short gold at high prices after gold rises. If gold can rise to the range of 2315-2320 US dollars, short goldThe price of gold did not rise steadily after breaking through the $2,310 level, and is falling back under pressure from above.
Gold_Digger_King
Gold trading strategy analysis

https://www.tradingview.com/x/2gFUVdjd/ Recently, there have been a lot of bearish calls in the market. The louder the calls, the stronger the rally. The two important functions that affect the price trend of gold are risk aversion and resistance to inflation. First, the relationship between supply and demand. Global gold mining and supply have stabilized, with market supply exceeding demand and prices falling. Second, economic factors: global economic growth is slowing down and demand for bulk commodities is weakening. U.S. data continued to rebound, consumption was weak, and global risk assets suffered a sell-off. This is especially true as Cyprus plans to sell off its gold reserves, sparking concerns that other countries may follow suit. Well-known international investment banks such as Goldman Sachs and Merrill Lynch began to collectively lower their expectations for gold prices, causing investors to sell in panic. For today's gold on Tuesday, the price fell below the ascending channel line and finally rebounded to determine the resistance area 2330-2332. This is a defensive suppression range and continued suppression is effective. If the price falls below the 2315-2312 area, if it falls below, then look for Go to the next 2303-2300 area, and then look for the 2388 and 2366 ranges The next thing to do is to use the top of the starting and falling points as a defense, and then continue to hold gold high, watch the price accelerate to test the 2315-2312 area, and switch the range downwards if the position is broken. My suggestion is to go short around $2320-2310, with a stop loss of $2335 and a target of $2302-2300. I share trading strategies and trading ideas every day. ⬇⬇⬇Get detailed trading signals so that everyone is no longer confused when trading. I hope that with my help, everyone can get good resultsThe price of gold fell as low as $2,310 and now has a short rebound. We can short gold above $2,320.It is a pity that the price of gold has not reached the expected entry point. We can wait for a while.Gold has now fallen below $2,310.Gold continued to fall and once fell to the level of $2,305The price of gold fell sharply to around US$2,303 to see if it can fall below the US$2,300 level.Gold manages to break below $2,300 levelAfter gold successfully fell below the $2,300 level, it did not rebound above $2,300Gold prices continue to trade below $2,300Did you take my advice and make a profit in today's gold trading?Gold has fallen all the way to the level of $2,280. The downward trend is obvious. Be cautious in going long gold.
Gold_Digger_King
Gold bull market will continue

https://www.tradingview.com/x/L3VELXdC/ Gold has experienced a unilateral rise in the recent bull market, and finally reached a new all-time high and was blocked near 2430. Then it ushered in a collapse and fell back, with the lowest falling to around 2290 to be supported. However, the decline has not been well extended and has not continued to fall, indicating that there is still a large amount of buying support below. At the end of last week, the price fluctuated and slowly rose to around 2354. The callback low began to slowly move upward, and it held the 2330 mark at the end. There is a possibility for bulls to make a comeback. Gold fluctuated and slowly rose to around 2354 last Friday, the correction low began to slowly move upward, and ended up holding the 2330 mark. 2430 is a clear peak, and the 2400 mark has not been successfully surpassed by multiple shocks. Now it is poised to collapse from high levels and fall back, and the decline is expected to continue. However, since the bulls are still in a bull market, there is still a large amount of buying support, and further declines will require the bulls to digest the momentum. Next, we will see whether this rebound can stabilize the 2355 watershed. Once it stabilizes, there will be no advantage in shorting. Today we will focus on the support near 2325. If it stabilizes the 2330 mark, then we will see a rebound. Gold Strategy: Go long near $2,325 Stop loss $2310 Target $2335-2345 I share trading strategies and trading ideas every day. ⬇⬇⬇Get detailed trading signals so that everyone is no longer confused when trading. I hope that with my help, everyone can get good results!Friends, after experiencing a wave of rise, the price of gold is now under pressure from above at 2340-2345 US dollars. It has not continued to break upward to last week's high of 2352 US dollars. It is also showing a downward trend. Now we can wait until 2320-2325. At the support level of the US dollar range, observe the market trend before trading. If it does not fall below US$2,320, we can go long gold.Gold fell above $2,325 and was supported below. We can wait until the $2,325-2,320 range to make long positions.Gold rebounded and rose to $2,340 before falling under pressureGold prices are now above $2,340Gold has not yet exceeded $2,350. We can short gold above $2,350.Now that gold is falling and short sellers are making profits, we can go long gold again below $2,330.Waiting to go long gold below $2,330Gold prices go long gold near $2,325Gold continues to fall and has fallen below $2,320. We should trade cautiously now
Gold_Digger_King
Analysis of gold trend outlook

https://www.tradingview.com/x/lhyAZSRg/ The fundamental outlook for gold is less positive, as is its near-term technical price action. If gold prices close this month below $2,300 an ounce, Next week will be an important test for gold. This level has become an important pivot point. Gold appears to be overbought on the monthly chart, and a midweek close below $2,300 would cast a considerable shadow on the upside and potentially spell trouble for some bulls. Gold price action so far has been described as a healthy correction. The next major support level is expected to be around $2,255 an ounce. Staying above this level would send a signal to the market that the pullback is nothing more than a weak correction in a strong uptrend. While the Fed and Friday's non-farm payrolls report will be next week's two major economic events, there's still a lot of data coming out that will add to volatility next week. Still, the central theme remains the tug-of-war between economic growth and inflation. I share trading strategies and trading ideas every day. ⬇⬇⬇Get detailed trading signals so that everyone is no longer confused when trading. I hope that with my help, everyone can get good results!After the Asian market opened, it once hit a low of $2,322, with a drop of as much as $15. It then rebounded around $2,335. It encountered resistance above and has now fallen back to $2,328.
Gold_Digger_King
Gold trend analysis and trading advice

https://www.tradingview.com/x/zdUKw0kL/ The price of gold rose to a maximum of $2,352 today. It was hindered by resistance from above and could not continue to rise. Subsequently, it was affected by the annual rate of the core PCE price index in March and now maintains a downward trend. The market situation is changing rapidly, so it is particularly important to accurately judge the impact of the news and grasp the rhythm at this time. If an individual trades blindly, the probability of losing money will be very high. Only by grasping the market trend can you be invincible in trading. The latest important support and resistance levels for gold prices: Support level: $2310; $2295; Resistance: $2,361; $2,372 Trading operations: Go short after gold rebounds and go long after it falls. I share trading strategies and trading ideas every day. ⬇⬇⬇Get detailed trading signals so that everyone will no longer be confused when trading. I hope that with my help, everyone can achieve good results!Gold is currently supported below, and the U.S. dollar is now falling, which will provide some impetus for gold's rise.Gold has great resistance above the $2,350 level and is difficult to break through the 2,350-2,355 range. Therefore, we can conduct short trades above $2340-2345, which would be a good choice.Gold is now undergoing a shock adjustmentNow that the price of gold has risen above $2,340 again, you can short gold in this rangeGold prices fall, short sellers continue to make profitsGold prices closed at $2,338
Gold_Digger_King
Gold bottoms out and rebounds, long trade wins

https://www.tradingview.com/x/XF10EDSp/ Gold closed up $16.49, or 0.71%, on Thursday to close at $2,332.30. On April 26, spot gold accelerated its short-term rise, with the price just breaking through $2,345. Gold short-term technical outlook analysis U.S. first-quarter GDP data was lower than expected, causing concern. Gold maintained modest gains. Generally speaking, gold tends to benefit in a risk-averse environment, which tilts the risk to the upside. In the short term, gold prices offer a neutral to bullish stance based on the 4-hour chart. Gold prices currently face resistance at the April 25 high of $2,344. If this level is exceeded, gold prices will target the $2,352 level, followed by the $2,400 mark. The latest important support and resistance levels for gold prices: Support level: $2310; $2292; Resistance: $2352; $2368; Gold prices are expected to fluctuate and rise today. Trading strategy: Go short after gold rebounds and go long after it falls. It is recommended to go short near $2345-2350 Or going long near $2320-2310 is also a good choice. I share trading strategies and trading ideas every day. ⬇⬇⬇Get detailed trading signals so that everyone will no longer be confused when trading. I hope that with my help, everyone can achieve good results!The price of gold broke through 2350 US dollars, but did not continue to rise above 2352 US dollars. We can wait and see whether the market can continue to rise and break through 2352 US dollars. Then I can wait for the pullback and then go long gold.Gold rose to a maximum of $2,352, then fell back, showing a relatively strong trend. We can go long below $2,340.Wait a moment, the price of gold falls back below 2340 before trading long.Gold prices are now correcting as expected,The U.S. core PCE price index annual rate data in March was negative for gold, which briefly affected the market trend and is now falling rapidly towards $2,340.Gold is now down to $2337, we can go long gold at $2335Go long at the $2337 level. The impact of the final value of the University of Michigan Consumer Confidence Index in April in the United States is that bulls continue to make profits.The price of gold is currently fluctuating at $2337 and may fall further. You can increase your position below 2335 and go long.Gold is currently supported below, and the U.S. dollar is now falling, which will provide some impetus for gold's rise.We can take profit when it rises above 2340 and prepare for short tradingNow that the price of gold has risen above $2,340 again, you can short gold in this rangeGold prices fall, short sellers continue to make profits
Gold_Digger_King
Gold technical analysis and trading strategies

https://www.tradingview.com/x/GVrLWu3r/ Now that gold has exceeded $2,330, the release of data on the number of initial jobless claims in the United States for the week ending April 20 will have an impact on gold. After the data was released, the price of gold fluctuated rapidly. On Thursday, the United States will release preliminary data on first-quarter gross domestic product (GDP), which is expected to grow at an annualized rate of 2.5% in the three months to March. Gold prices are trading between the 20-period moving average and below the 100-period moving average, with the former accelerating below the latter, often seen as a signal of increasing selling pressure. Meanwhile, technical indicators remain negative, the momentum indicator is rising, and the relative strength index (RSI) is consolidating around 43. If gold prices break above $2,343.00, this will halt the bearish correction and push gold prices back to the main bullish trajectory. The latest important support and resistance levels for gold prices: Support levels: $2310.00; $2295.20; $2282.90 Resistance: $2343.30; $2361.55; $2372.90 Expectations for gold prices today are mostly mixed. Trading idea: Go short after gold rebounds and go long after it falls. I share trading strategies and trading ideas every day. ⬇⬇⬇Get detailed trading signals so that everyone will no longer be confused when trading. I hope that with my help, everyone can achieve good results!Gold prices are now rebounding higher after hitting a low of $2,313Go long below $2320, Bulls are profitingGold surged to $2,344 and has now fallen back to $2,330 levelsNow the price of gold has dropped to around $2325, and it is perfect to make a profit by shorting above 2340.The price of gold is now trading within a narrow range of $2,330. We can wait and see how the market changes before trading.The price of gold is rising steadily and can wait for it to reach a high point and fall back.Now that the market has closed, we can take a break and wait for the right opportunity to trade. Today's trading harvest is good, reaching 17K. I believe tomorrow will be better, come on!The price of gold is fluctuating nearby, and the upper limit of today's rise may exceed $2,345
Gold_Digger_King
Today’s Gold Up and Down Trading Strategy
https://www.tradingview.com/x/H8g9VtL4/ Gold technical prospects are analyzed.Spot gold suddenly fell to $2,305 in the short term and then rebounded to around $2,320. The near-term outlook for gold has turned neutral, with bulls seemingly unwilling to give up. On Thursday, the U.S. will publish preliminary first-quarter gross domestic product (GDP) data, which is expected to show annualized growth of 2.5% in the three months to March. Gold prices are trading between the 20-period SMA and Trading below the 100-period SMA, with the former accelerating below the latter, is often seen as a signal of increased selling pressure. Meanwhile, technical indicators remain negative, the momentum indicator is rising, and the Relative Strength Index (RSI) is consolidating around 43. If gold prices break through $2343.00, this will halt the bearish correction and push gold prices back to the main bullish trajectory. The latest important support and resistance levels for gold prices: Support levels: $2310.00; $2295.20; $2282.90 Resistance: $2343.30; $2361.55; $2372.90 Today's expectations for gold prices are mostly volatile. Trading idea: Trade short gold after a rebound, or trade long after a decline. I share trading strategies and trading ideas every day. ⬇⬇⬇Get detailed trading signals so that everyone is no longer confused when trading. I hope that with my help, everyone can get good results!Gold prices are now above $2,320, with some upside ahead of a pullback, where aggressive investors can go shortThe market trend is consistent with my prediction. Now the gold price has reached a relatively high level. You can add short positions here.Gold is currently oscillating within a narrow range around $2,325. We can now observe the market trend and then make a judgment for trading.Now that gold has exceeded $2,330, it has fallen below 2,330. The next trend will depend on the impact of the release of the number of initial jobless claims (ten thousand people) in the United States in the week to April 20 on gold.Data release is negative for gold, but market volatility is relatively large, so trade with caution
Gold_Digger_King
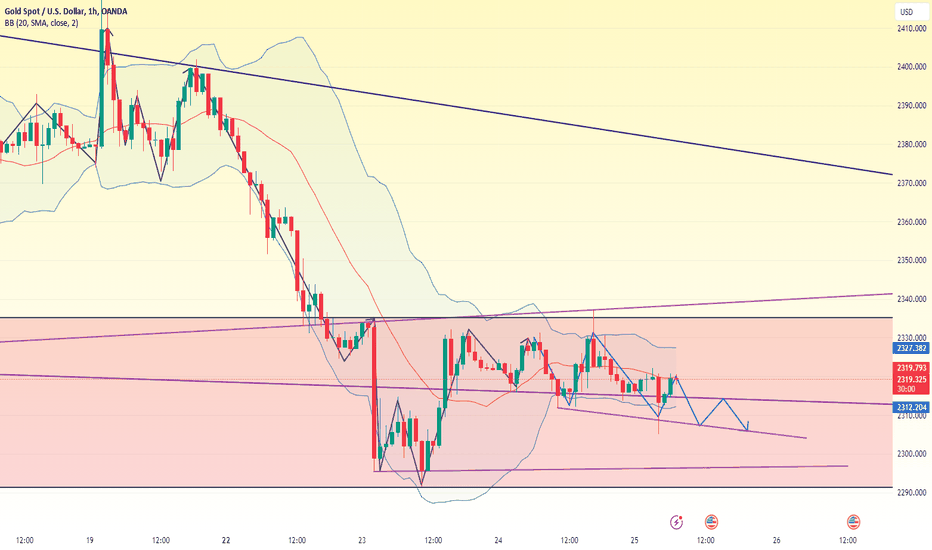
Gold trading strategies continue to be bearish

https://www.tradingview.com/x/4I0jyQXm/ Spot gold continued to rebound in the short term, with the price of gold once touching $2,330, climbing nearly $15 from the intraday low. It was always difficult to break through $2335 and then fell to around $2315. If gold prices want to reverse the downward trend upward, the outlook for gold prices remains bearish unless gold prices rebound above $2,343.00. Spot gold closed slightly down 0.2% on Tuesday at $2,322.03. Gold prices closed below $2,325.90 per ounce yesterday, which makes the corrective bearish trend still valid for some time to come. Currently waiting for gold prices to fall towards the next correction target of $2,280 per ounce. The stochastic indicator is currently sending a clear negative signal, which supports the return of gold prices to the expected decline. Additionally, the 50-period exponential moving average (EMA) is creating bearish pressure. It should be pointed out that if gold prices break through $2343.00, this will stop the bearish correction and push gold prices back to the main bullish trajectory. Gold prices today will be between the support level of $2,295.00 and the resistance level of $2,335.00. The expected trend for gold prices today is bearish. Trading idea: Trade short gold after the rebound I share trading strategies and trading ideas every day. ⬇⬇⬇Get detailed trading signals so that everyone is no longer confused when trading. I hope that with my help, everyone can get good results!Gold prices today will trade between support at $2,295.00 and resistance at $2,335.00.Gold is currently in a narrow range, and you can leave the market after making a profit of $10.Gold is now in a choppy declineGold has rebounded and is now at $2,327, where it can be tradedAfter the gold price shot up to US$2,337, it began to fall back to US$2,321. It was supported by the bottom and settled at US$2,324 for the time being.Now that gold is in a rebound trend, you can try to go long below 2325.You can take profit and leave the market promptly when you make a profit of 3-5 US dollars.Take a long trade at $2325 and have made $5 profitThe current trading strategy is to exit the market with a profit, which is the wisest approach.Gold is currently in a state of adjustment. We can wait and see for a while, and we can go long gold when it falls to a low point.We can go long below 2320 and leave the market promptly after making profit.Gold is currently in a slight decline and is about to bottom outGold has fallen from the highest point of 2337 US dollars to 2315 US dollars. There is still room for decline. Radicals can go long here.Gold has fallen from the highest point of 2337 US dollars to 2315 US dollars. There is still room for decline. Radicals can go long here.As I predicted, gold rebounded after hitting bottomNow that gold is bouncing higher, we can trade short above 2320The market trend is consistent with my prediction. Now the gold price has reached a relatively high level. You can add short positions here.Gold is currently oscillating within a narrow range around $2,325. We can now observe the market trend and then make a judgment for trading.Data release is negative for gold, but market volatility is relatively large, so trade with cautionGold prices are now rebounding higher after hitting a low of $2,313Gold surged to $2,344 and has now fallen back to $2,330 levelsThe price of gold is now trading within a narrow range of $2,330. We can wait and see how the market changes before trading.
Gold_Digger_King
Correct gold trading advice, winning is not about confusion

https://www.tradingview.com/x/HwgyLP3L/ friends The recent overall trend of gold in the market has shown a decline, but trading is also full of challenges. Opportunities and challenges coexist. Are you ready to meet your challenges? In my trading advice today, I emphasized the trading idea of shorting gold at high prices after a rebound. I wonder if you have adopted my trading idea in your trading and made a profit. If you followed my trading advice, you may have gained something. Taking advantage of opportunities to make profits in trading may not be so difficult after all. Now the price of gold has rebounded to around US$2,330 after falling to a low of US$2,291. There is a certain pressure on the top. If it is still difficult to rise to the range of US$2,335-2,340, then there will inevitably be a downward trend! Correct gold trading advice, winning is not about confusion friends The recent overall trend of gold in the market has shown a decline, but trading is also full of challenges. Opportunities and challenges coexist. Are you ready to meet your challenges? In my trading advice today, I emphasized the trading idea of shorting gold at high prices after a rebound. I wonder if you have adopted my trading idea in your trading and made a profit. If you followed my trading advice, you may have gained something. Taking advantage of opportunities to make profits in trading may not be so difficult after all. Now the price of gold has rebounded to around US$2,330 after falling to a low of US$2,291. There is a certain pressure on the top. If it is still difficult to rise to the range of US$2,335-2,340, then there will inevitably be a downward trend! I share trading strategies and trading ideas every day. ⬇⬇⬇Get detailed trading signals so that everyone is no longer confused when trading. I hope that with my help, everyone can get good results!Gold is now under pressure from above and has begun to fall back.Gold is now oscillating in the range of $2325-2330Gold prices are now down slightlyGold will generally show a volatile trend todayGold prices today will trade between support at $2,295.00 and resistance at $2,335.00.Gold is currently in a state of adjustment. We can wait and see for a while, and we can go long gold when it falls to a low point.Gold is currently in a slight decline and is about to bottom outGold has fallen from the highest point of 2337 US dollars to 2315 US dollars. There is still room for decline. Radicals can go long here.Gold has fallen from the highest point of 2337 US dollars to 2315 US dollars. There is still room for decline. Radicals can go long here.As I predicted, gold rebounded after hitting bottom
Disclaimer
Any content and materials included in Sahmeto's website and official communication channels are a compilation of personal opinions and analyses and are not binding. They do not constitute any recommendation for buying, selling, entering or exiting the stock market and cryptocurrency market. Also, all news and analyses included in the website and channels are merely republished information from official and unofficial domestic and foreign sources, and it is obvious that users of the said content are responsible for following up and ensuring the authenticity and accuracy of the materials. Therefore, while disclaiming responsibility, it is declared that the responsibility for any decision-making, action, and potential profit and loss in the capital market and cryptocurrency market lies with the trader.