
Geroge_Fx
@t_Geroge_Fx

What symbols does the trader recommend buying?
Purchase History
پیام های تریدر
Filter
Signal Type
Geroge_Fx
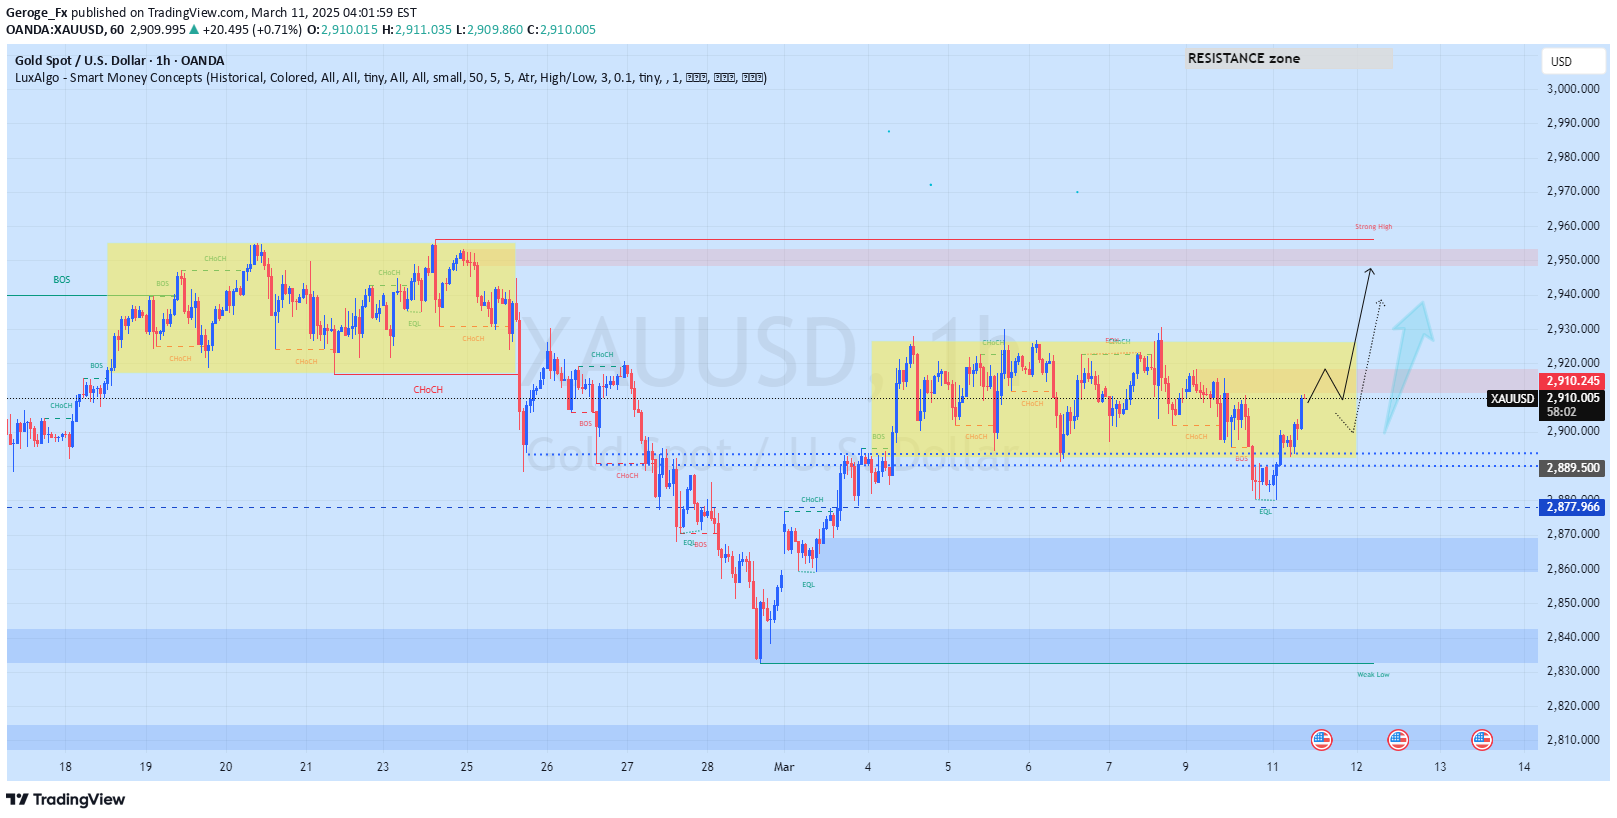
Here’s a clear and professional signal you can share with your clients:---📈 XAU/USD (GOLD) BUY SIGNAL 📈🔹 Entry: $2,909🔹 Stop Loss (SL): Below $2,890🎯 Take Profit (TP) Targets:✅ TP1: $2,920✅ TP2: $2,935✅ TP3: $2,945🏁 Final Target: $2,950💬 Market Outlook: Gold is showing bullish momentum, targeting key resistance levels. Patience and proper risk management are key.🟢 Trade safely and stay disciplined! 🟢#XAUUSD #GoldTrading #BuySignal #ForexAnalysis As of March 11, 2025, gold (XAU/USD) is trading around $2,901 per ounce. Support and Resistance Levels:According to recent technical analysis, the key support and resistance levels for gold are:First Resistance Level (R1): Approximately $2,909.98First Support Level (S1): Approximately $2,874.94Second Support Level (S2): Approximately $2,861.21Third Support Level (S3): Approximately $2,839.90Buy Zone:Given your interest in a buy zone around $2,909 on the H1 (hourly) chart, it's notable that this aligns closely with the first resistance level (R1) mentioned above. Typically, traders look to buy near support levels and sell near resistance levels. However, if the price breaks above the resistance level of $2,909.98 and sustains that level, it could indicate bullish momentum, potentially making it a viable buy zone. Conversely, if the price fails to break this resistance, it might be prudent to wait for a retracement to a support level before considering a buy position.Additional Considerations:It's essential to monitor upcoming economic data releases, such as the U.S. Consumer Price Index (CPI) data scheduled for release on Wednesday, as they can significantly impact gold prices. Additionally, keeping an eye on the Relative Strength Index (RSI) can provide insights into potential overbought or oversold conditions, aiding in making informed trading decisions. Always ensure to incorporate risk management strategies in your trading plan, considering the inherent volatility in the gold market.Here's a clearer and more professional version of your update: XAU/USD Buy Zone: 2909 🎯 Target Achieved: 2950 ✅ All TP Successfully Hit: 200 pips secured This format is concise and effective. Let me know if you'd like variations or additional details included.Nice call! That's an impressive 380 pips gain — well done. Are you planning to enter a new position or waiting for a fresh setup? Close all trade guys
Geroge_Fx

Based on the chart's structure and key levels, here's a suggested trade setup for XAUUSD:Entry Point:Consider entering a short position around 2,909 - 2,910 if price shows rejection or bearish confirmation.Take Profit (TP) Levels:TP1: 2,903 (previous support level)TP2: 2,890 (near the dotted trendline zone)TP3: 2,876 (lower channel boundary for maximum profit potential)Place your SL above the weak high zone around 2,920 - 2,925 to allow room for volatility.This setup follows the projected bearish pattern within the chart's consolidation phase. Always confirm with price action signals before entering. Would you like a text draft to send to your clients as a trading signal?Here's a clear and professional post you can share with your clients:---📉 XAUUSD (Gold) H4 Chart Analysis 📉🔻 Sell Zone: 2,900📌 Key Levels to Watch:Resistance Zone: 2,920 – 2,957Support Levels: 2,890 | 2,870 | 2,840💬 The market is respecting the upward channel but shows signs of a potential breakdown. A break below 2,900 could trigger bearish momentum.✅ Watch for confirmation before entering. Manage risk with appropriate stop-loss and take-profit levels.#XAUUSD #GoldAnalysis #TradingSignals #ForexAnalysis #H4Chart---Would you like additional commentary on risk management or technical insights for your post?
Geroge_Fx

🚨 SUI/USDT BUY SIGNAL 🚨🔹 Entry: 2.3500🎯 Targets:✅ TP1: 2.5500✅ TP2: 2.7500✅ TP3: 3.0000📌 Final Target: 3.0000🔒 Risk Management is Key! Set Your Stop-Loss Wisely.---This version is clear, professional, and encourages risk management. Let me know if you'd like to add anything else.\ Here's an analysis of SUI/USDT, focusing on support and resistance levels, particularly around the buy zone at $2.3500 on the 4-hour (H4) chart:Support Levels:$2.2116: Identified as the third support point, this level may serve as a strong support if the price declines. $2.3890: Recognized as a support level, this area could provide a buffer against further price drops. Resistance Levels:$2.8076: Marked as the first resistance point, this level could pose a challenge for upward price movements. $2.9846: Identified as the second resistance point, this area may serve as a significant barrier to price increases. $3.1056: Noted as the third resistance point, this level could be a critical threshold for bullish momentum. Technical Indicators:Fibonacci Retracement Levels: Common retracement levels such as 23.6%, 38.2%, 50%, and 61.8% are often used to identify potential support and resistance areas. Moving Averages: The 50-day moving average is at $3.3596, with the current price below this average, indicating a bearish trend. 4-Hour Chart Analysis:The 4-hour chart shows that the $2.3500 level aligns closely with the identified support zones, suggesting a potential buy opportunity. However, traders should monitor the price action around this level and consider the broader market context before making trading decisions.Conclusion:The $2.3500 buy zone on the H4 chart is near significant support levels, indicating a potential entry point. Traders should watch for bullish signals around this area and be mindful of the resistance levels that could impact upward momentum. Employing proper risk management strategies is crucial to navigate potential market volatility.
Geroge_Fx

🔻 BTC/USDT Sell Zone 🔻📉 Entry: 93,000🎯 Take Profit Targets:✅ TP1: 90,000✅ TP2: 85,000✅ TP3: 80,000✅ TP4: 73,000 (Final Target)📍 Target: 73,000📊 Timeframe: D1 (Daily Chart)⚠ Risk management advised. Set SL accordingly.---Let me know if you need any tweaks! A sell zone around $93,000 on the BTC/USDT D1 chart suggests you're expecting resistance or a reversal near that level. Here are some key factors to consider:Confirmation Signals for a Sell at 93K:1. Key Resistance: Check if 93K aligns with previous supply zones, Fibonacci levels, or trendline resistance.2. Overbought Conditions: RSI above 70 or divergence could confirm a potential reversal.3. Volume Analysis: Weak buying momentum or large sell orders appearing in order books.4. Candlestick Patterns: Look for bearish engulfing, shooting star, or other reversal signals.5. Moving Averages: If price is extended far above key MAs (e.g., 50D, 200D), it could indicate a pullback.Potential Sell Scenarios:Rejection at 93K: A strong bearish reaction could confirm the level.Fakeout & Reversal: Price wicks above but closes below on high timeframes.Breakout & Retest: If 93K is broken, wait for a retest and rejection to confirm weakness.Are you targeting a specific downside level after rejection, like 85K or 80K?Great trade! Hitting TP3 with 1200 pips is a solid win. If your final target is 73,000, that's a huge move. Are you holding for the full drop, or locking in profits along the way?
Geroge_Fx

Sell Target for XAU/USDEntry Zone: Around 2,858Target 1: 2,805 (Support level)Target 2: 2,688 (Lower support in the upward channelTrade Plan Summary:The chart indicates a sell-off from the resistance zone.A potential retest at 2,900 before further decline.Key support at 2,805, with a deeper drop to 2,688 if momentum continues.Would you like additional confirmation with indicators (RSI, moving averages, etc.)? ; This is a technical analysis chart for Gold (XAU/USD) on the 4-hour timeframe. Here are some key observations:1. Uptrend Structure:The chart shows a clear bullish momentum with an upward trendline.A breakout occurred earlier, leading to higher highs.A triangle pattern formed near the resistance zone.2. Resistance Zone:Price has reached a resistance zone around $2,953 - $2,963.A sell-off happened after the price touched the top.3. Potential Price Action:A possible retracement is forming, targeting around $2,900 before further movement.If price breaks below $2,900, it could test the $2,805 support level.The overall upward channel remains intact, suggesting potential bullish continuation in the longer term.Would you like a more detailed analysis or trading suggestions based on this?
Geroge_Fx

This is a SUI/USDT 1-hour chart from TradingView.Key Observations:Downtrend Line: The chart shows a downward trendline indicating previous bearish momentum.Resistance Zone: Price is approaching or has touched a resistance zone.Lower High Formation: Confirming a bearish structure.Pullback & Continuation: A possible pullback has been marked, suggesting a continuation of the trend.Projected Price Movement: Two possible scenarios:1. A slight bullish move before reversing downward.2. A direct drop in price after rejection.Suggested Post:🚨 SUI/USDT TRADE ALERT 🚨📊 Chart Analysis:🔹 Trend: Downtrend with resistance rejection🔹 Key Resistance Zone: Marked on the chart🔹 Possible Move: Price may face rejection and continue downward 📉🎯 Sell Entry:3.2500 Around resistance✅ Targets:TP1: 2.900TP2: 2.700TP3: 2.6500⚠ Risk Management: Always use stop loss!#Crypto #Trading #SUIUSDT #SellSignal #TechnicalAnalysisWould you like any modifications before posting?Nice trade! Looks like you caught a solid move on SUI/USDT from 3.2500 down to 2.6500. Great execution and all targets hit! Are you eyeing any new setups, or waiting for the next opportunity?
Geroge_Fx

Here’s a polished version of your post for your client:BTC/USD Buy Signal📍 Buy Zone: 85,500🎯 Targets:TP1: 90,500TP2: 95,500TP3: 99,800📊 Manage risk accordingly. Trade wisely!Let me know if you want any tweaks!It looks like you've uploaded a chart image, but I can already analyze it from the screenshot you shared. Here’s my breakdown of the BTC/USD 4-hour chart:Analysis:1. Trend Structure:The chart shows a descending channel correction (marked in red).BTC/USD recently experienced a sharp drop but has bounced back from the lower boundary of the black trendline.2. Key Support and Resistance:Support Zones:$86,000 (marked in blue)$90,134.9 - $91,158.8 (another support range)Resistance Levels:$99,478.6$102,550.5$110,677.9 (psychological resistance)3. Consolidation & Breakout Potential:There was a consolidation phase in the yellow box before the sharp drop.The price has bounced off strong support and is now aiming to retest the descending channel resistance (red trendline).A successful breakout above this level could push BTC toward psychological targets above 100K.4. Bullish Scenario:If BTC breaks the red descending trendline, a rally towards 99K–104K is likely.A strong breakout could lead to BTC testing 110K and beyond.5. Bearish Scenario:If BTC fails to break the resistance at the red trendline, it could retrace back to 86K.A break below 86K would confirm further downside potential.Conclusion:The structure is recovering from a correction, and a breakout above resistance could lead to a bullish rally.Watch for a confirmed breakout above the descending channel for a bullish entry.Key psychological levels: 100K and 110K.Would you like me to refine this analysis further or provide trading recommendations?
Geroge_Fx

The chart you provided is an H4 (4-hour) analysis of XAU/USD (Gold vs. USD). Here are the key takeaways:Chart Observations:1. Sell Zone @ 2897:The price recently tested the $2897 resistance level and formed a double-top pattern ("TOP 1" and "TOP 2"), indicating potential reversal.Sellers appear to be defending this level, leading to a decline.2. Trend Breakdown:The chart initially shows bullish momentum leading up to higher highs.However, an upward trendline has now been broken, confirming bearish pressure.3. Expected Price Movement:After breaking below support, the price is consolidating and may retest the previous support-turned-resistance.A continuation of the downward movement is expected, potentially targeting $2,880 - $2,865 levels.4. Bearish Confirmation:Volume analysis shows increased selling pressure after the rejection from the resistance zone.If price fails to break back above $2897, more downside is expected.Trading Strategy:Sell Entry: Near $2897 - $2900 resistance.Take Profit (TP) Levels:TP1: $2880TP2: $2865TP3: $2845 (longer-term target)Stop Loss (SL): Above $2905 to minimize risk.Alternative Buy Setup: If price breaks above $2905 and sustains, reconsider bearish bias.Conclusion:Bearish bias is valid as long as price remains below $2897.Watch for confirmation on lower timeframes before entering a sell trade.Fundamental Factors: Keep an eye on U.S. economic data (PCE inflation, Fed speeches), which may impact gold prices.Would you like me to refine the strategy further or check additional indicators?Trade Update on XAUUSD We entered a sell position in the 2897 zone. Our first take profit target was successfully reached with a gain of 130 pips. We are now focusing on our next target at 2840. I'll continue to monitor the market and keep you updated on any further developments. Thank you for your continued trust and partnership. --- Feel free to adjust any part of the message as needed!
Geroge_Fx

📉 BTC/USD Sell Signal 📉🔹 Entry: 89,300🔹 Take Profit Targets:🎯 TP1: 94,000🎯 TP2: 98,000🎯 TP3: 100,200🎯 Final Target: 106,200🔹 Stop-Loss: 80,500📊 Trade wisely and manage your risk! 🚀 It looks like you're identifying a buy zone at 89,300 based on your H4 (4-hour) chart analysis. Here are a few things to consider:Key Technical Factors to Watch:1. Support & Demand:If 89,300 aligns with a strong support level, it could be a good buy zone.Check if price has bounced from this area previously.2. Indicators Confirmation:RSI: Is it near oversold (below 30)?Moving Averages: Is price interacting with a key MA (50, 100, or 200)?Fibonacci Levels: Does 89,300 align with a retracement level?3. Market Structure:Look for bullish candlestick patterns (hammer, engulfing) in this area.Trend direction—are we in a larger uptrend or downtrend?4. Liquidity & Order Flow:If there's a liquidity grab (fakeout below a previous low), this could trigger a bullish reversal.5. News & Fundamentals:Keep an eye on economic data (interest rate decisions, inflation reports).Would you like help with entry confirmation strategies or stop-loss placement? ---Let me know if you want any modifications!
Geroge_Fx

📊 XAUUSD Gold H4 Chart Analysis🔹 Buy Zone: $2,936🔹 Support Levels: $2,929 - $2,926🔹 Upward Channel & Bullish Momentum 📈🔹 Resistance Zone Approaching🔹 Potential Targets:✅ $2,943 | ✅ $2,953 | ✅ $2,961 | ✅ $2,990🔹 Stop Loss: $2,911Gold remains in a strong uptrend, respecting the upward channel. Watch for price action near key support and resistance levels!📊 Check out the chart for detailed insights.#XAUUSD #GoldTrading #Forex #TechnicalAnalysis #TradingSignals---You can now post this along with the chart image. Let me know if you want any changes!
Disclaimer
Any content and materials included in Sahmeto's website and official communication channels are a compilation of personal opinions and analyses and are not binding. They do not constitute any recommendation for buying, selling, entering or exiting the stock market and cryptocurrency market. Also, all news and analyses included in the website and channels are merely republished information from official and unofficial domestic and foreign sources, and it is obvious that users of the said content are responsible for following up and ensuring the authenticity and accuracy of the materials. Therefore, while disclaiming responsibility, it is declared that the responsibility for any decision-making, action, and potential profit and loss in the capital market and cryptocurrency market lies with the trader.