
DCBFOREXTRADING
@t_DCBFOREXTRADING

What symbols does the trader recommend buying?
Purchase History
پیام های تریدر
Filter
Signal Type
DCBFOREXTRADING
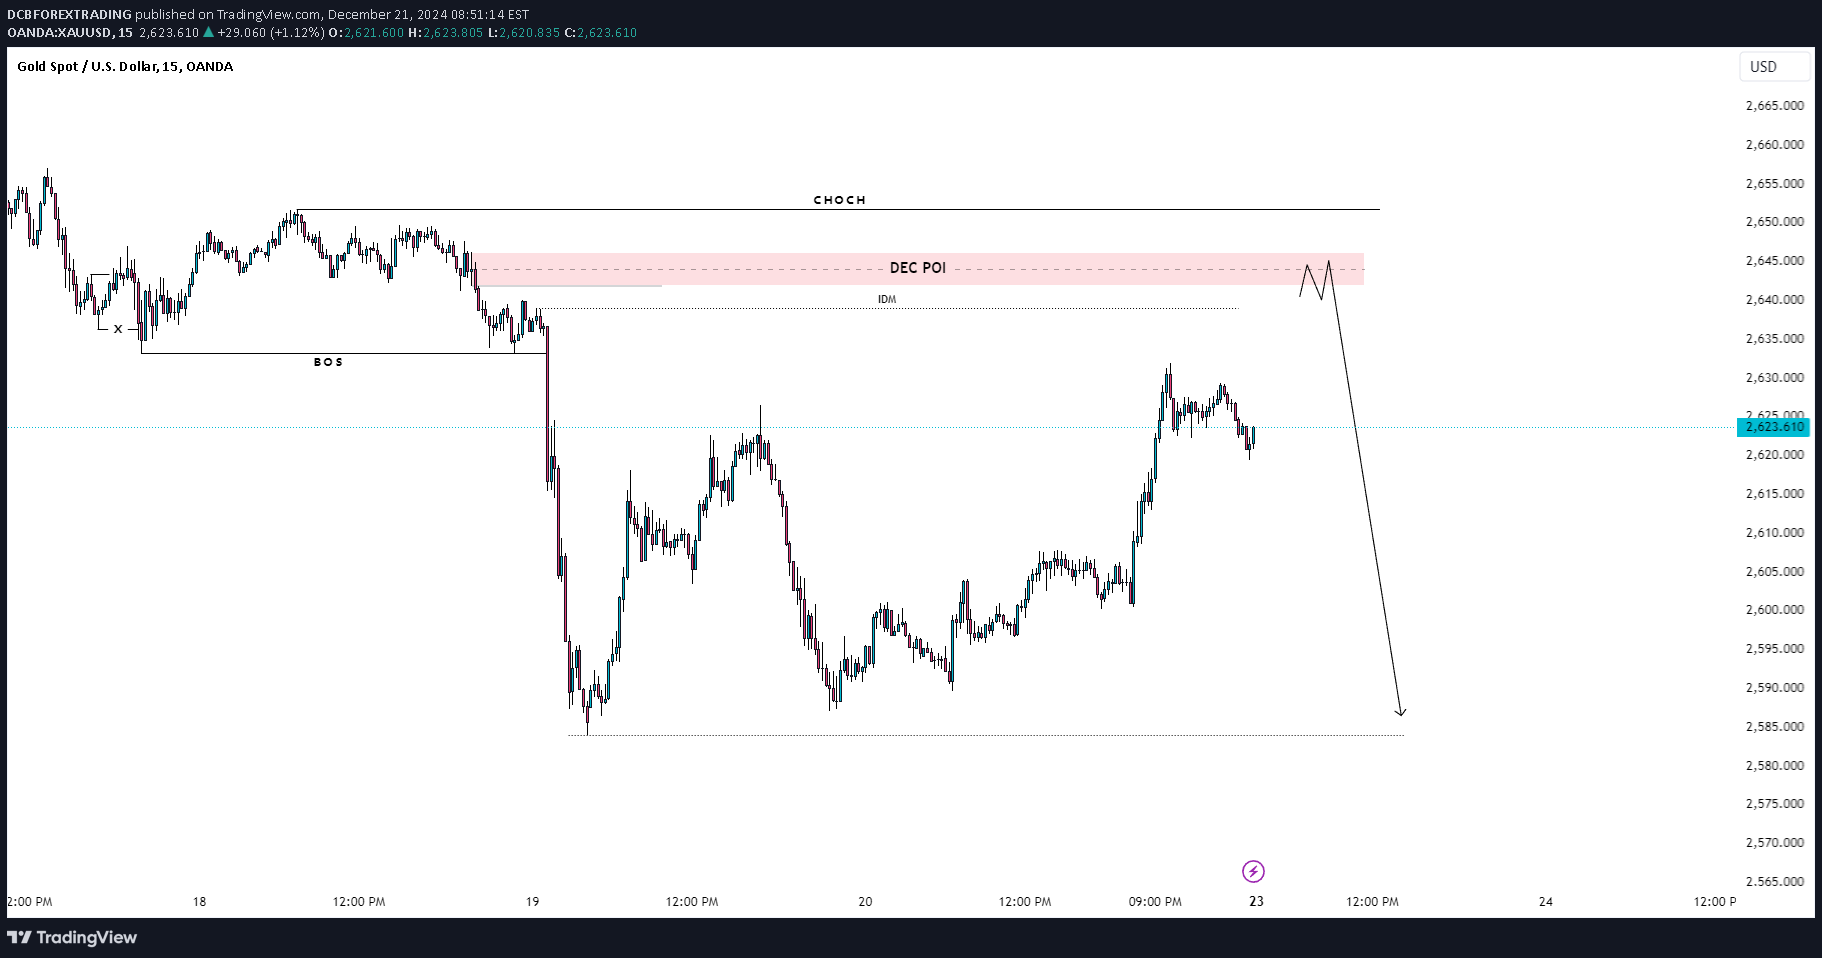
We can see a significant drop in price, followed by consolidation and a potential retracement. The projected movement suggests a rise towards the DEC POI zone, followed by a significant drop. This setup offers potential entry points and price targets for trading XAU/USD. Keep these levels in mind and trade wisely!
DCBFOREXTRADING
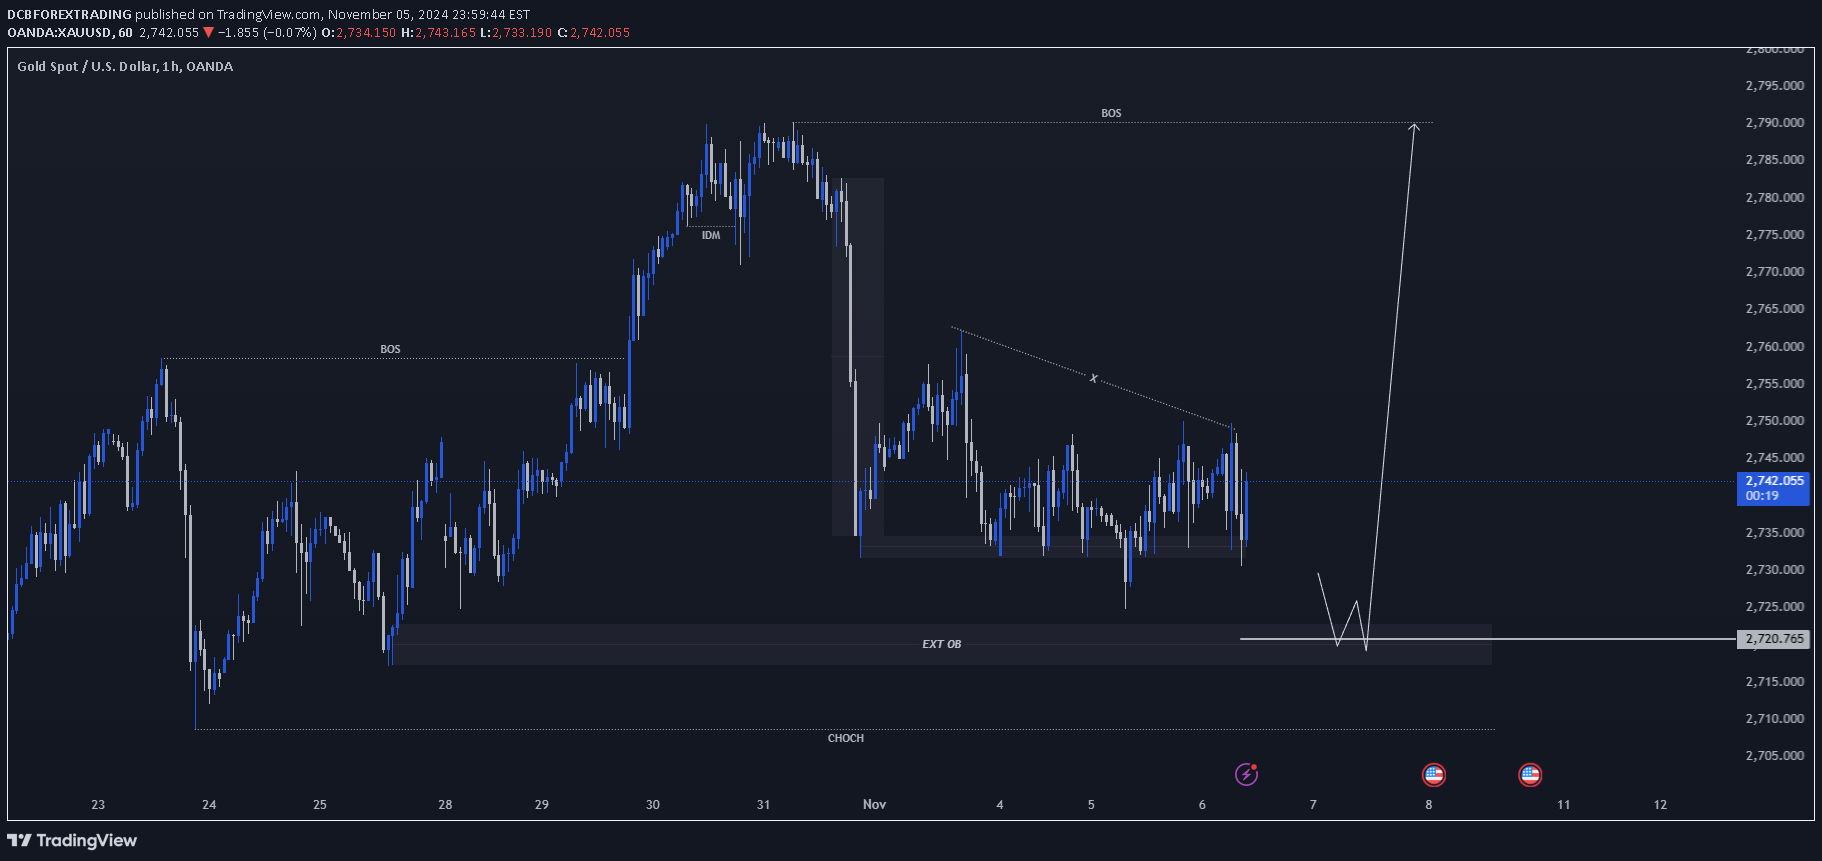
Looking at this updated Gold Spot (XAU/USD) chart on the 1-hour timeframe, we can identify the following insights: Break of Structure (BOS): The recent BOS suggests a shift in momentum, indicating that a bullish reversal could be on the horizon if certain levels are held. External Order Block (EXT OB): Located around the $2720 level, this area represents a key demand zone. Price may look to revisit this zone before any significant bullish reaction. Potential Scenario: If the price tests the EXT OB level and shows a strong rejection, we might see a bullish rally, potentially targeting the recent high near $2790. Outlook: A bullish scenario may unfold if the EXT OB at $2720 holds as a support level. Traders could look for potential entries upon confirmation of reversal patterns in this zone, with targets set towards the previous high.
DCBFOREXTRADING
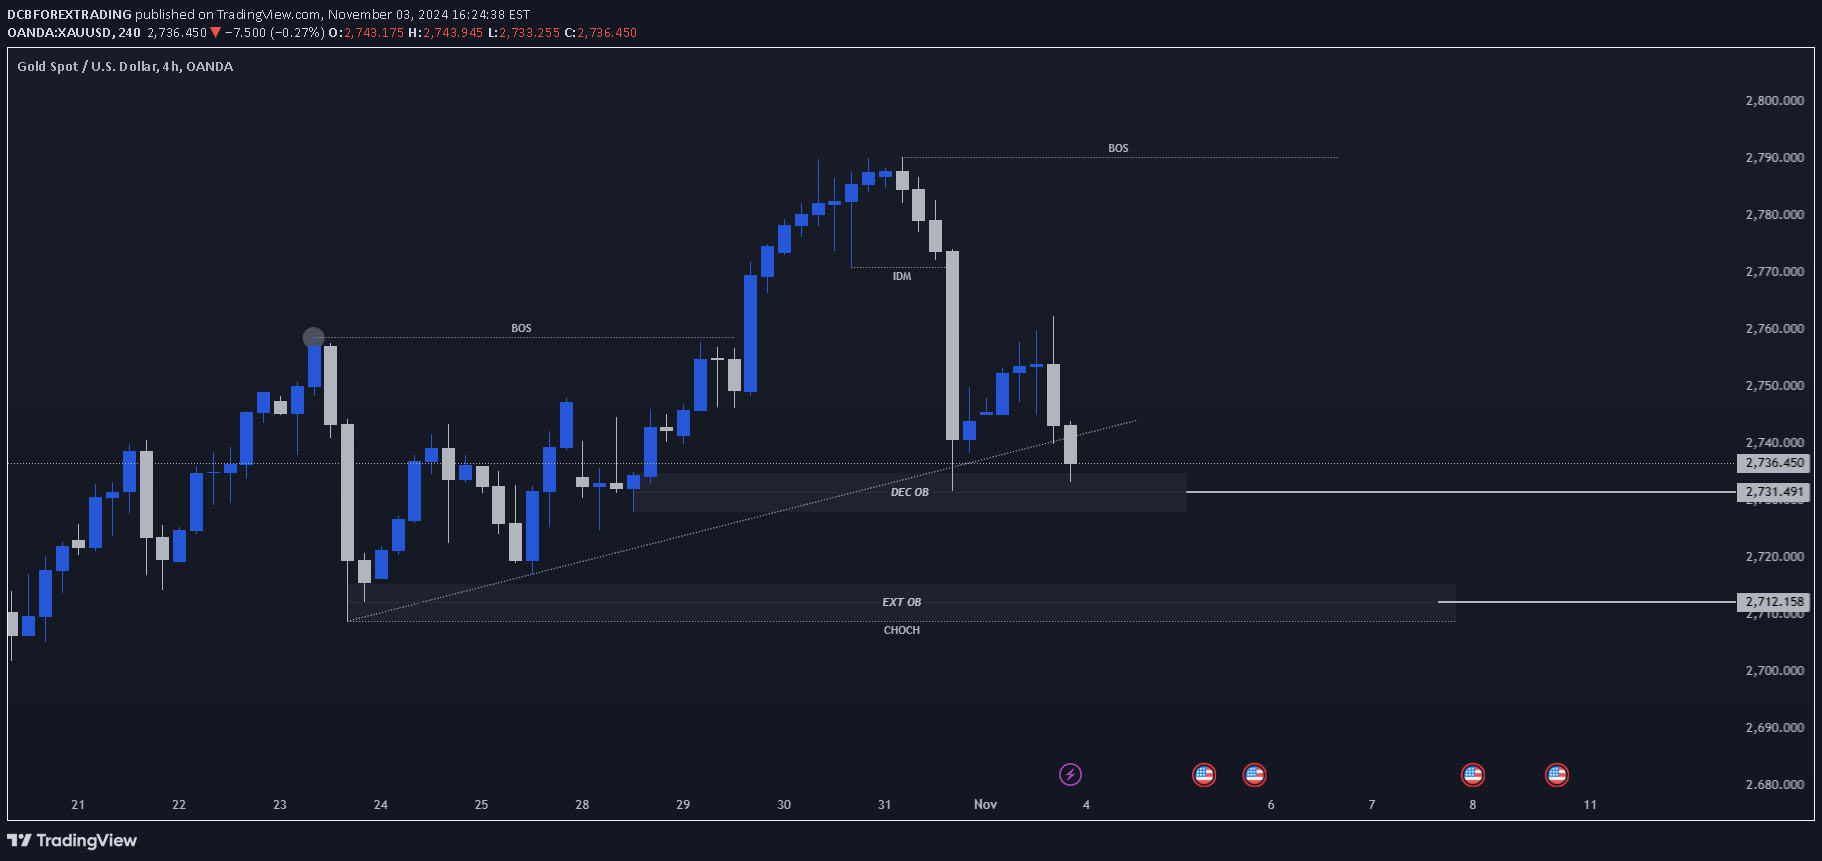
By analyzing the #Gold chart in the 4-hour timeframe, we can observe that the recent price action highlights several important structural points based on Smart Money Concepts (SMC): Demand and Supply Zones: There are two main order blocks (OB): Decisional Order Block (DEC OB) located near the $2731 zone, which represents a demand area where buyers previously entered. This level may act as a support if the price approaches it again. Extreme Order Block (EXT OB) positioned around $2712, acting as a deeper support zone in case the DEC OB does not hold. Current Price Action: The price is currently testing the DEC OB near the $2731 level. A positive reaction from this zone may indicate a potential reversal or consolidation, while a drop below this level could lead to further movement toward the EXT OB at $2712. Outlook: If the price stabilizes above $2731, it could indicate a bullish continuation, with potential targets set at $2739, $2744, and $2752. On the other hand, if the price breaks below $2731, it may signal a move down to $2712, where we might see a demand reaction.
DCBFOREXTRADING
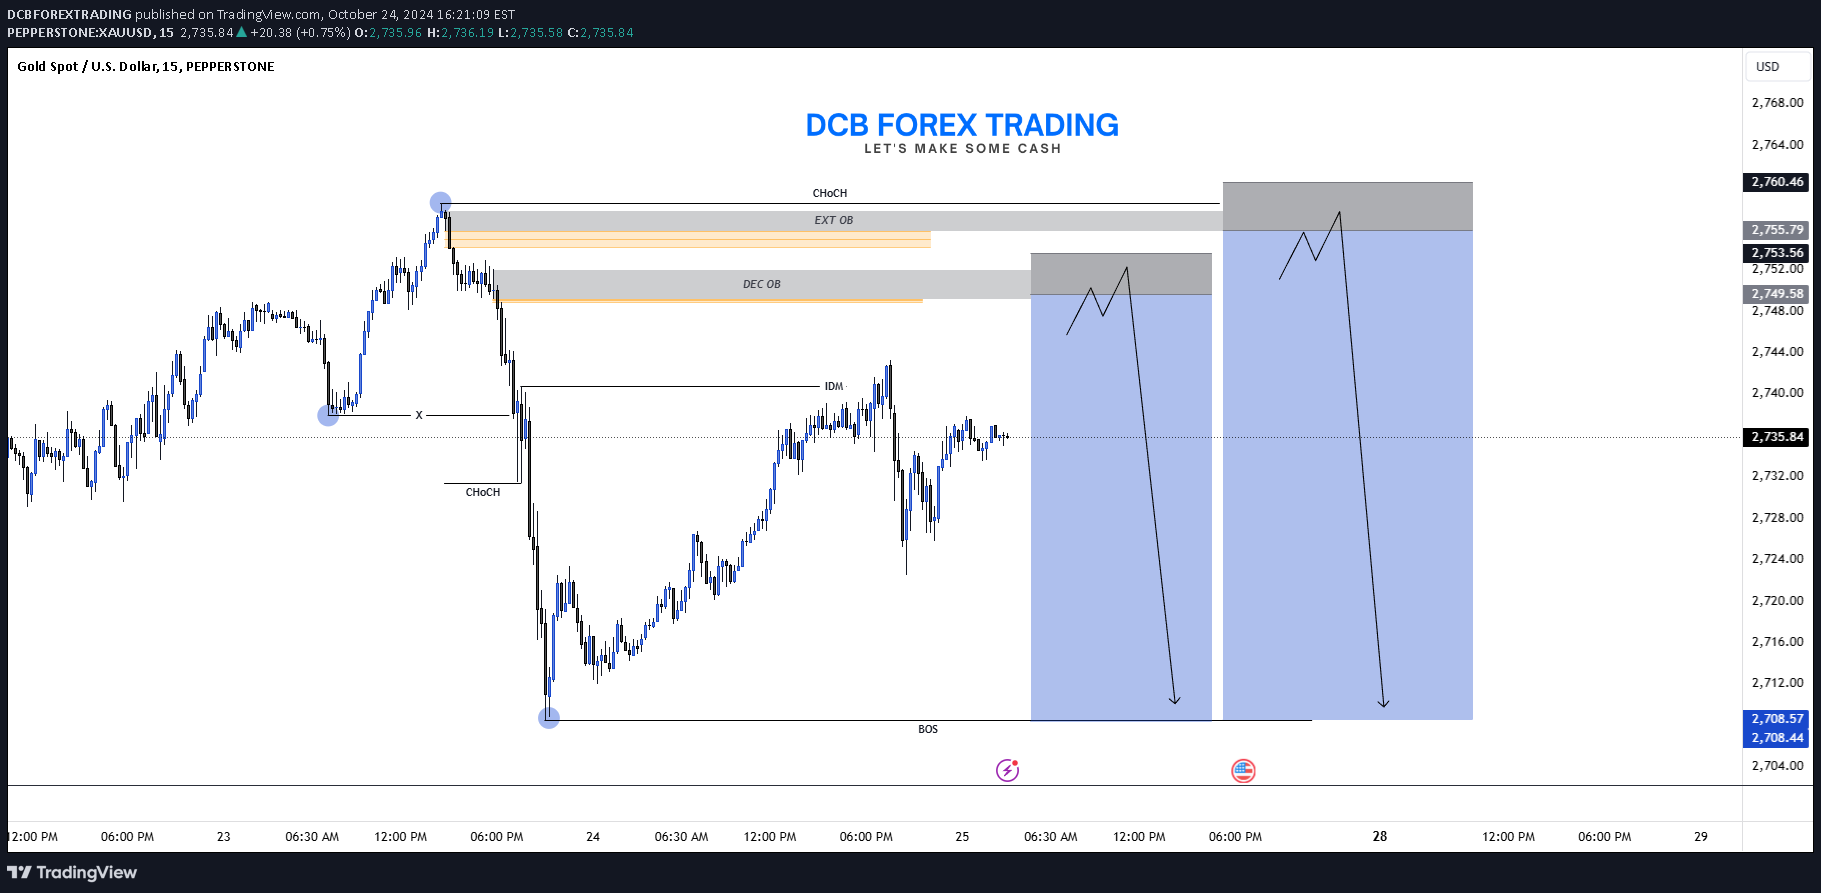
🕒 Timeframe: 15M 💰 Instrument: Gold Spot (XAU/USD) 💵 Price: Currently trading around 2735.84 USD We’re seeing a bearish market structure unfold on Gold, with potential key levels to watch for short setups. Here's the breakdown: CHoCH (Change of Character): A shift in market structure from bullish to bearish around the 2755.79 level, indicating a potential move down. Order Blocks: EXT OB: Strong external order block at the 2755.79 resistance, serving as a supply zone. DEC OB: Another order block around 2753.56, likely to add more supply pressure. Key Price Levels: Resistance around the 2755.79 and 2753.56 zones. A BOS (Break of Structure) confirms the bearish outlook. Bearish Scenario: Retest of the EXT OB (2755.79) may trigger further downside moves. We could expect price action to follow the bearish pattern indicated, with potential moves back down toward 2708.57 as shown by the arrows. 🛠 Strategy: Look for potential short entries on retests of the highlighted order blocks and take profits at key support levels around 2708. Manage risk carefully, as market volatility can lead to quick shifts!
DCBFOREXTRADING
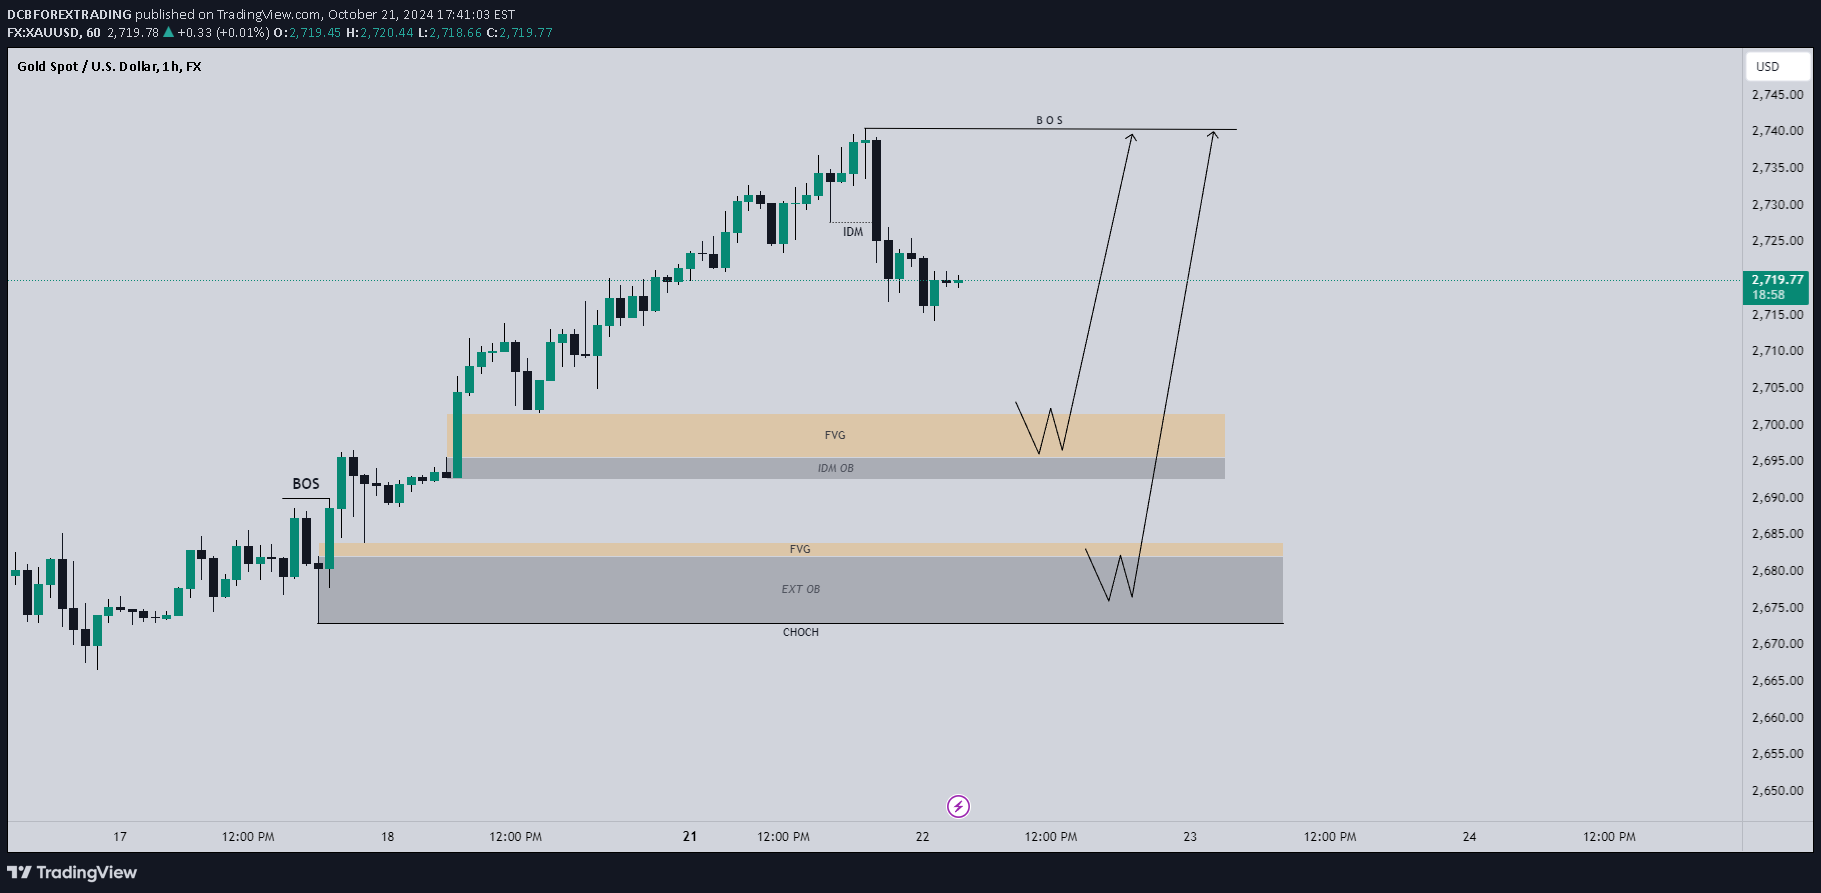
The chart you've shared appears to show a technical analysis for the Gold (XAU/USD) market using Smart Money Concepts (SMC). Here's a breakdown of the key elements on the chart: 1. **BOS (Break of Structure)**: This signifies a strong price movement that breaks a previous high or low, indicating a potential shift in market structure. On the chart, there was a break to the upside. 2. **FVG (Fair Value Gap)**: These zones highlight inefficiencies in the price action where price moved quickly, leaving a "gap" between candlesticks. Prices often revisit these areas, acting as potential support or resistance zones. 3. **CHoCH (Change of Character)**: A point where the market structure shifts, potentially signaling a reversal or correction. This is marked lower on the chart, suggesting a downward move is anticipated before a potential upward continuation. 4. **IDM OB and EXT OB (Order Blocks)**: These are areas of high institutional buying or selling pressure. They often act as strong areas of support or resistance where price might reverse. 5. **Expected Movements**: The chart indicates two possible bullish scenarios: - Price may retrace to one of the marked FVG or OB zones before bouncing back to the upside, breaking new highs. - Both scenarios suggest a "W" formation (double bottom-like structure) before a push higher, signifying a continuation of the uptrend. Overall, this SMC analysis seems to project a potential pullback followed by a strong bullish continuation, with specific zones of interest where traders might look for buy setups.
DCBFOREXTRADING
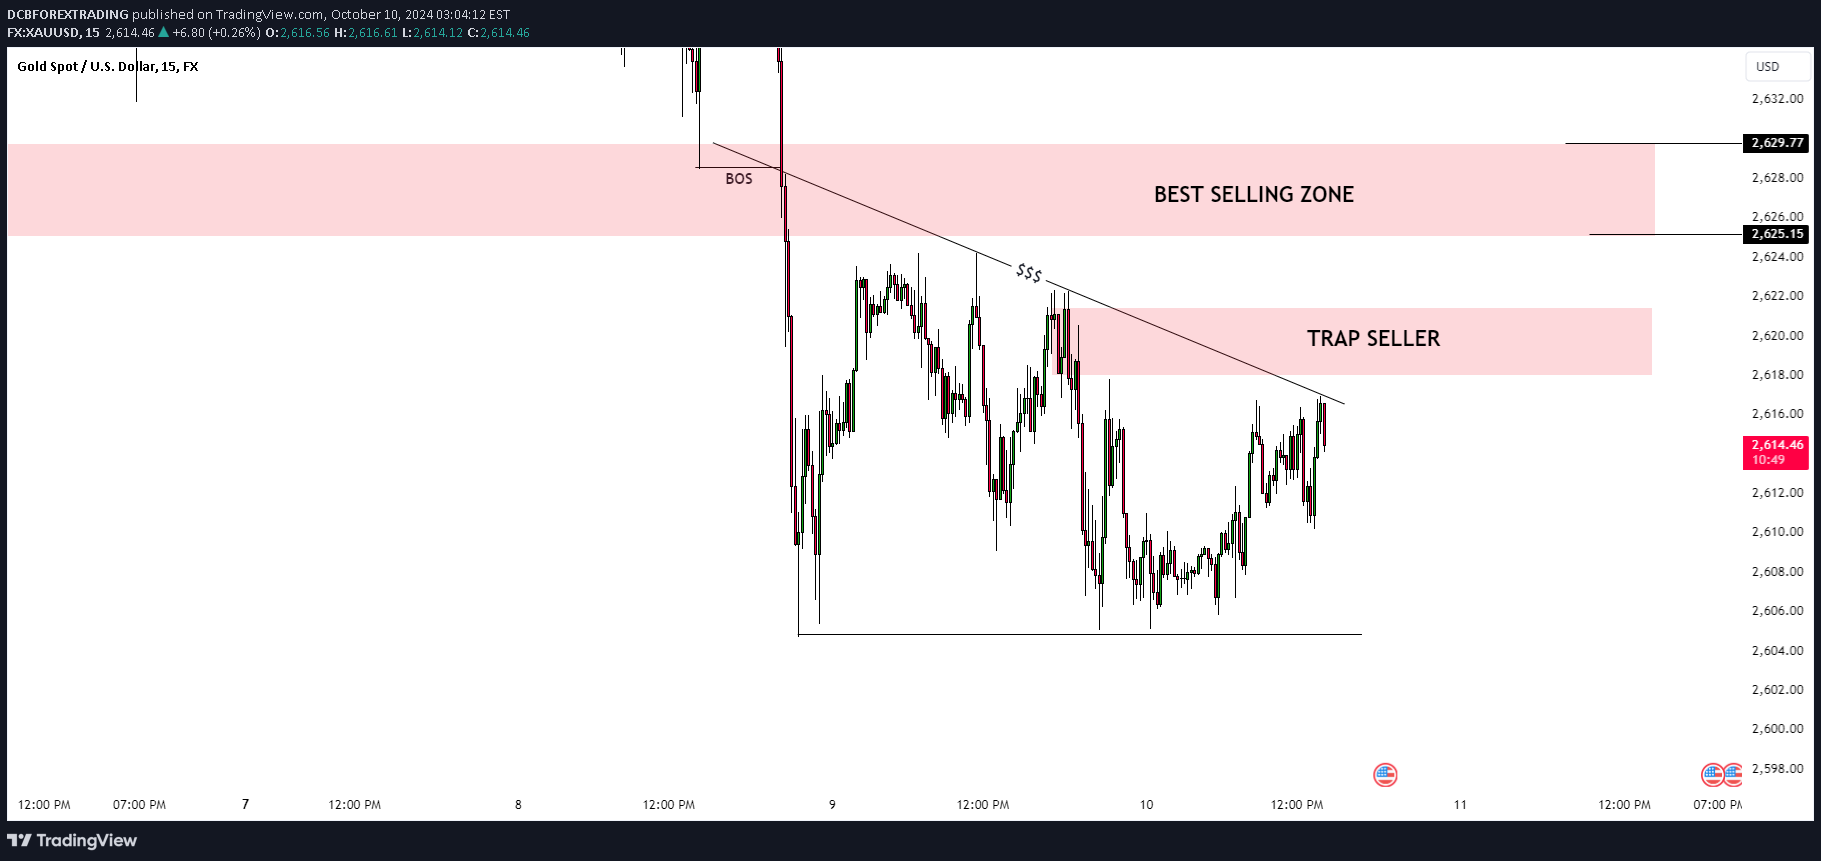
Best Selling Zone: 2625-2629 area marked as a prime resistance level, ideal for short setups. Trap Seller Area: Currently in play as price is testing this zone. Potential fake-out could trap early sellers before dropping. Break of Structure (BOS): Confirmed break of structure on the lower timeframes, indicating bearish sentiment. Look for a bearish rejection within the trap seller zone before entering shorts for a higher probability trade. Wait for confirmation before entering the trade to avoid getting trapped in a false breakout.
DCBFOREXTRADING
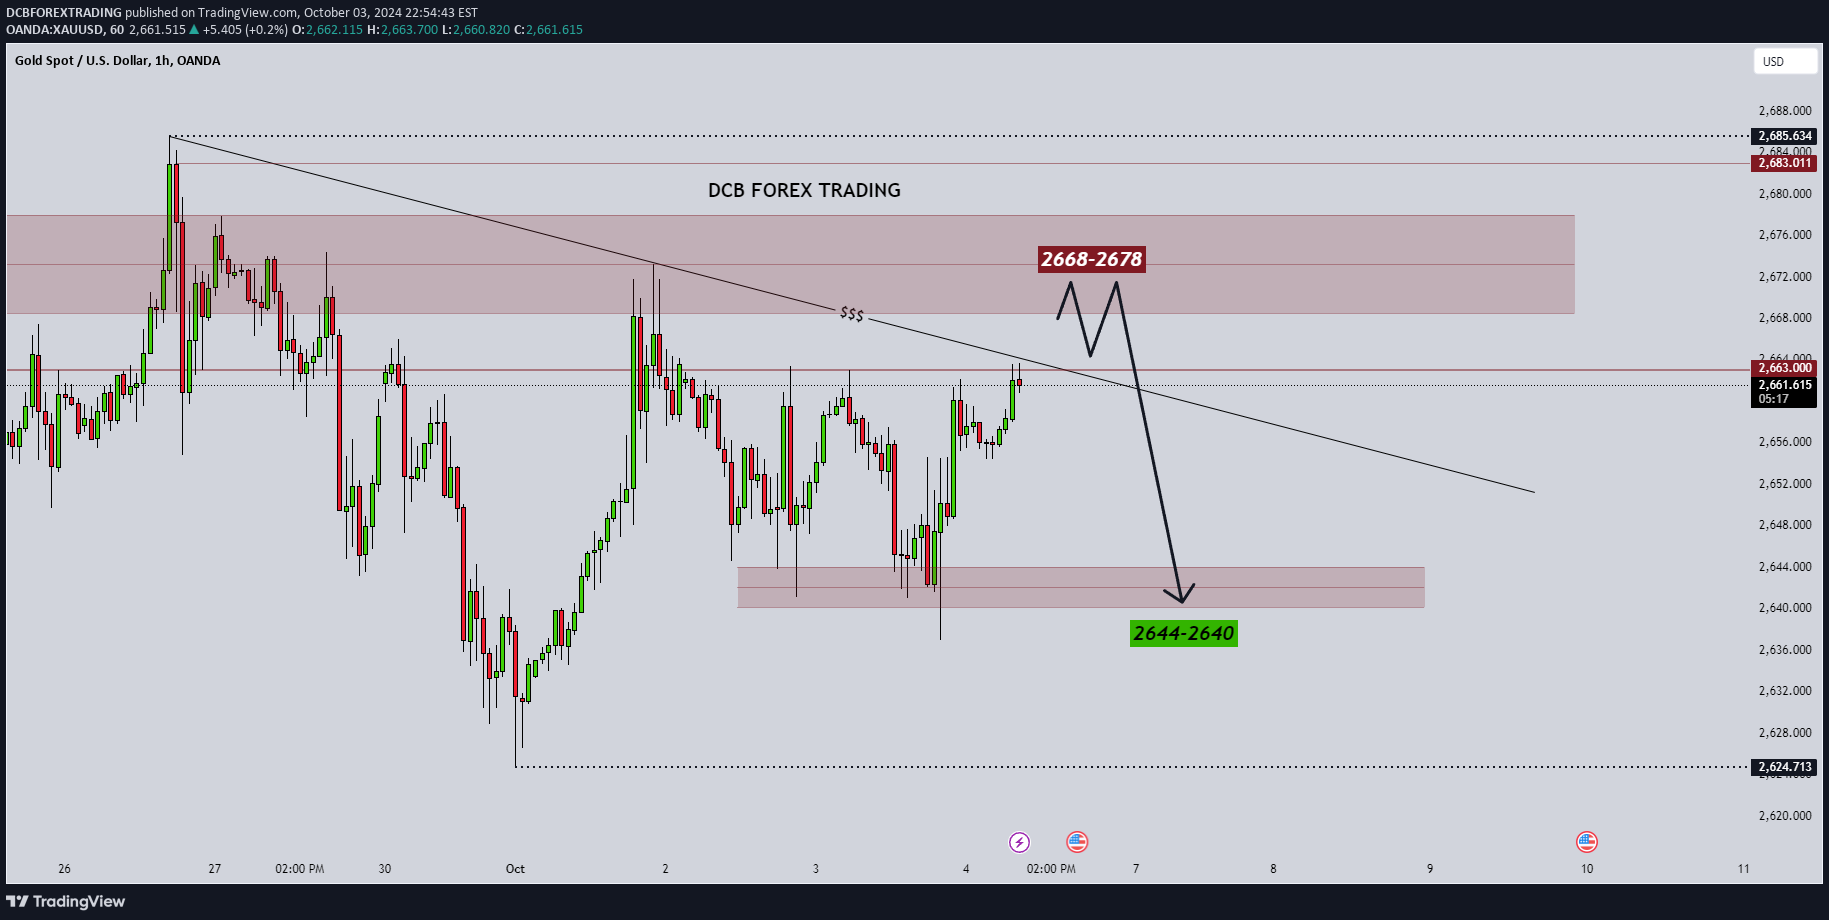
This Gold (XAU/USD) 1-hour chart shows price approaching the key supply zone between 2668 and 2678. A potential reversal is expected from this area, with a possible drop back towards the demand zone around 2644-2640. Traders should watch for bearish price action signals in the supply zone for short setups, with confirmation of a breakdown.
DCBFOREXTRADING
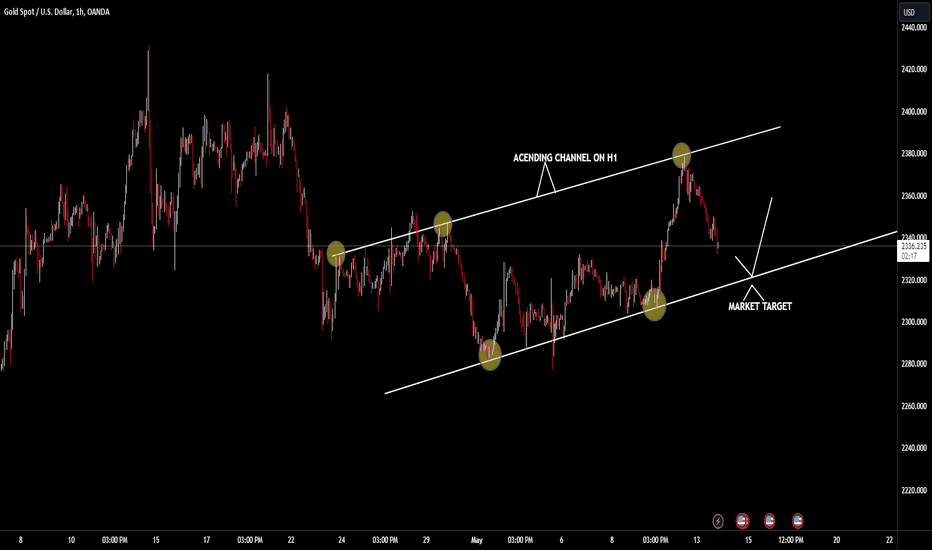
XAUUSD moved within the ascending channel, which formed when the price touched the channel borders 6 times and has been valid since 23 April. Current situation The price is moving towards the lower border of the ascending channel. Possible scenario Analysts recommend opening a Sell order with a take profit near the lower channel border.
DCBFOREXTRADING
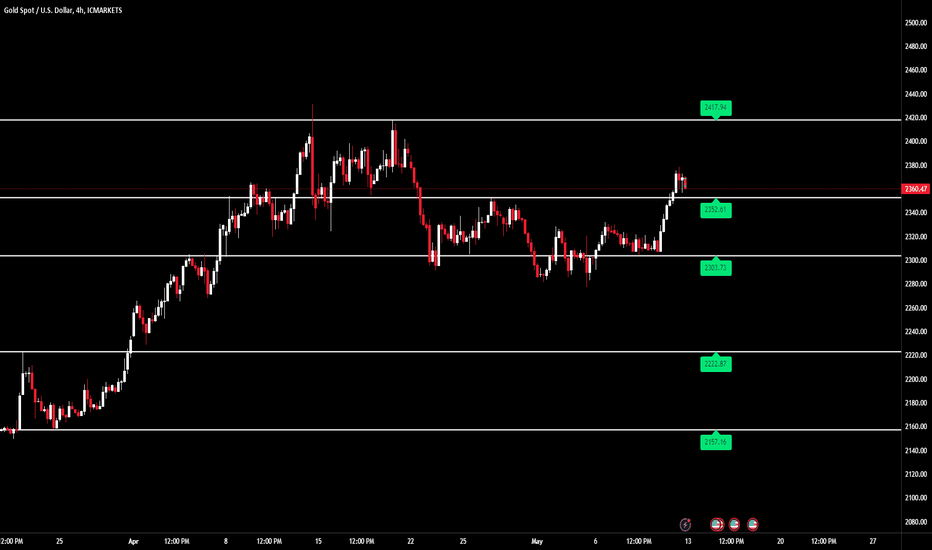
“You can take trades by seeing breakouts or pullbacks from the support and resistance levels shown on the chart.” Support and resistance levels are fundamental concepts in technical analysis used to identify potential turning points on a price chart. Here’s a brief explanation: Support: This is a level where the price tends to stop falling and bounces back up. It represents a concentration of demand, indicating that buyers are willing to purchase at this price, preventing further decline. Resistance: This is a level where the price typically stops rising and starts to fall again. It signifies a concentration of supply, suggesting that sellers are ready to sell at this price, halting further price increases. Both support and resistance levels can be identified using trendlines, moving averages, and by observing historical price action where the market has turned previously. They are not exact numbers but rather ‘zones’ where the price is likely to react. When these levels are breached, they can ‘reverse roles’—former support may become resistance, and vice versa. Understanding these levels can help traders make informed decisions about entry and exit points, stop-loss placements, and identifying potential market reversals. Remember, these levels are more like guidelines and should be used in conjunction with other analysis methods for the best results. 📈📉
DCBFOREXTRADING
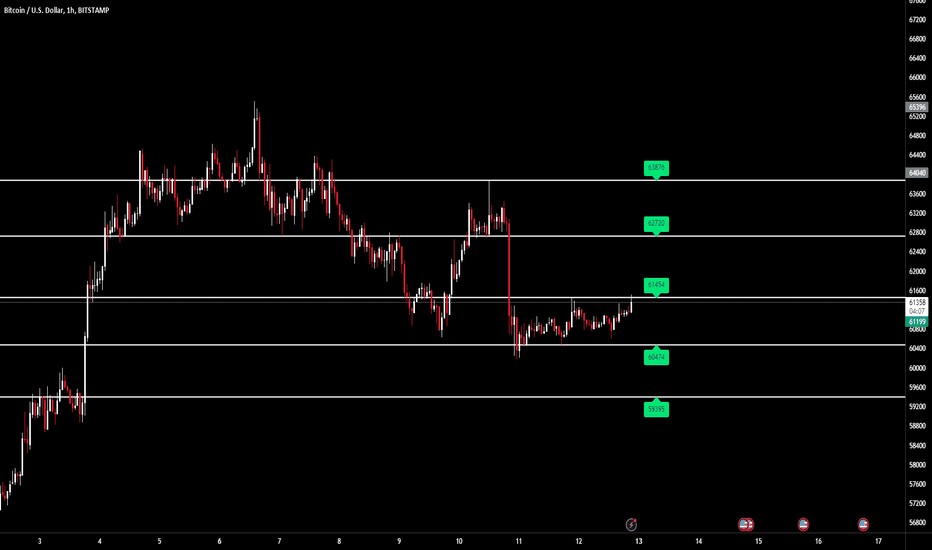
“You can take trades by seeing breakouts or pullbacks from the support and resistance levels shown on the chart.” Support and resistance levels are fundamental concepts in technical analysis used to identify potential turning points on a price chart. Here’s a brief explanation: Support: This is a level where the price tends to stop falling and bounces back up. It represents a concentration of demand, indicating that buyers are willing to purchase at this price, preventing further decline. Resistance: This is a level where the price typically stops rising and starts to fall again. It signifies a concentration of supply, suggesting that sellers are ready to sell at this price, halting further price increases. Both support and resistance levels can be identified using trendlines, moving averages, and by observing historical price action where the market has turned previously. They are not exact numbers but rather ‘zones’ where the price is likely to react. When these levels are breached, they can ‘reverse roles’—former support may become resistance, and vice versa. Understanding these levels can help traders make informed decisions about entry and exit points, stop-loss placements, and identifying potential market reversals. Remember, these levels are more like guidelines and should be used in conjunction with other analysis methods for the best results. 📈📉
Disclaimer
Any content and materials included in Sahmeto's website and official communication channels are a compilation of personal opinions and analyses and are not binding. They do not constitute any recommendation for buying, selling, entering or exiting the stock market and cryptocurrency market. Also, all news and analyses included in the website and channels are merely republished information from official and unofficial domestic and foreign sources, and it is obvious that users of the said content are responsible for following up and ensuring the authenticity and accuracy of the materials. Therefore, while disclaiming responsibility, it is declared that the responsibility for any decision-making, action, and potential profit and loss in the capital market and cryptocurrency market lies with the trader.