
AwesomeOscDad
@t_AwesomeOscDad

What symbols does the trader recommend buying?
Purchase History
پیام های تریدر
Filter
Signal Type
AwesomeOscDad
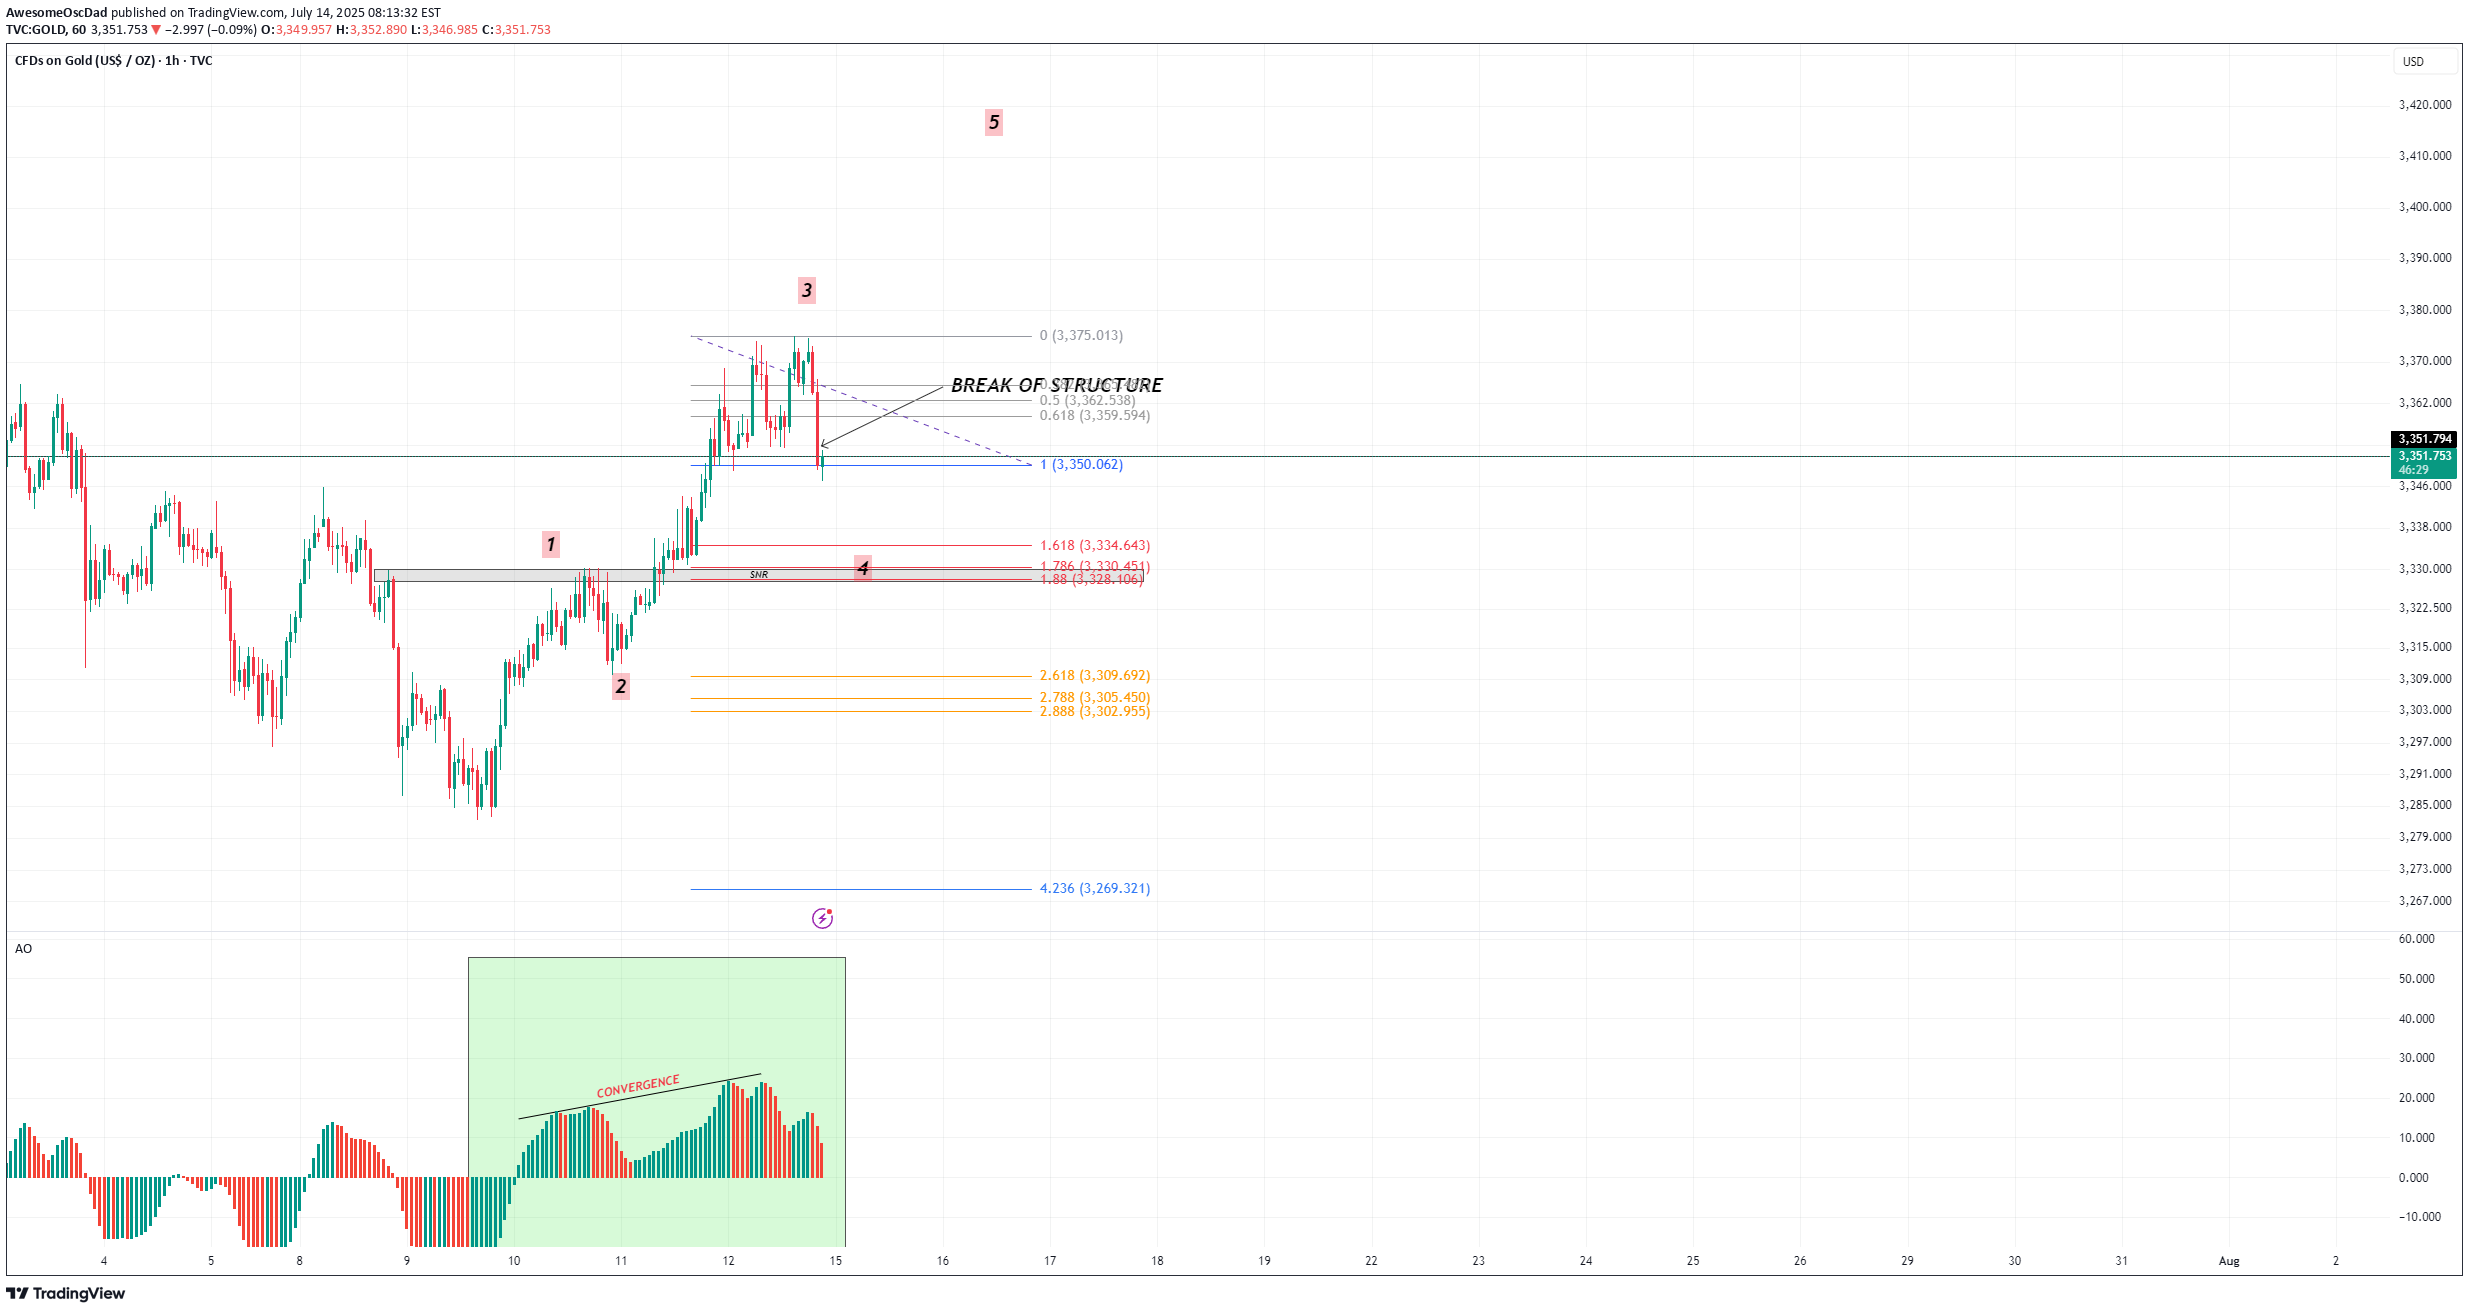
On the 1H chart, we are currently observing a potential bullish continuation setup forming on XAU/USD. Here’s a detailed breakdown: 🔍 1. AO Bullish Convergence The Awesome Oscillator (AO) shows a clear bullish convergence, suggesting momentum is building in favor of the bulls. This typically signals a potential continuation of the uptrend, especially when paired with structural confirmations. 🌀 2. Elliott Wave Count Wave 1, 2, and 3 are already established on the chart. Price is currently retracing, potentially forming Wave 4, with Wave 5 yet to be completed. The retracement aligns with classic Fibonacci levels, with a potential bounce zone forming at the 1.618 fib extension near 3330–3327, which also acts as a strong SNR zone (support now after previous resistance). 📊 3. Break of Structure (BOS) A clear Break of Structure (3351) confirms bullish intent after wave 3. Price retracement toward the 1.618 zone could present a buying opportunity, as long as this level holds. 🧭 4. Entry Strategy ✅ Buy Bias: Watching for price to enter 3330–3327 zone (1.618 fib + SNR zone). Confirmation needed: Look for another BOS within this zone before entering long. If BOS forms inside this area, we can anticipate a continuation into Wave 5 toward the 3,375 and beyond. ❌ Invalidation: Setup will be considered invalid if price breaks and closes below the 1.618 zone (3327). This would invalidate Wave 4 support and could signal a deeper correction or trend reversal. 🎯 Target Projection: If the setup holds, potential Wave 5 target is projected toward the top zone near 3,410–3,420, based on fib extension and previous price action. 📌 Conclusion: This is a classic bullish Elliott Wave continuation setup backed by AO convergence and structural confluences. Patience is key—wait for BOS confirmation at the 1.618 zone before entering. Always manage risk, especially near fib extension zones. 📅 Published on: July 14, 2025 📍 Timeframe: 1H 💬 Feel free to share your thoughts or setups below. Trade safe!
AwesomeOscDad
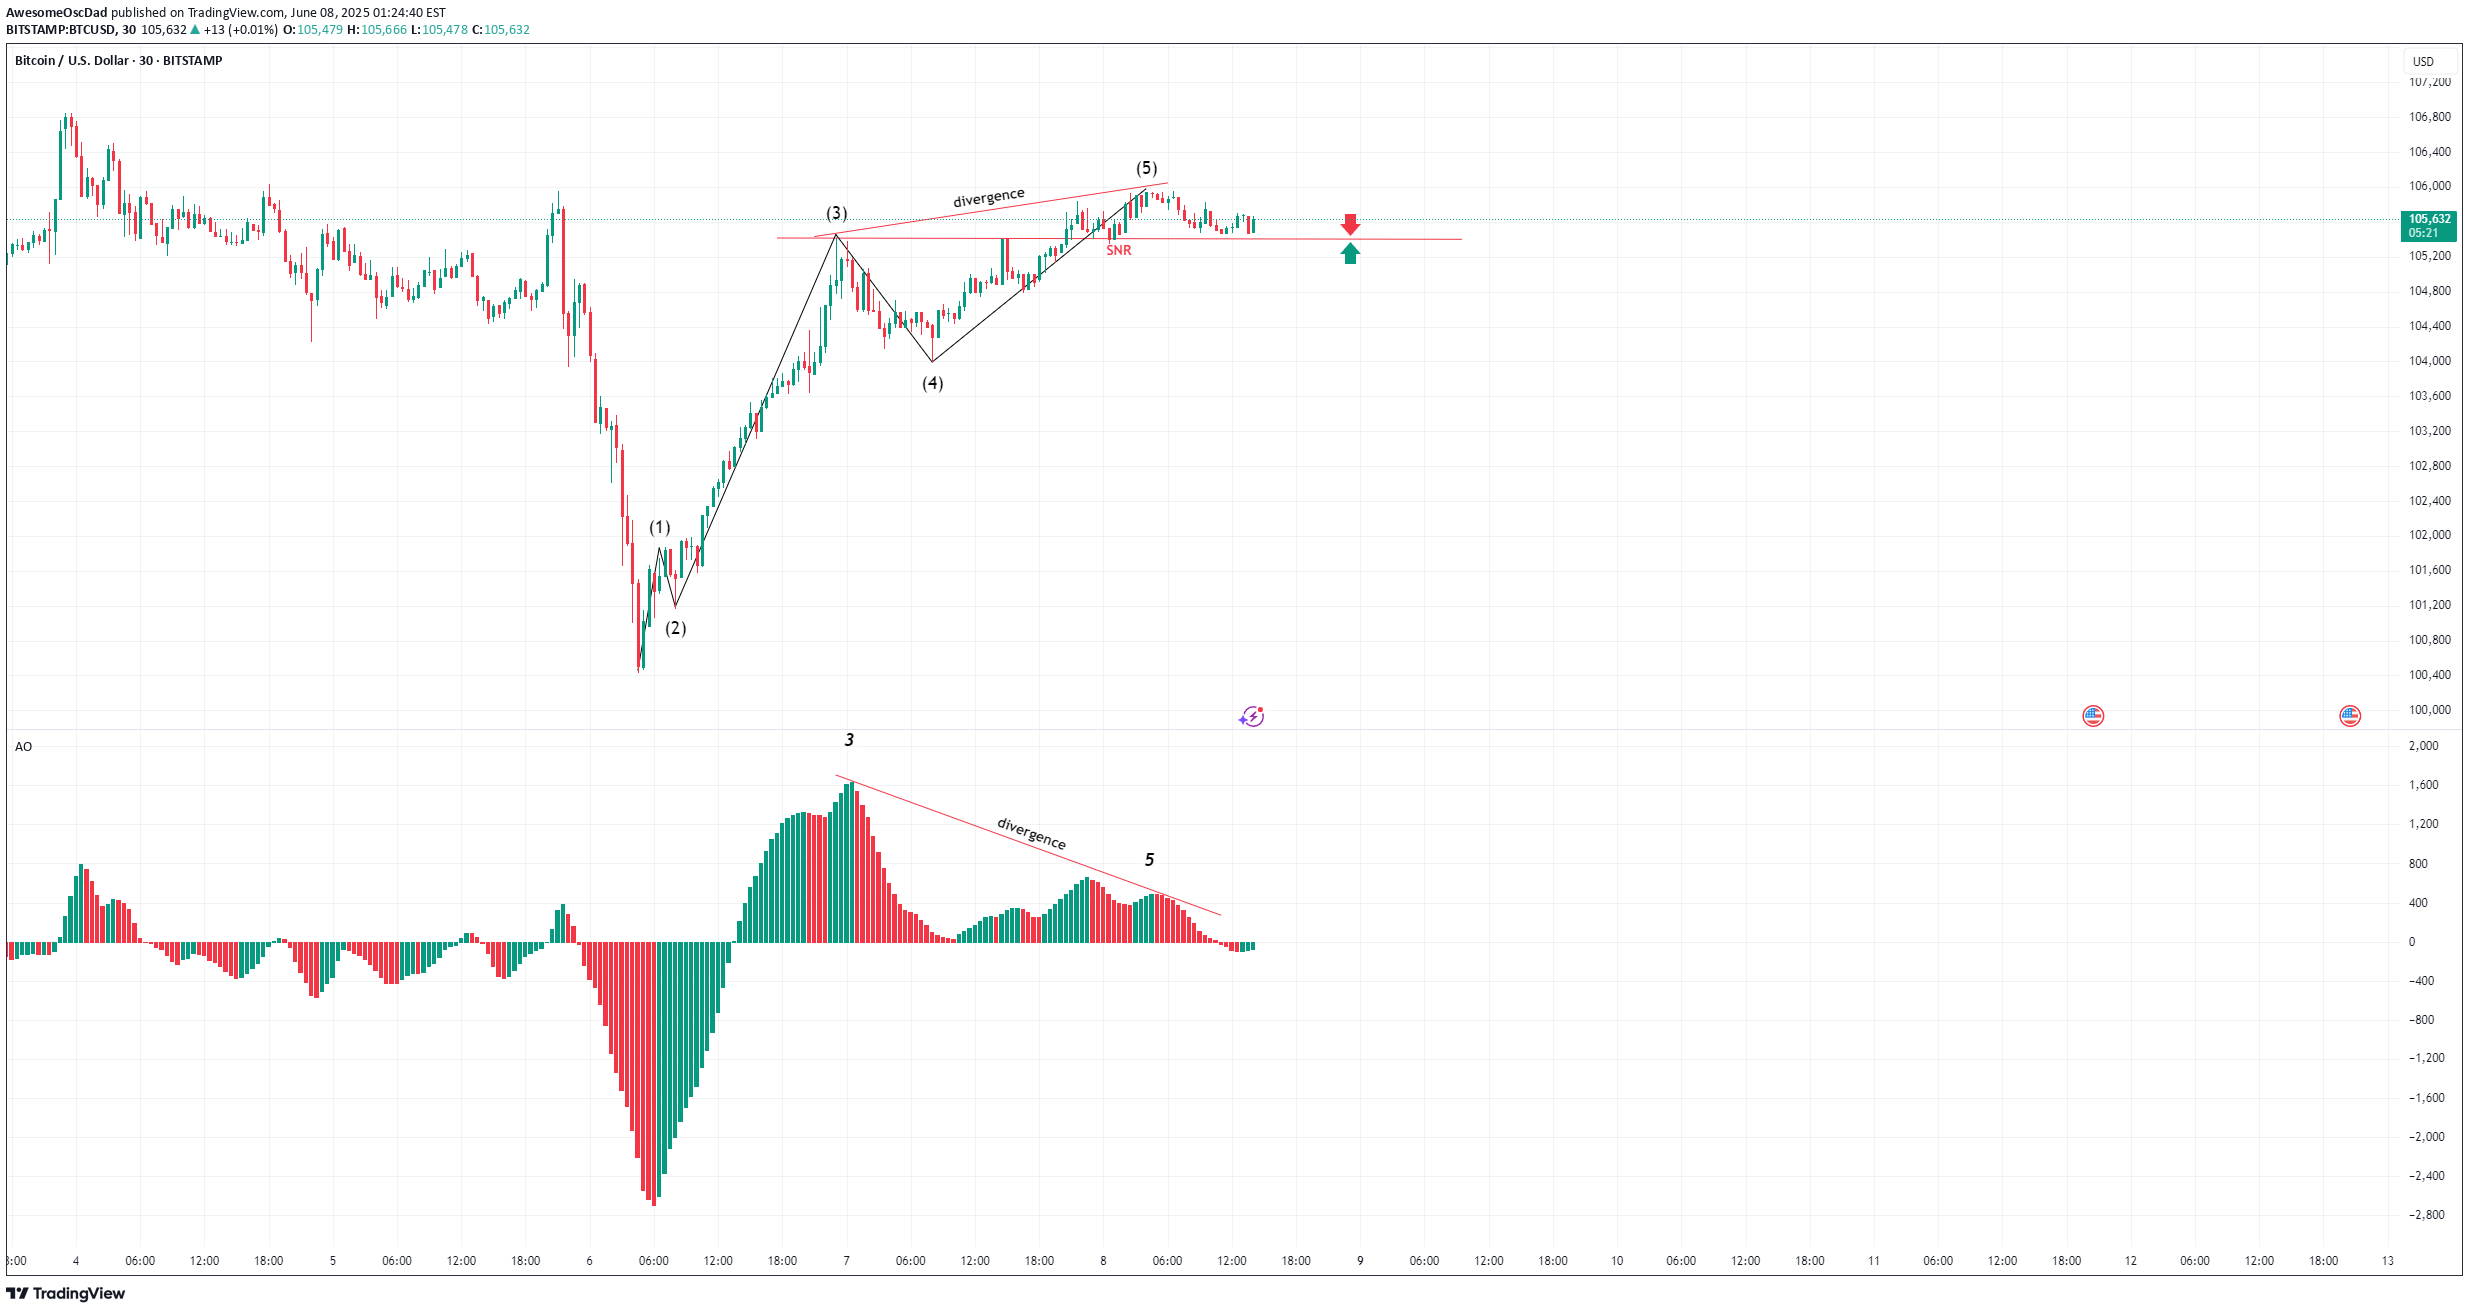
🕒 Timeframe: 30min📅 Date: June 8, 2025💱 Pair: BTC/USD (BITSTAMP)📊 Indicator: Awesome Oscillator (AO)🧠 Technical Analysis Summary:A classic 5-wave Elliott structure (1–2–3–4–5) has completed. Key observations:Wave (5) slightly pushes above Wave (3), but momentum weakens.Bearish divergence is spotted on the Awesome Oscillator (AO) between Wave (3) and Wave (5), signaling exhaustion.Price is currently holding above a key structure support (SNR) at 105415.🔻 Sell Setup:🟥 SNR = Structure level at 105415.🧨 If price breaks below 105415, I will enter a short (sell) position.🧠 This level acts as a confluence zone:End of wave 5Loss of bullish momentumBearish AO divergencePotential trend shift📌 Trade Plan:💥 Action:➡️ Sell only if price breaks and closes below 105415.🎯 Potential Targets:104200 – local structure support102800 – deeper correction zone (possible wave A)🛡️ Invalidation:➡️ If price closes back above recent high (~105800) with renewed AO strength, I’ll reconsider the short.🧰 Tools Used:Elliott Wave Theory (1–5 structure)Awesome Oscillator – Divergence ConfirmationMarket Structure (SNR as key support)💬 Conclusion:Wave 5 is done. Momentum has faded. All eyes on the structure level at 105415.➡️ Break = Sell.If it holds, no trade.📌 Stay patient. Let the market come to you.🔔 Like & follow if you enjoy clean Elliott Wave and momentum divergence setups.Got your own wave count? Drop it below! 👇#BTCUSD #Bitcoin #ElliottWave #BearishDivergence #AO #CryptoTrading #StructureBreak #PriceAction #Wave5Complete
AwesomeOscDad
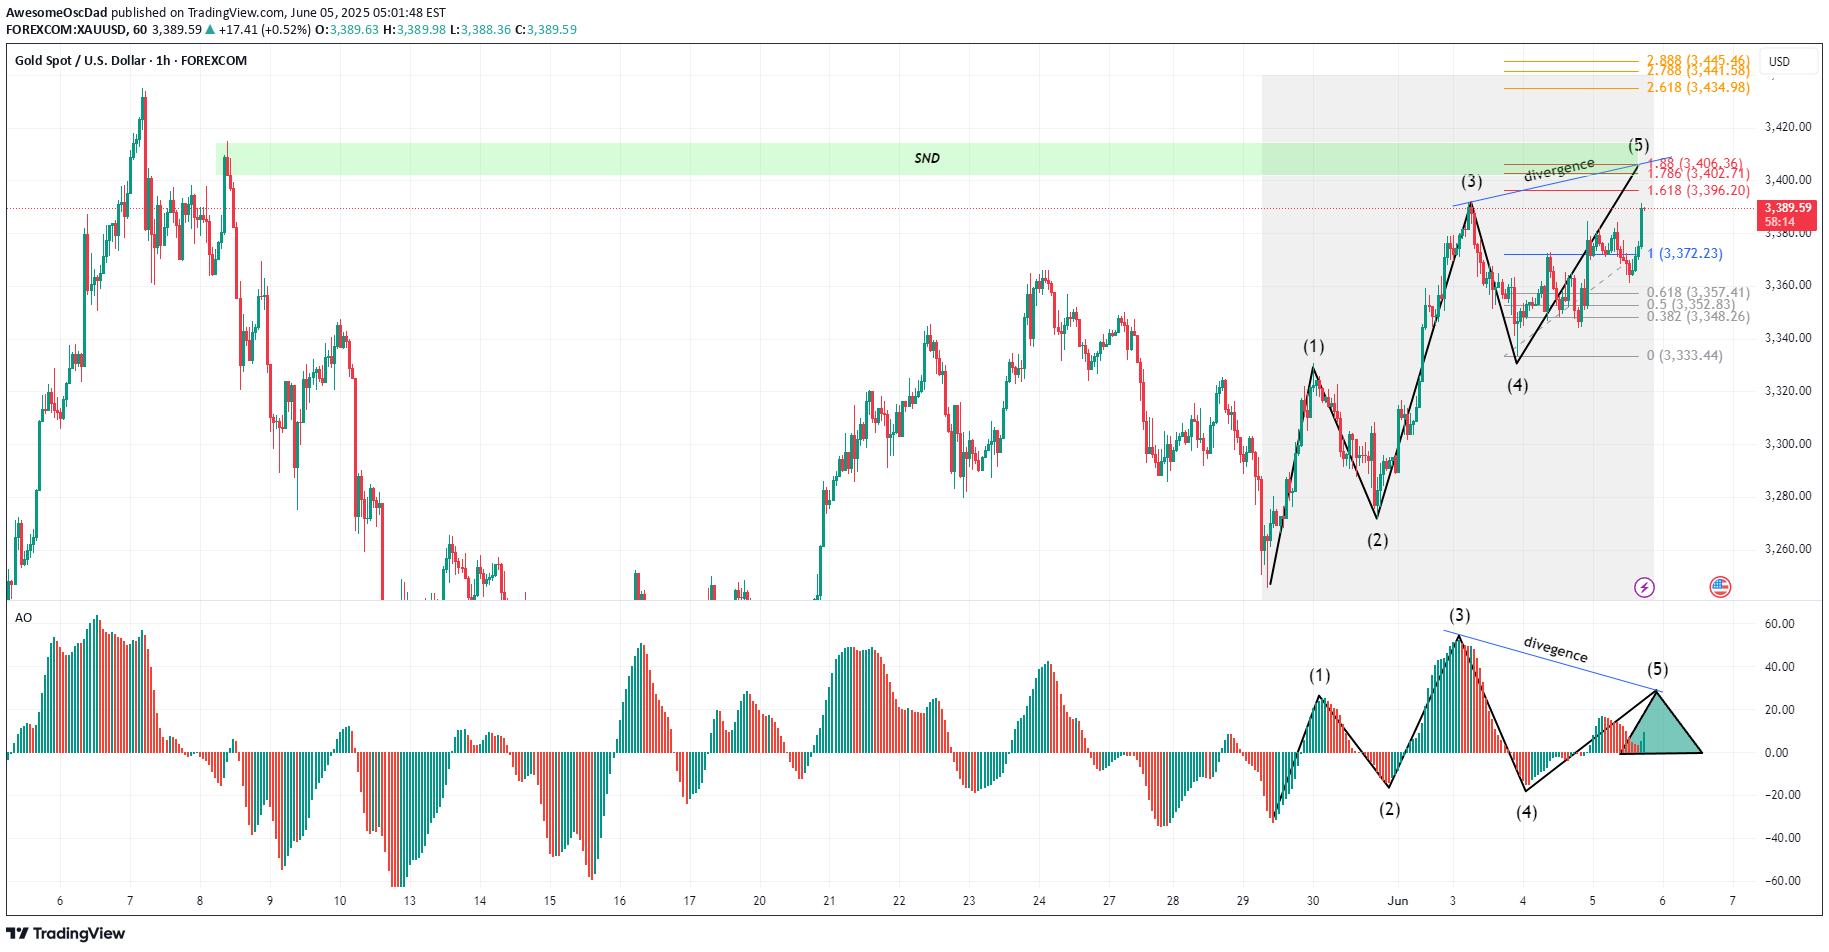
🟡 XAUUSD (Gold) – Bearish Setup in Play | H1 Wave Count + AO Divergence 🟡🗓️ Date: June 5, 2025📉 Timeframe: 1H🔍 Elliott Wave Count:The current structure appears to have completed a classic 5-wave impulse.Wave (5) has just printed, and notably, Awesome Oscillator (AO) confirms a divergence:Wave 3 had a higher AO peak than Wave 5, signaling bearish momentum loss.This divergence is a strong reversal signal, often preceding a corrective move (ABC).📊 Technical Confluence:Price is now entering a key Supply and Demand (SND) zone between 3401 – 3414, an area that previously caused a strong rejection.Multiple Fibonacci extensions also cluster near this level:1.618 and 2.618 extensions align closely with current highs.These confluences further strengthen the sell bias.📉 Trade Idea:🎯 Bias: Bearish📍 Entry Zone: Around 3401 – 3414❗ Confirmation: Look for bearish engulfing candle or breakdown from rising wedge🎯 First Target: 3372 (Fib 0.618 retracement of wave 4–5)🎯 Second Target: 3357 or deeper if larger correction unfolds❌ Invalidation: Break and close above 3418🧠 AO Divergence Reminder:Divergence between price and oscillator like AO (lower momentum on a higher high) often signals exhaustion of trend — perfect timing for contrarian plays at strong SND zones.📌 Summary:Wave (5) completion with AO divergence near a significant SND zone (3414–3401) sets the stage for a high-probability short trade. Monitor lower timeframes for entry triggers.
AwesomeOscDad
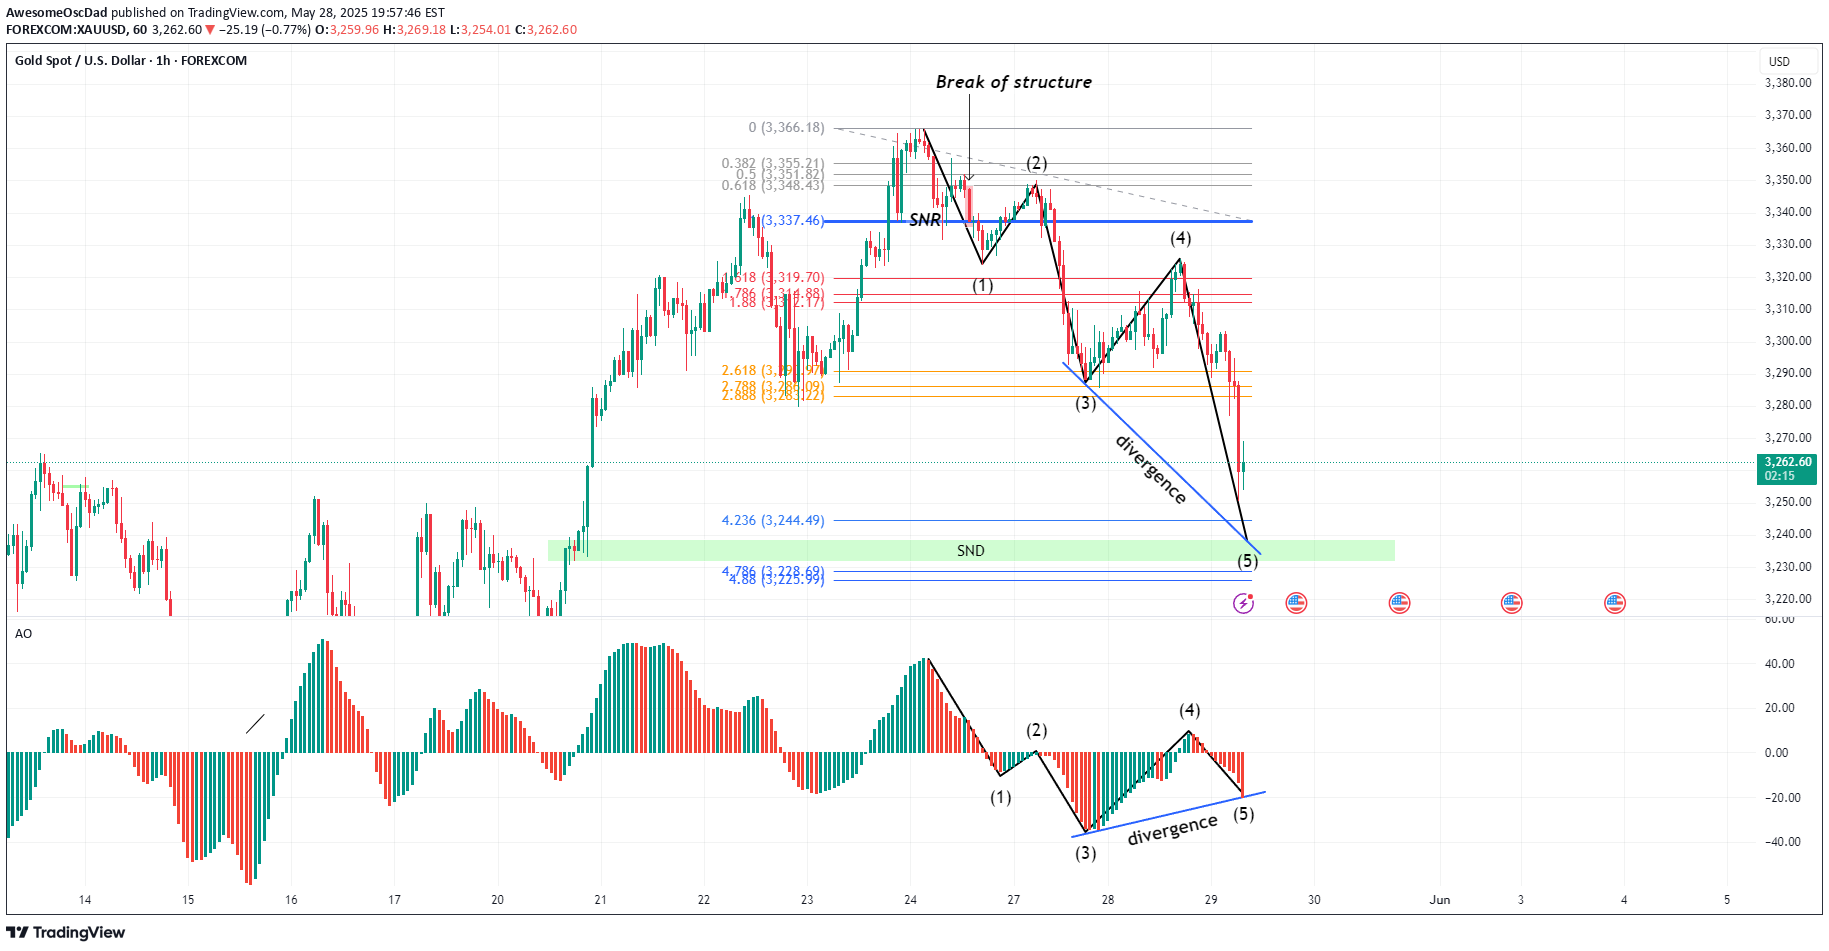
After a clean 5-wave bearish impulse, gold has finally tapped into a high-probability reversal zone! Here's what I'm seeing:🔹 Break of structure confirmed at 3337.46🔹 Price extended all the way to the 4.236 – 4.786 fib zone (3244–3228)🔹 Landed perfectly in the SNR zone (3238–3231)🔹 Bullish divergence spotted on the Awesome Oscillator (AO)🔹 Now printing a bullish engulfing right at demand? 👀📍 This is a textbook reversal setup.💡 Waiting to Buy:If price shows continued bullish intent or lower timeframe confirmation, I’m looking to enter long from the 3238–3231 area, targeting back to the Fib retracement zones and potentially the structure break at 3337.46.🛡️ SL just below the 4.786 fib extension for safety.🔥 Summary:✅ Structure broken✅ AO divergence✅ Engulfing at SNR + fib confluence🎯 Buy zone activated – now waiting for confirmation!📌 Let the market come to you. No rush. Just watching for that golden reversal.#XAUUSD #GoldReversal #FibExtension #AOdivergence #ElliottWave #BullishSetup #BuyZone #SmartTrading #ForexAnalysis
AwesomeOscDad
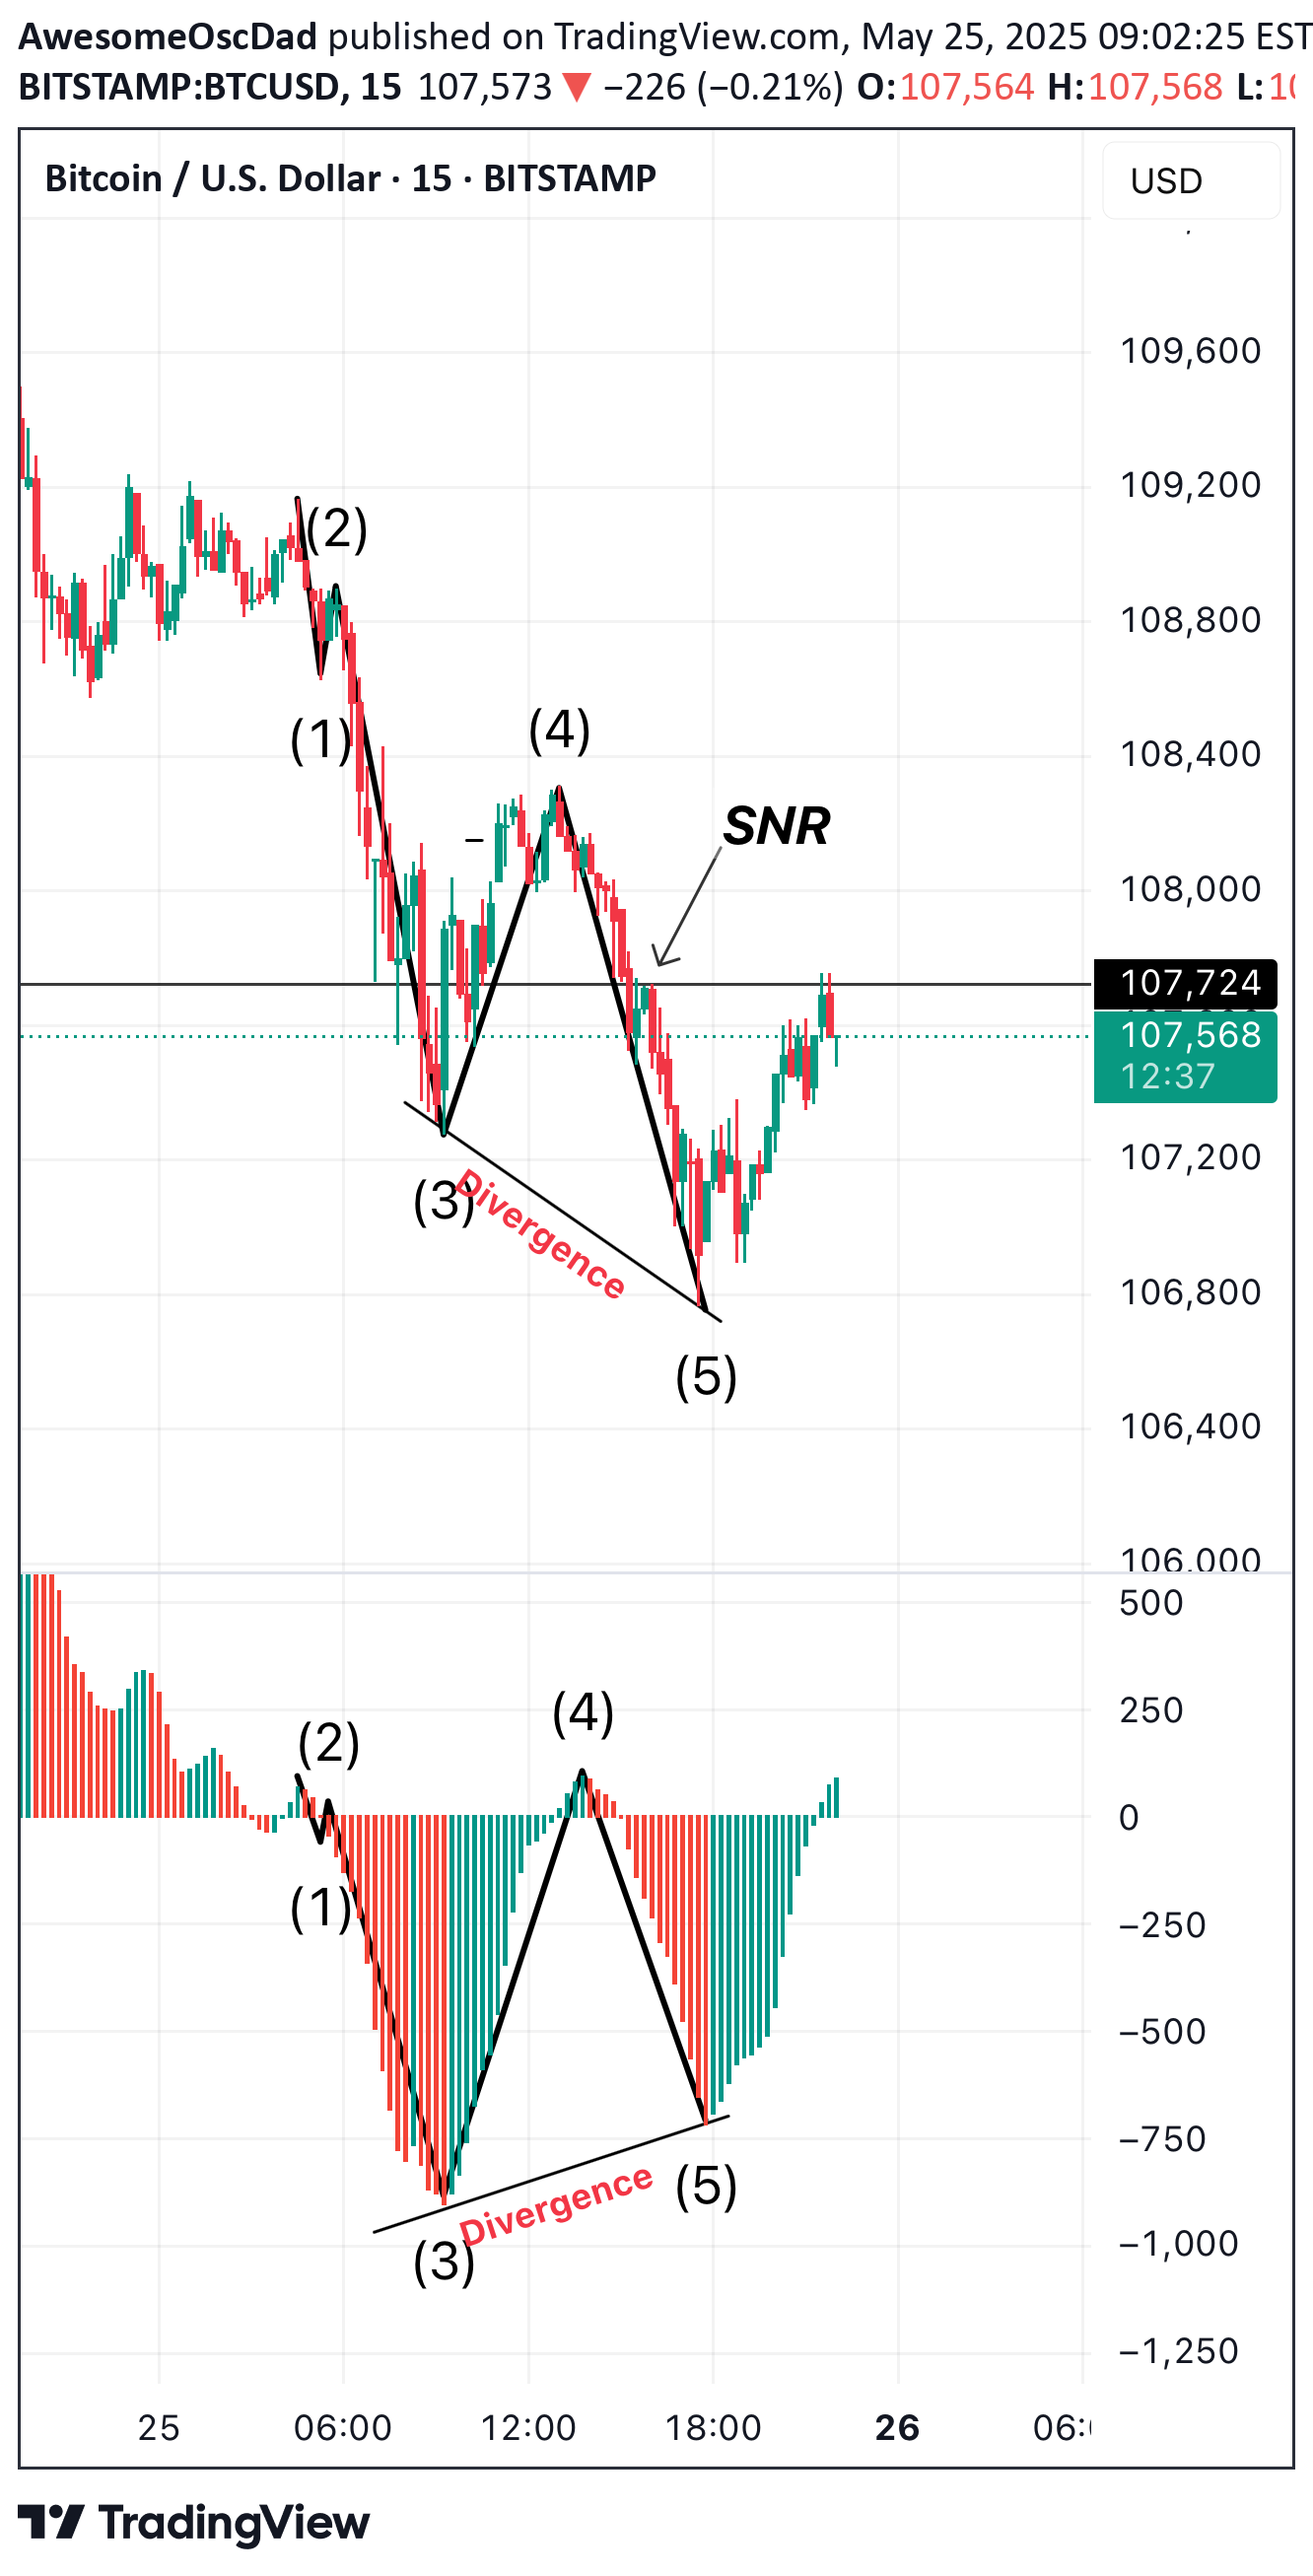
🕒 Timeframe: 15-Minute💰 Pair: BTC/USD⸻🔍 Wave Structure & Momentum AnalysisUsing Elliott Wave Theory, we can clearly identify a completed 5-wave impulsive move down:•(1) → (2) → (3) → (4) → (5)•Wave (5) completes with a bullish divergence against the Awesome Oscillator (AO), signaling weakening bearish momentum.•Both price and AO show a clear divergence between wave (3) and wave (5), hinting at a possible reversal or corrective phase.⸻🔁 Break of Structure & SNR Zone•Price is currently reacting to a key Support-turned-Resistance (SNR) level around 107,724.•A confirmed break and close above this SNR will mark a break of structure, strengthening the bullish case.•I will wait for the price to close above 107,724 on the 15M timeframe to confirm this break.⸻🧠 What’s Next? ABC Retracement for Entry•Upon break of structure, I will look for a nearest bullish Supply & Demand (SND) zone as a potential entry point.•Ideally, I will wait for an ABC corrective retracement (after the break) to enter long.•Entry will be placed at the base of the SND zone formed during the corrective leg.⸻📌 Trade Plan Summary•✅ Wave 12345 completed (impulse wave down).•✅ Bullish divergence confirmed with AO.•⚠️ Watching for break and close above 107,724 (key SNR).•🔎 If broken, wait for ABC correction into SND zone to initiate long position.•🎯 Target: Mid to Upper structure zone based on previous supply.•❌ Invalidation: If price fails to break above 107,724 or breaks below recent swing low (wave 5), setup is void.⸻📈 Technical Confluence•Elliott Wave Count•AO Divergence•Break of Structure (BoS)•SNR Level•Awaiting ABC Pullback into SND⸻💬 Let me know what you think! Are you seeing the same structure? Waiting patiently for confirmation before entering.#BTCUSD #ElliottWave #BreakOfStructure #SupplyAndDemand #AO #CryptoAnalysis #SmartMoney #15MinChart
AwesomeOscDad
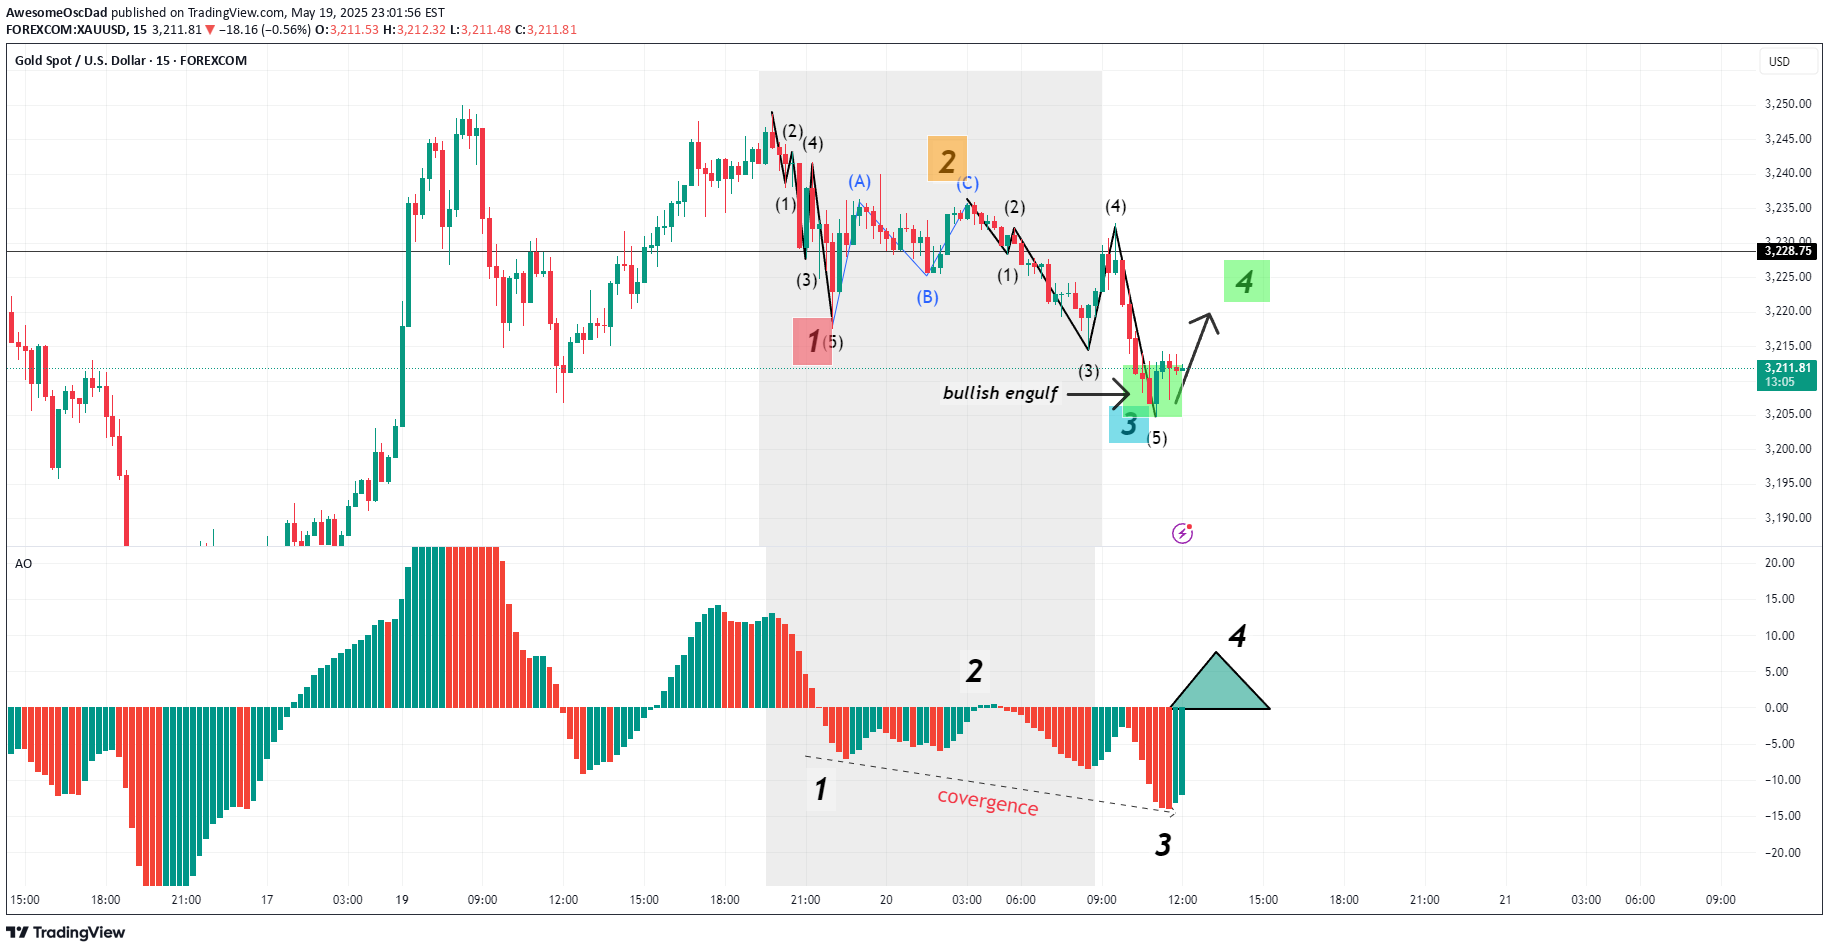
📈 GOLD (XAU/USD) - Bullish Wave 4 Retracement in Progress 💥15-Minute Chart | Elliott Wave | AO Convergence | Bullish Reversal🔍 Market Context:Gold has completed a clear 5-wave impulsive move down from the 3228.75 resistance zone. Based on Elliott Wave Theory, we are now seeing the beginning of Wave 4, a corrective retracement before a potential Wave 5 continuation lower.🧠 Technical Breakdown:✅ Wave Count:Wave 3 completed with strong bearish momentum, ending in a classic 5-subwave structure.We're now seeing a bullish engulfing candle at the termination of Wave 3, signaling a potential Wave 4 correction.Price is currently showing strength to the upside, likely retracing to test the previous supply zone near 3,228.75.✅ Awesome Oscillator (AO):Notice the bullish divergence (or convergence) forming between Wave 1 and Wave 3 lows.Momentum is waning, suggesting the sell-off is losing steam—an ideal condition for a Wave 4 bounce.Histogram bars are beginning to flip green, indicating short-term bullish strength.✅ Price Action Confirmation:The bullish engulfing candle marks a potential reversal zone.Wave (5) of 3 appears to be completed in the green box region, aligning with historical demand.A breakout above the small pullback could accelerate the move toward the 3220–3228 area.🎯 Trade Idea (Short-Term):Bias: Bullish retracement (Wave 4)Entry: On break of bullish engulfing highTarget: 3220 – 3228 zone (Fib or prior structure resistance)Invalidation: Close below 3190 or break of bullish engulfing low📢 What to Watch Next:Monitor for bearish signals around 3228 to prepare for a potential Wave 5 drop.If price stalls or forms bearish divergence near resistance, it may offer a high-probability short setup.💬 Let me know in the comments if you're riding this retrace or waiting for Wave 5! Drop a 👍 if you like clean wave structure analysis!#XAUUSD #GoldAnalysis #ElliottWave #Wave4 #AO #BullishEngulfing #TradingView #PriceAction #TechnicalAnalysis
AwesomeOscDad
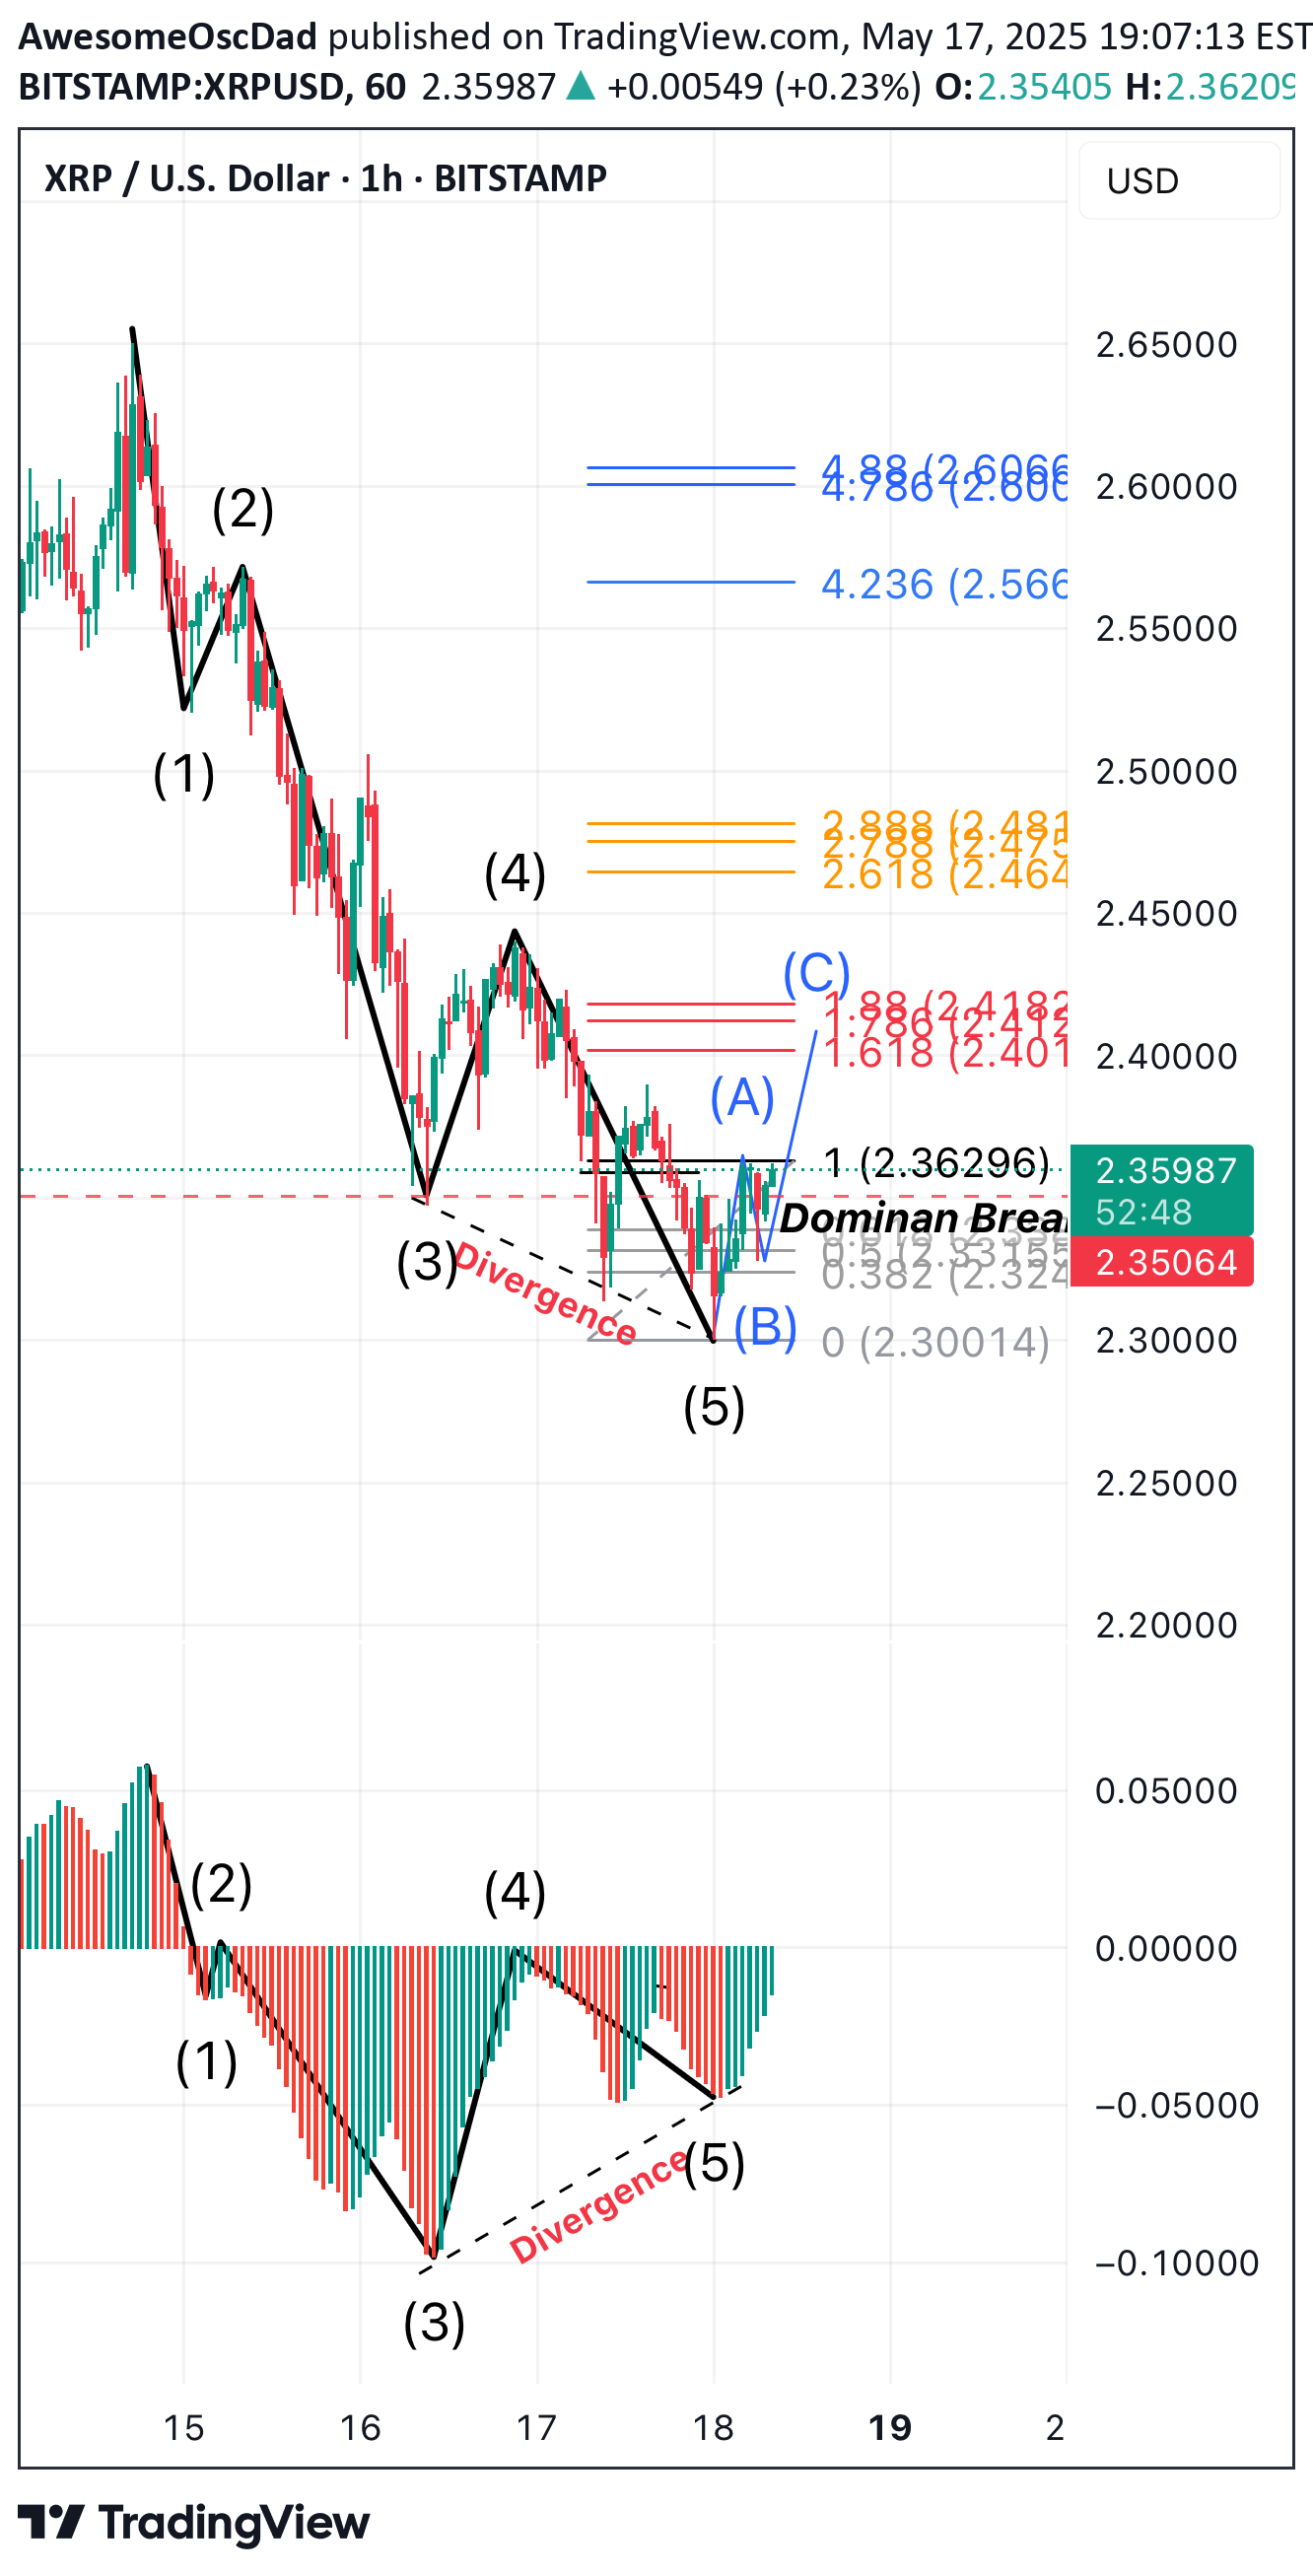
📊 XRP/USD – Bullish Reversal in Progress After Wave 5 CompletionTimeframe: 1HStructure: Elliott Wave + Divergence + Break of StructureIndicators Used: Awesome Oscillator (AO), Fibonacci Retracement, Market Structure⸻🧠 Wave Count & Structure AnalysisWe’ve just completed a clean 5-wave Elliott impulsive structure to the downside:•✅ Wave 1–5 clearly marked with strong bearish momentum•✅ Wave (3) and Wave (5) show bullish divergence on the Awesome Oscillator (AO) – a classic sign of weakening bearish momentum and potential reversal•✅ Wave (5) completed at the bottom with confluence from price action and AO divergence⸻🔁 Break of Structure & Confirmation•✅ Break of structure (BoS) occurred at 2.35064, confirming the end of the bearish impulsive wave and the start of a potential ABC corrective phase•✅ The BoS also coincides with a dominant structure break, giving higher confidence in the trend shift⸻🟦 Current Price Action: ABC Corrective Wave FormingWe’re now in the early stages of a bullish corrective wave (ABC):•🔹 Wave A has likely completed•🔹 Currently expecting a retracement to form Wave B•🔹 Wave C target is projected based on Fibonacci extensions between 1.618 to 1.88, offering a high-probability take-profit zone (TP1)⸻🎯 Trade SetupPending Buy Entry:•📍 Entry Zone: Fibonacci retracement between 0.382 – 0.618 of Wave A•🎯 TP1: Fibonacci extension of Wave C between 1.618 – 1.88•❗ SL: Just below Wave (5) low or below 0.618 zone, depending on risk tolerance⸻🧩 Confluences for Bullish Setup•✅ Elliott Wave completion (Wave 5)•✅ Bullish Divergence on AO•✅ Break of Market Structure (BoS + Dominant BoS)•✅ Retracement into Fibonacci golden zone (0.382–0.618)•✅ Measured C wave extension to 1.618–1.88⸻📝 SummaryThe market has shown strong technical signals for a bullish corrective move after a clean Elliott 5-wave completion. With a confirmed divergence, break of structure, and upcoming ABC retracement, this setup offers a solid risk-to-reward opportunity. Watching the buy zone closely for a pending long trigger.⸻🔔 Disclaimer:This is not financial advice. Always conduct your own analysis and manage your risk accordingly.
AwesomeOscDad
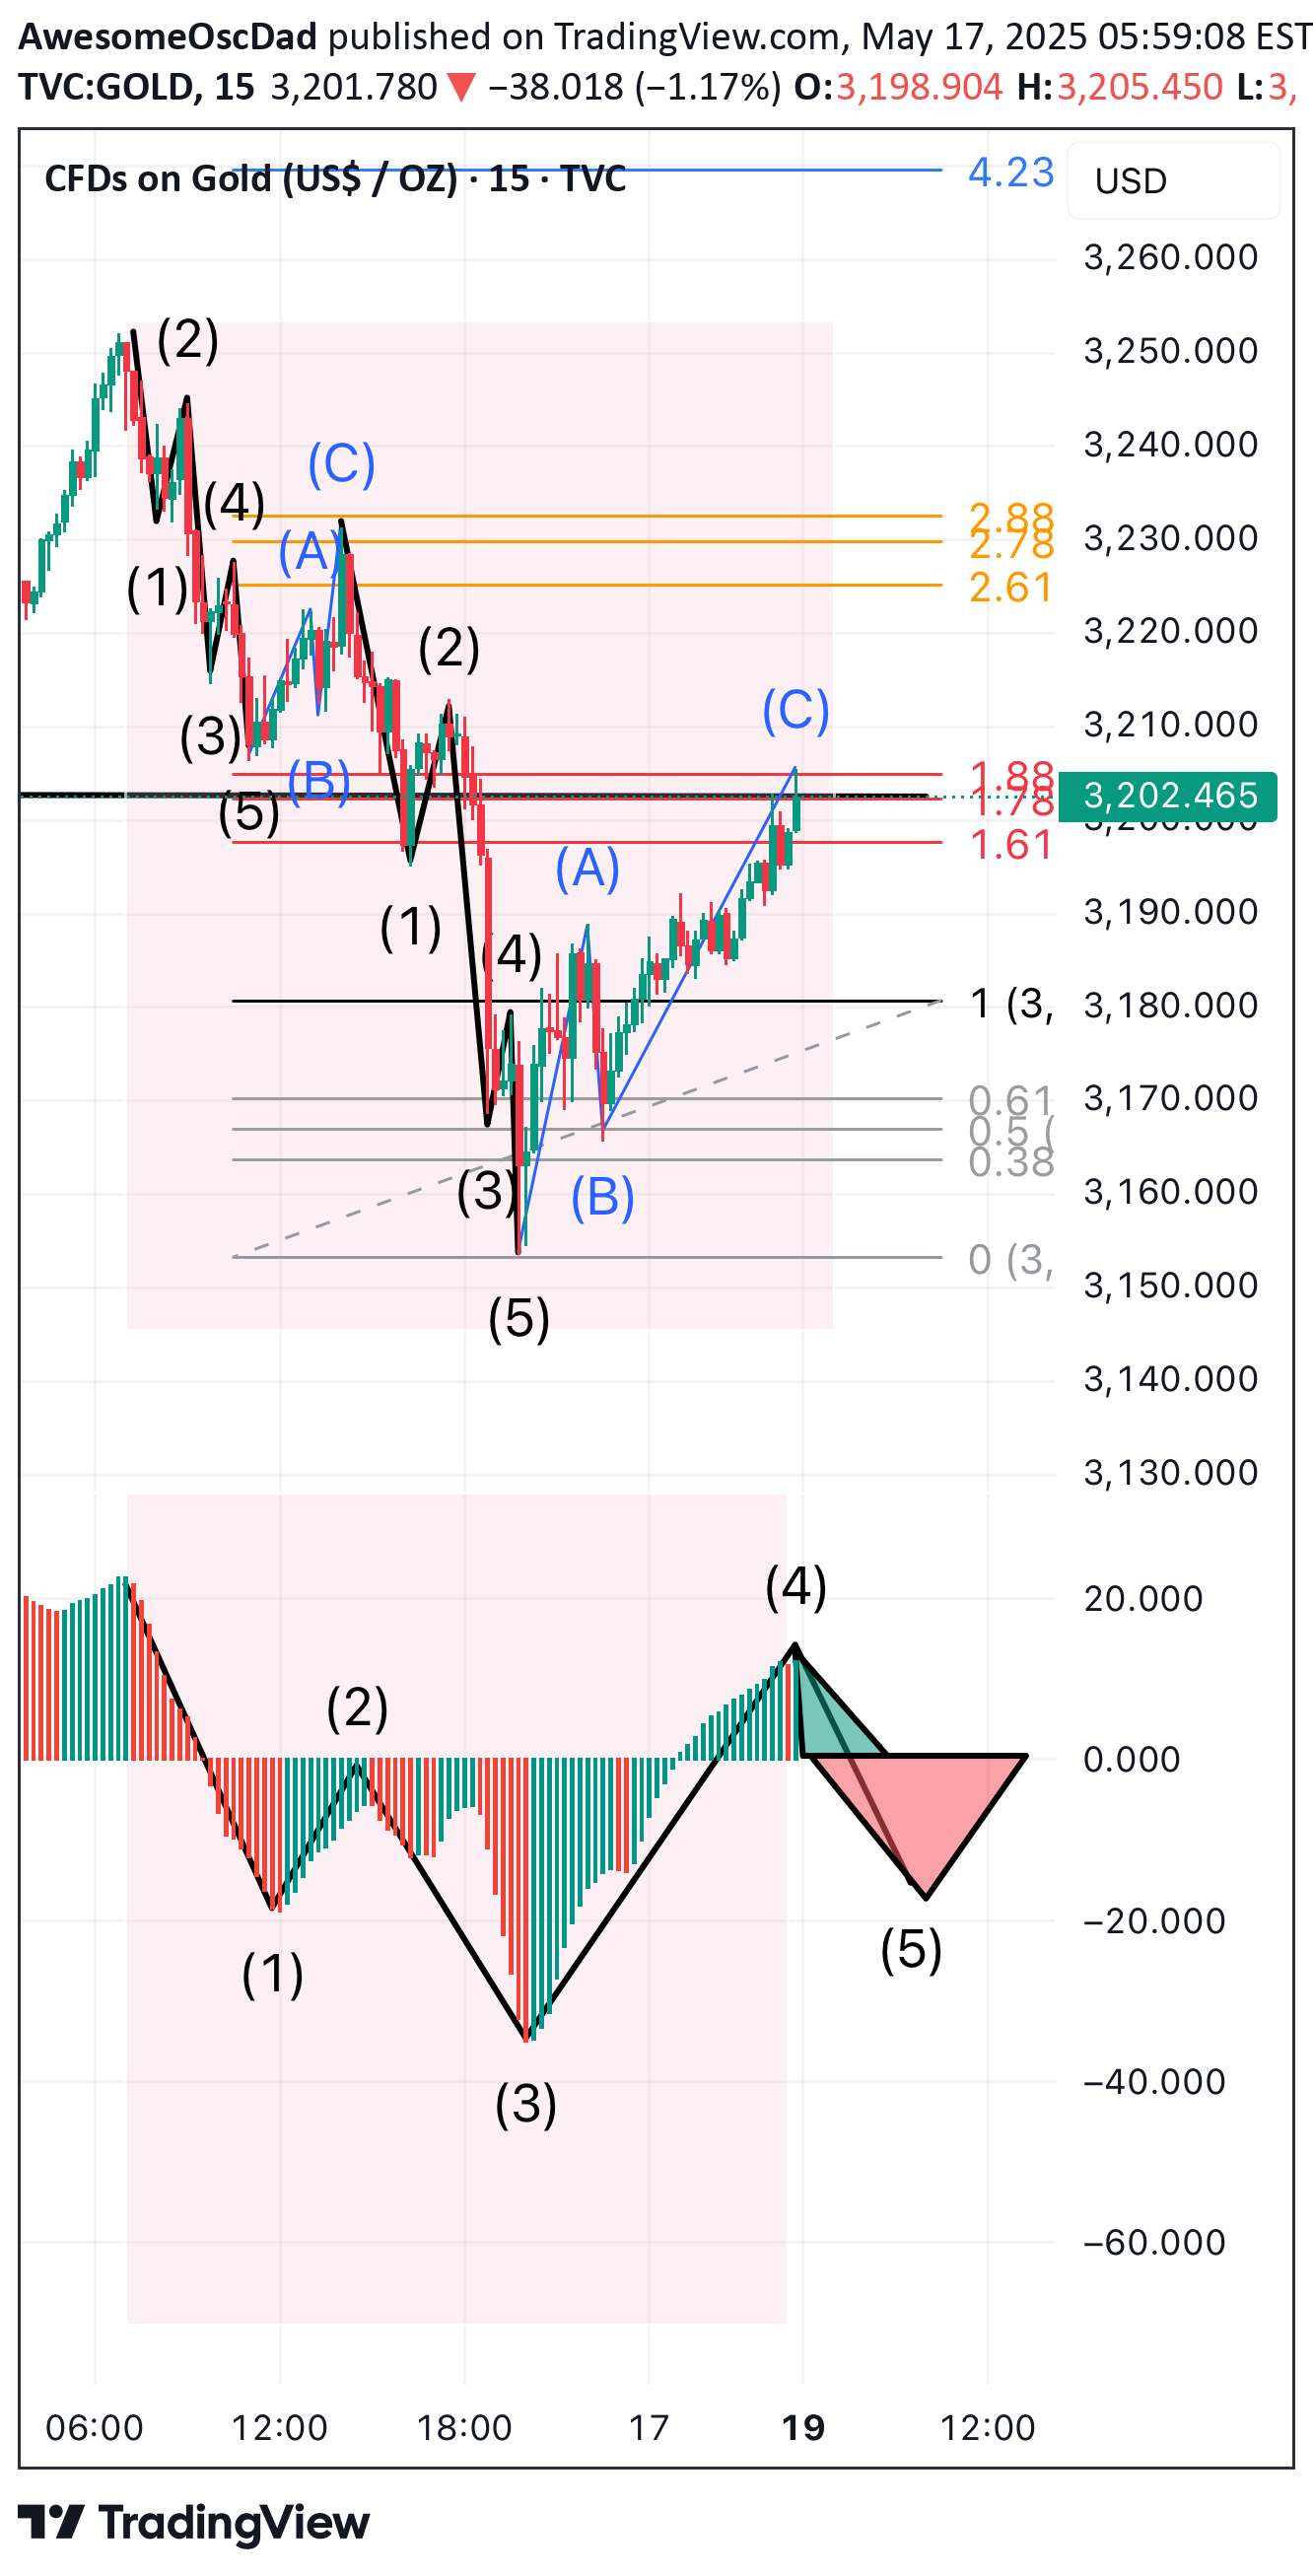
📉 Elliott Wave Analysis – Bearish Wave 5 Setup in Progress 🔍Watchlist: Short Opportunity at Completion of Wave 4⸻✅ Wave Count OverviewAs illustrated in the chart, we have a clear impulsive Elliott Wave structure unfolding. Waves 1, 2, 3, and 4 have been successfully completed, as confirmed by the Awesome Oscillator (AO) displaying healthy wave divergence and convergence throughout the formation.•Wave 3 extended beautifully, and now Wave 4 appears to have completed its corrective phase.•AO shows classic convergence during this retracement, confirming weakening bullish momentum — a hallmark sign of Wave 4 development nearing exhaustion.⸻📌 Key Technical Levels:•Wave 4 Top: Completed near the 1.618 Fibonacci extension, a textbook resistance zone for the end of a corrective wave.•Critical Resistance / SNR Level: 3202.465 – This zone acts as a major resistance, aligning perfectly with prior structure and fib confluence.•Important Rule: Wave 4 must not overlap with Wave 1 territory. So far, this rule remains respected. A break below this would invalidate the current count.⸻🎯 Wave 5 Trade Setup – Bearish BiasLooking ahead, I’m anticipating the final leg down – Wave 5 – to unfold from this resistance region. This presents a potential shorting opportunity for high-probability traders.•Wave 5 Target Zone:🔻 1.618 - 1.88 Fibonacci extension from Wave 3🔻 Expect strong bearish momentum to kick in as Wave 5 progresses🔻 AO should shift strongly red again, confirming impulse resumption⸻💡 Summary & Trading Plan:•✅ Wave 4 looks completed based on Fibonacci confluence + AO convergence•🔥 Resistance at 3202.465 is the key level to watch•📉 Enter short once price confirms rejection and momentum shifts•🎯 Target zone: 1.618 - 1.88 fib extension below•❗ Risk: Setup invalidated if Wave 4 enters Wave 1’s price zone👉 Let’s ride Wave 5 together! 🚀💥#elliottwave #tradingviewanalysis #wavecount #shortsetup #technicalanalysis #priceaction #aoindicator #wave5incoming
AwesomeOscDad
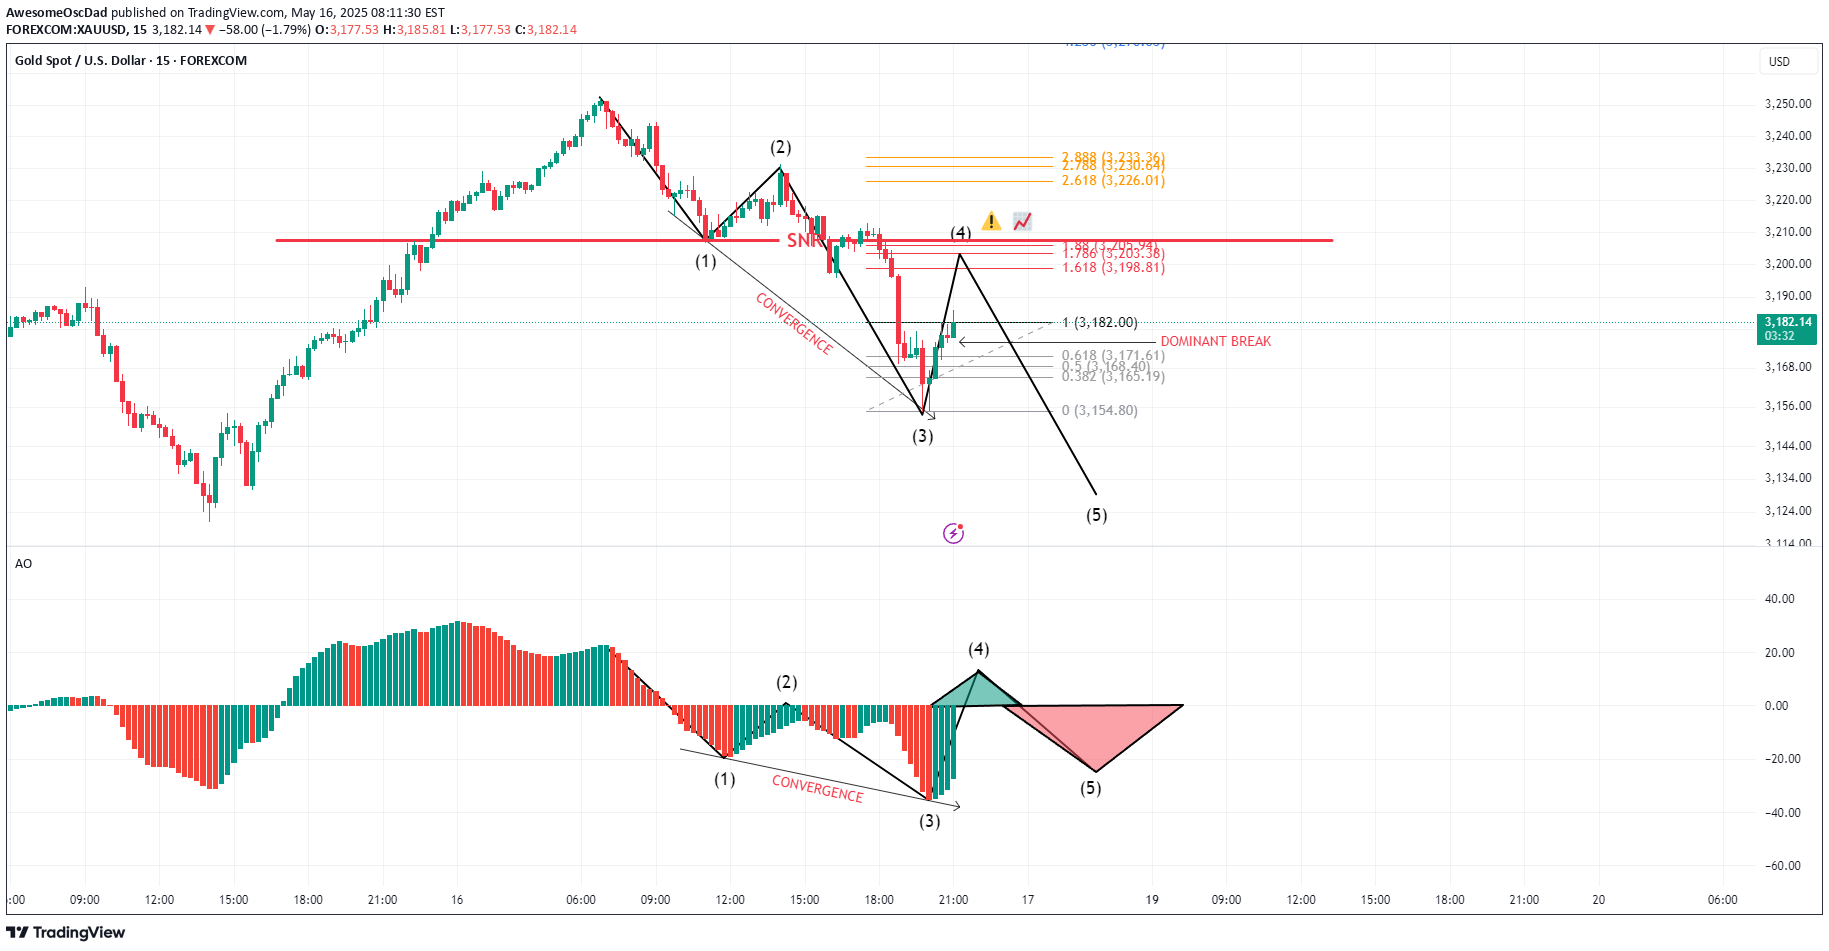
🟡 XAUUSD Elliott Wave Analysis (15M TF) – Wave (4) Forming, Short Setup in Play📅 Date: May 16, 2025📈 Instrument: Gold (XAU/USD) – 15M Chart🔍 Technique: Elliott Wave, SNR, Fibonacci, AO Convergence✅ Wave Count SummaryWe have a clean 5-wave Elliott structure unfolding:✅ Wave (1), (2), and extended Wave (3) are completed.🔄 Price is now in a Wave (4) pullback phase.🔽 Anticipating a final push down for Wave (5).🔍 Wave (4) Confluence Zone (Short Setup)Price is currently approaching a strong confluence zone around 3196, which includes:📌 Confluences at 3196:🔴 SNR (Support-Turned-Resistance): Historical reaction level🌀 Fibonacci Retracements:0.618 of wave (3) = 3171.61.618 Fib Extension (minor internal leg) = 3198.81Several Fibo clusters between 3195–3200📐 Dominant Break occurred previously → retest likely🕯️ Bearish Reaction Expected: Monitor for reversal candlesticks near this level💡 This is the ideal entry zone for Wave (5) shorts.📉 Wave (5) Bearish Target ProjectionsUsing Fibo projections from Wave (3) to (4), expect:Target LevelDescriptionPrice Zone🎯 TP1100% of Wave (1) extension~3154.80🎯 TP2Full Wave (5) extension zone~3135–3140📊 AO Divergence may signal Wave (5) completion as momentum fades.💼 Trade Setup Idea(For educational purposes – follow your own strategy & confirmation rules)ParameterValueEntry Zone3195–3198 (SNR + Fibo)Stop Loss3206–3210 (above structure)TP13155 (safe zone)TP23135 (extended target)Risk–Reward~1:2.5 to 1:3 depending on SL📌 Confirmation Tips:Wait for bearish engulfing or pin bar near 3196.Watch for AO turning red = sign of bearish momentum resuming.🧠 ConclusionWave (4) looks to be maturing near the 3196 SNR/Fibo cluster, with a bearish reaction expected to kickstart Wave (5). This setup offers a great R:R opportunity if confirmed by price action. Patience and confirmation are key — don’t front-run until a rejection forms.📈 Let the chart do the talking. Trade what you see.
AwesomeOscDad
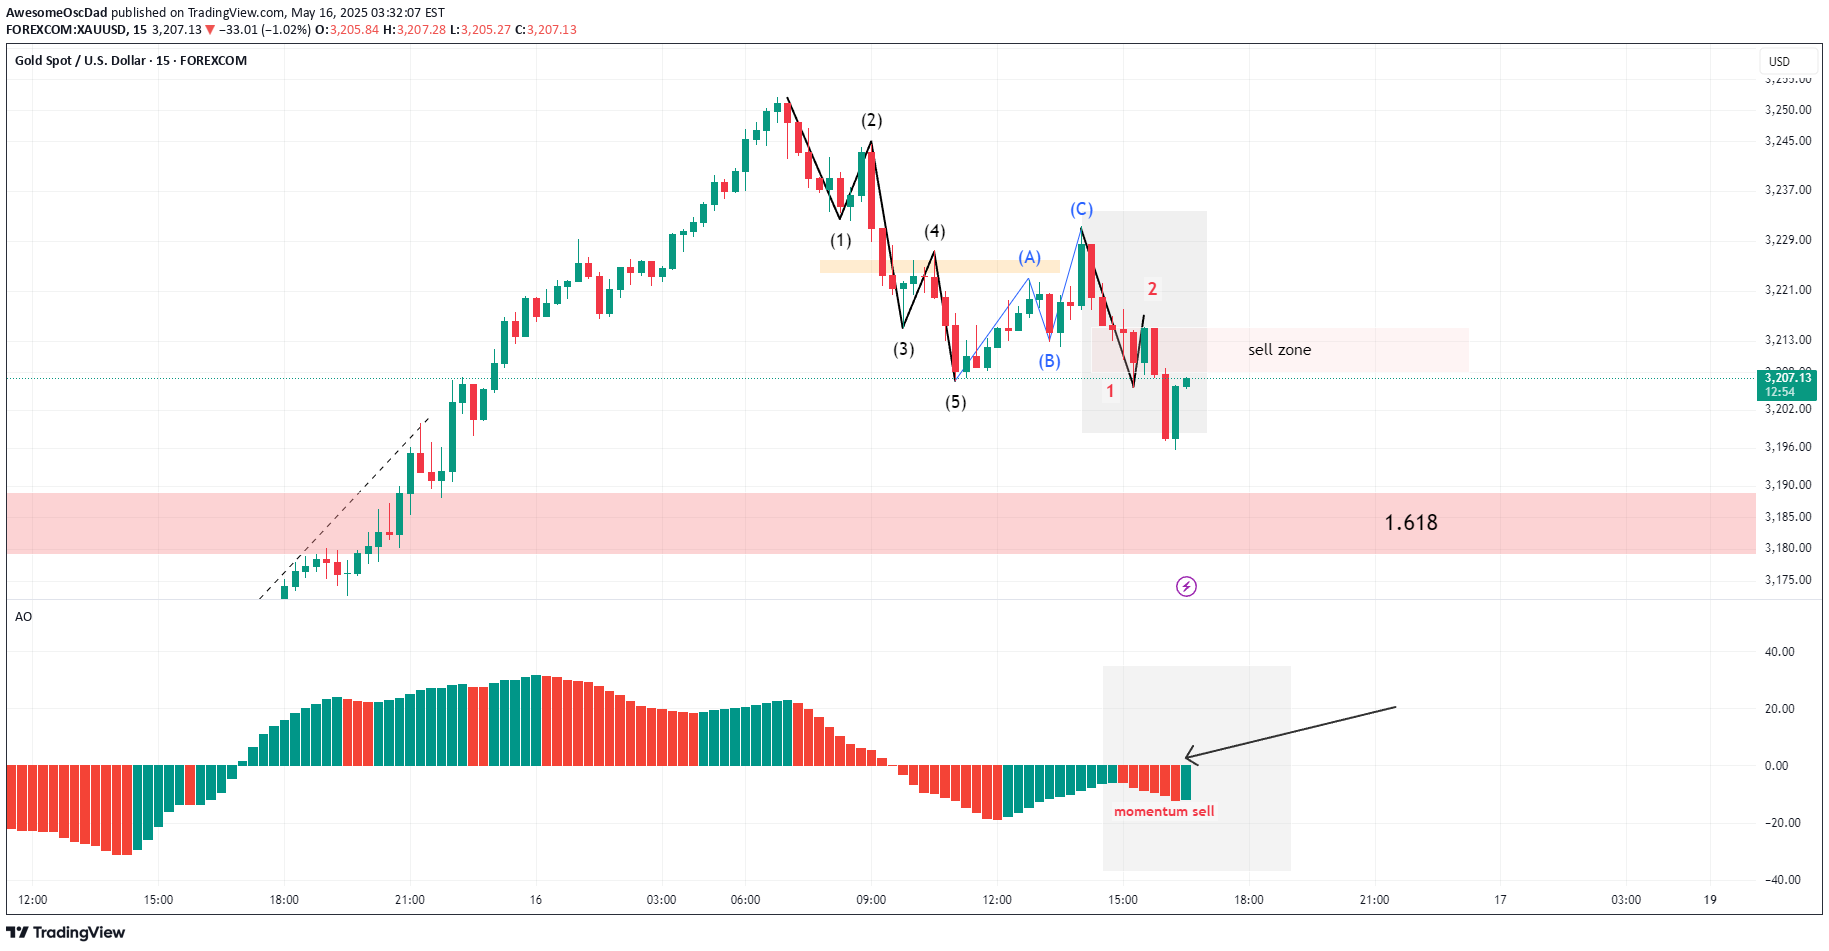
🔍 Technical Breakdown:The M15 chart has completed a 5-wave impulsive decline, followed by a clear ABC corrective structure.Price has now broken below the (B) wave low, suggesting the beginning of Wave 3 to the downside.A bearish sell zone is identified between 3208 – 3215, which aligns with previous structure and Fibonacci retracement levels.The Awesome Oscillator (AO) has printed a fresh red histogram bar, confirming a momentum sell signal—perfect timing for Wave 3 initiation.🎯 Trade Setup:Sell Limit Zone: 3208 – 3215 (shaded red area)Stop Loss: Just above Wave (C) high or around 3218Take Profit Zone: Targeting the 1.618 Fibonacci extension (~3180 area)📌 Confluence Factors:Elliott Wave structure supports the Wave 3 sell.AO confirms bearish momentum returning after correction.Strong rejection expected from previous structure zone (supply area).⚠️ Risk Note:Wave 3 often brings strong movement—stay disciplined with stop placement and position sizing.💬 This setup is clean and supported by momentum tools—wait for a pullback into the zone and let price action confirm before entering.
Disclaimer
Any content and materials included in Sahmeto's website and official communication channels are a compilation of personal opinions and analyses and are not binding. They do not constitute any recommendation for buying, selling, entering or exiting the stock market and cryptocurrency market. Also, all news and analyses included in the website and channels are merely republished information from official and unofficial domestic and foreign sources, and it is obvious that users of the said content are responsible for following up and ensuring the authenticity and accuracy of the materials. Therefore, while disclaiming responsibility, it is declared that the responsibility for any decision-making, action, and potential profit and loss in the capital market and cryptocurrency market lies with the trader.